 Dev Design Library
Area Chart Components
Dev Design Library indexes 66 area chart components from 17 open-source UI libraries, with the most coming from Tremor Blocks, shadcn/ui, Shark UI, Panel UI and ReUI. Each one links to its page with the source code, a live preview where available, the library license and the install command. Area chart components belong to the Data display group.
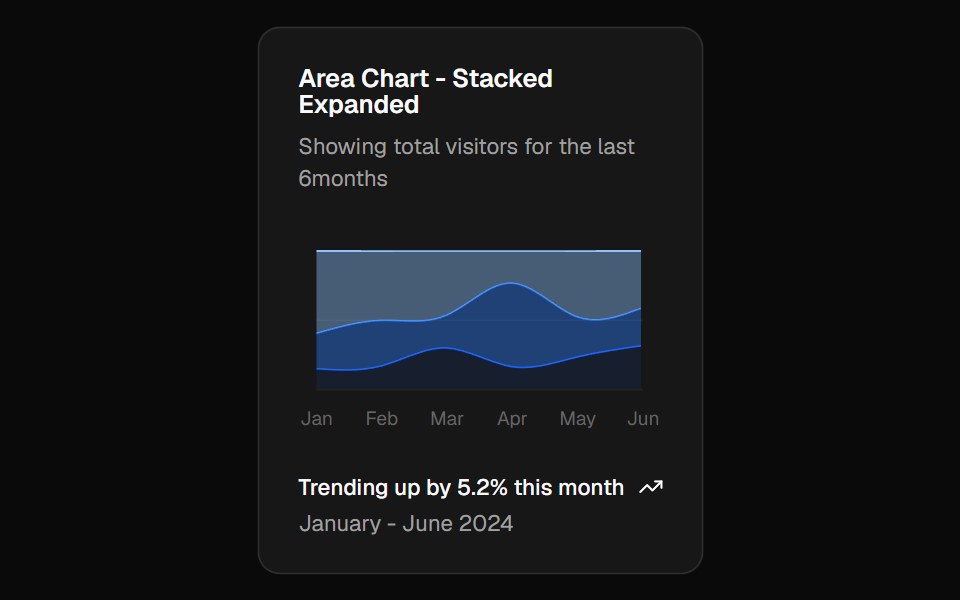 Chart Area Stacked Expandshadcn/ui · ReactStacked area chart example normalised to 100%, showing each series as a share of the total.
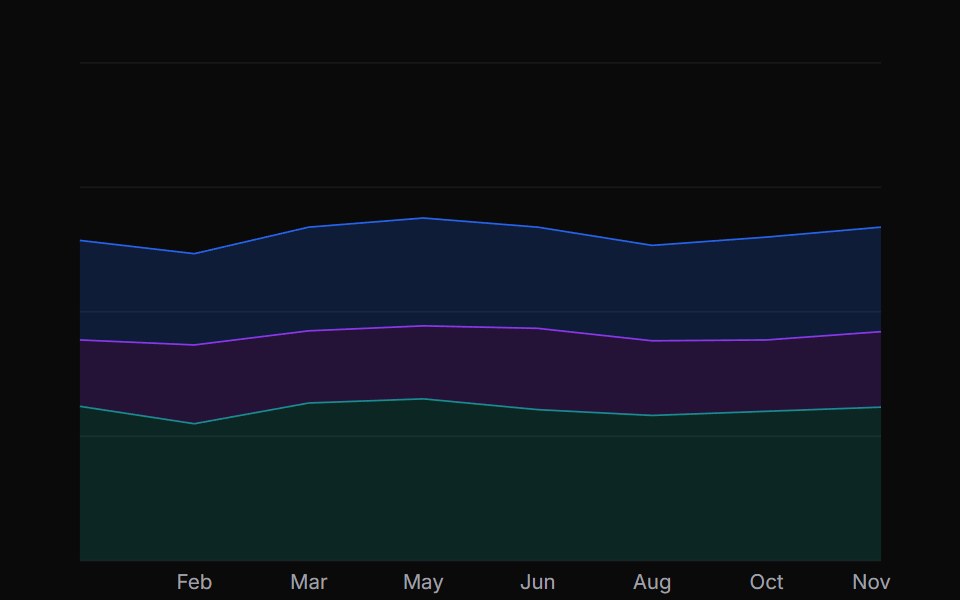 Area ChartChakra UI · ReactUsed to display quantitative data by filling the area between the line and axis, showing trends and patterns over time
 Area ChartTremor · React
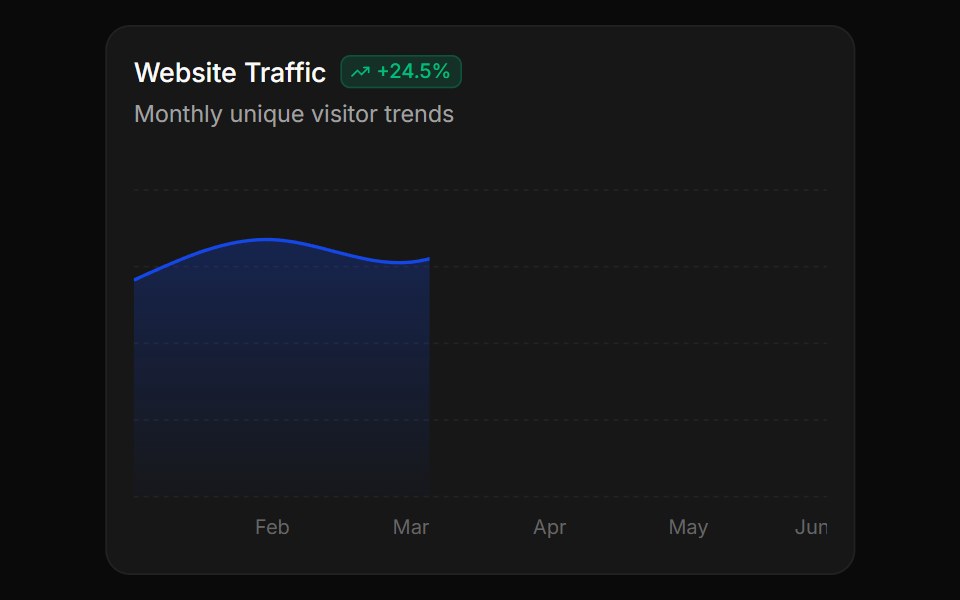 Gradient area chart with stripe overlayReUI · ReactGradient area chart with stripe overlay
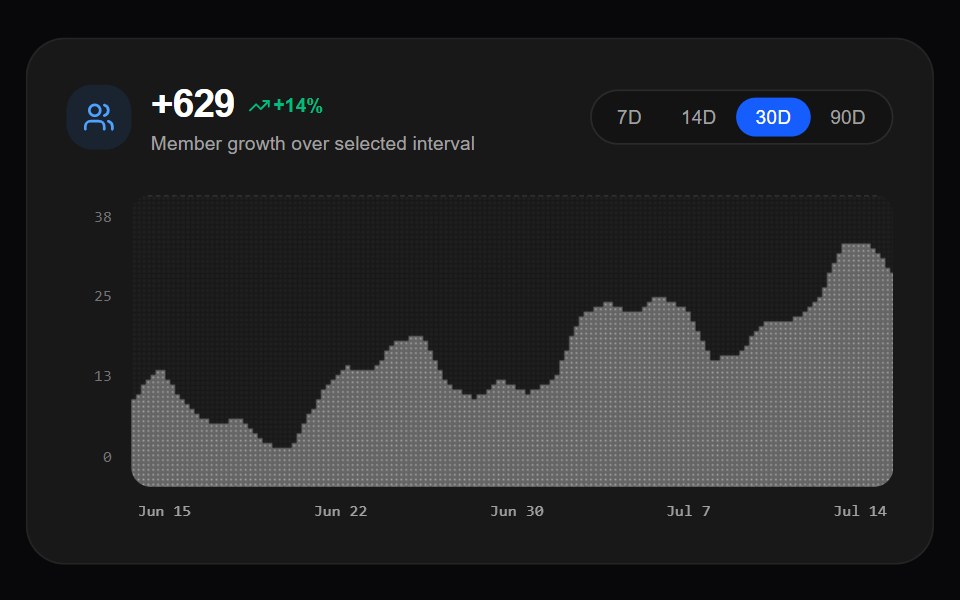 Dither Growth ChartAmicro Micro Transitions · React60fps canvas growth line chart with pixel dither fill matrix.
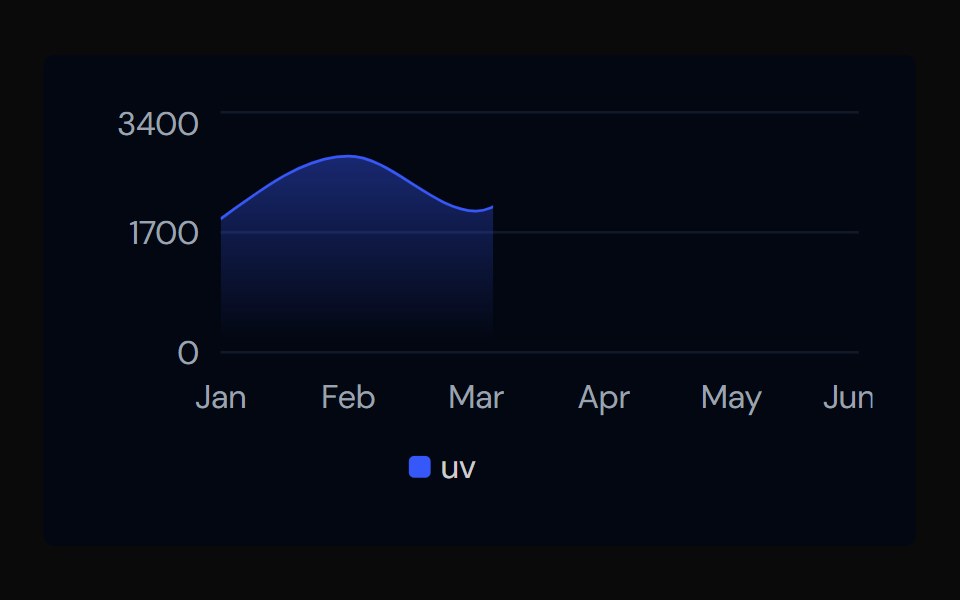 ChartTailGrids · ReactA chart component with multiple variants.
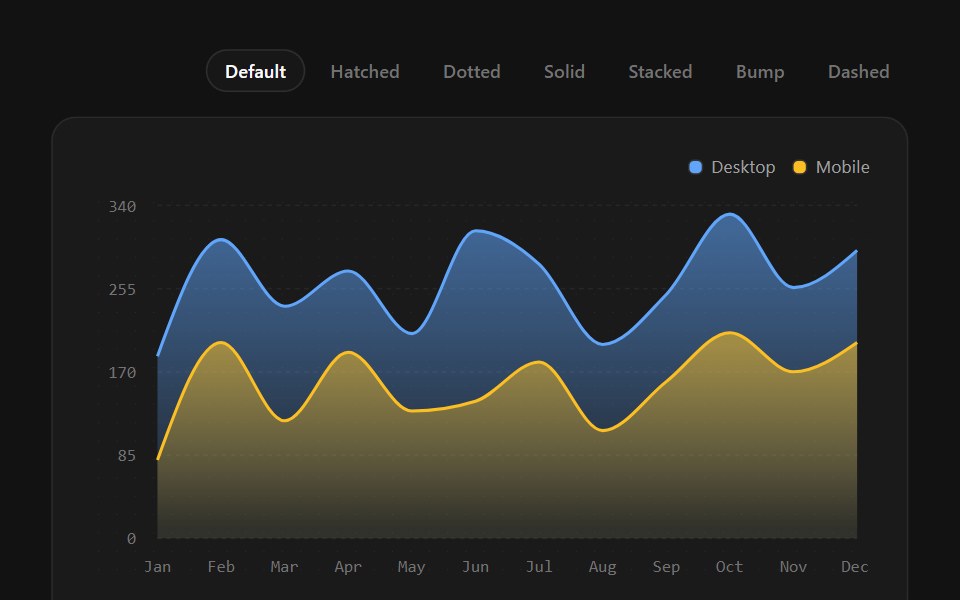 Area ChartSpectrum UI · ReactFilled areas with gradient, hatch, dotted, stacked, and dashed-stroke variants.
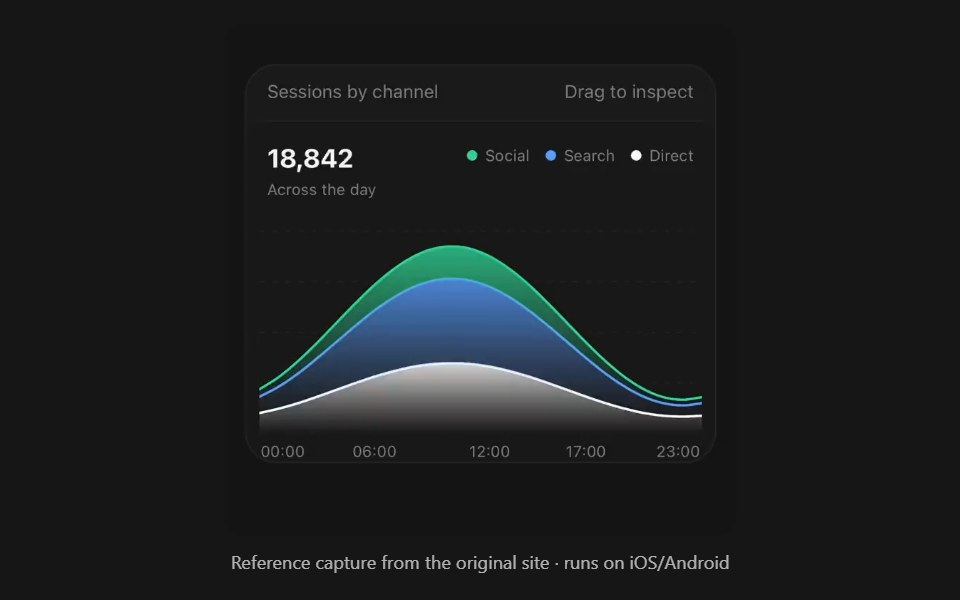 Area ChartPanel UI · React NativeFilled bands over time, stacked or overlaid.
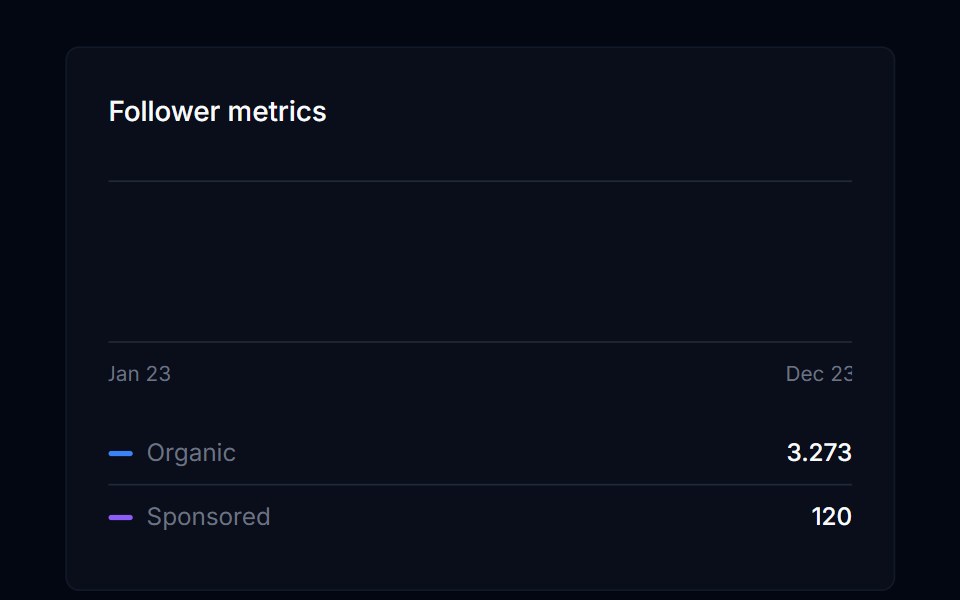 Area ChartTremor Blocks · ReactThe base area chart component (Recharts): any number of series, legend, tooltip, axes, stacked or percent mode…
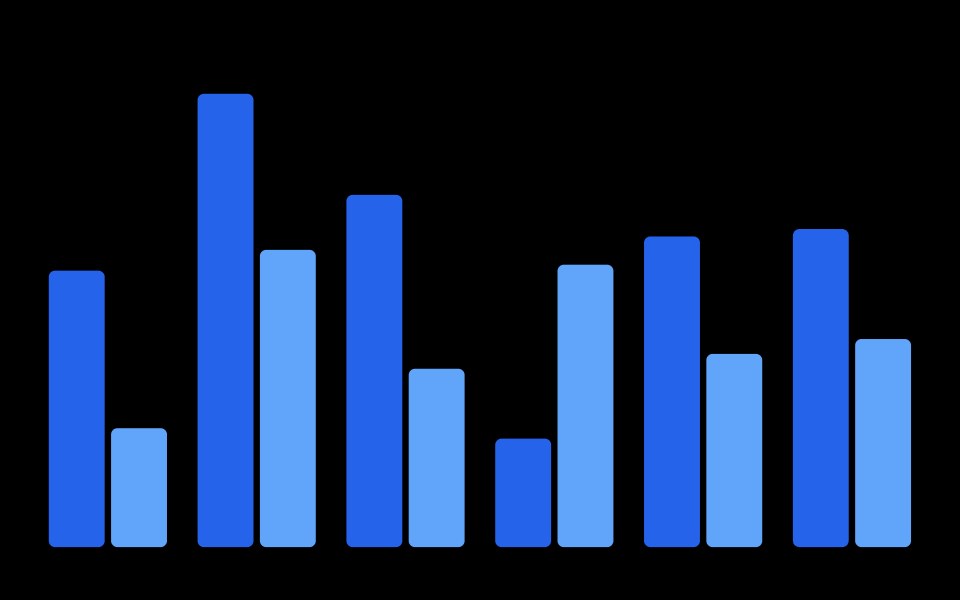 ChartObsidianUI · React
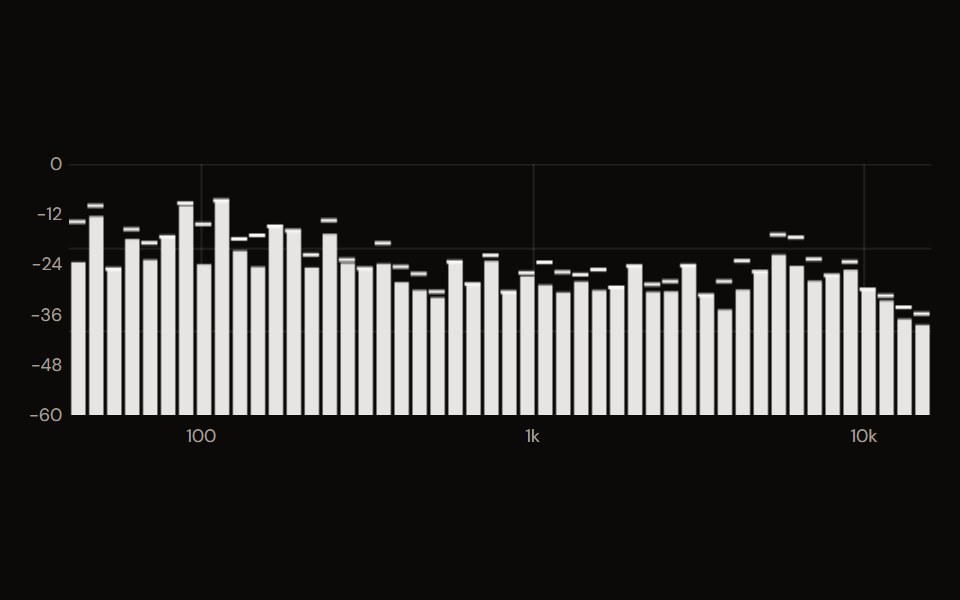 Spectrumaudiocn · ReactA frequency spectrum analyser drawn on canvas as bars, a line or an area, with peak hold, a grid and frequency and…
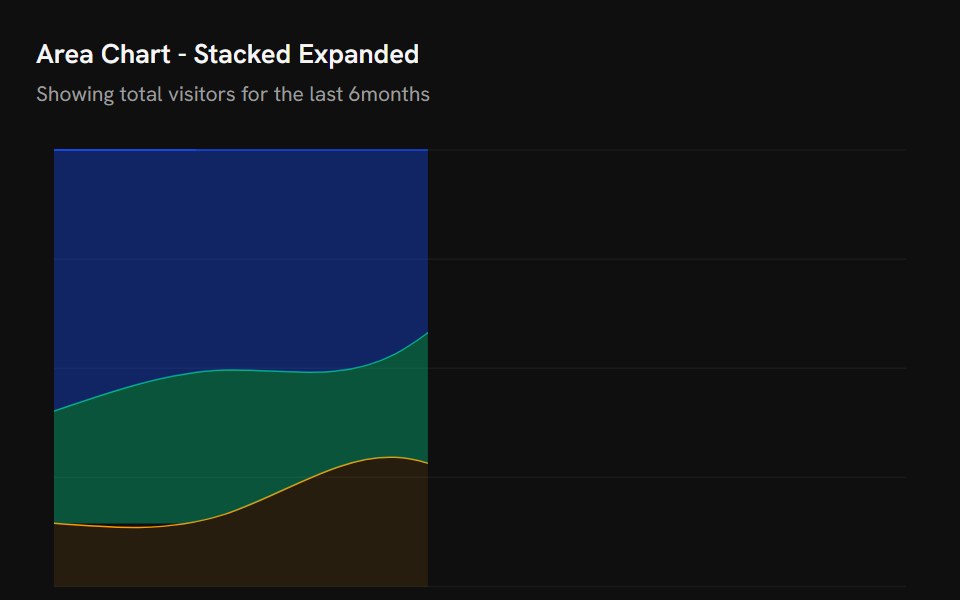 Chart Area Stacked ExpandShark UI · ReactStacked area chart example normalised to 100%, showing each series as a share of the total.
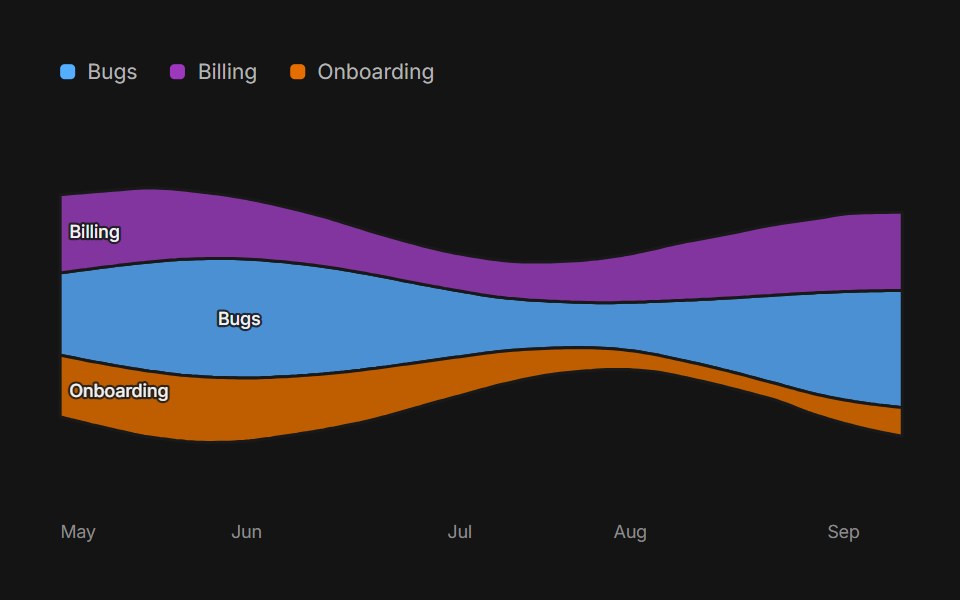 StreamgraphArc Library · ReactLayered streams on a wiggle baseline that morph between ranges, with a layer you can isolate and read week by week.
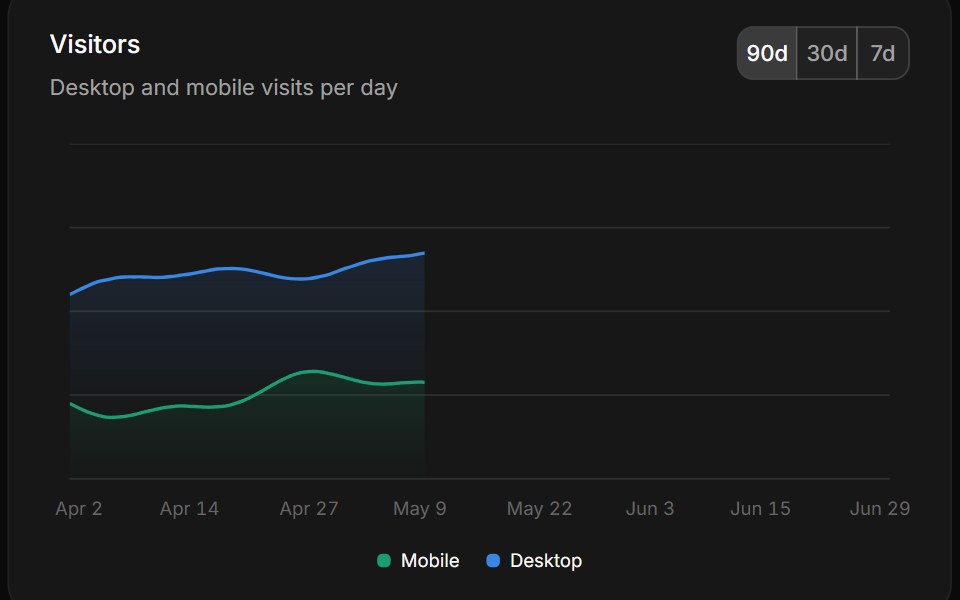 ChartHextaUI · ReactRecharts charts with themed colors, a tooltip and legend that read labels from one config, and keyboard navigation…
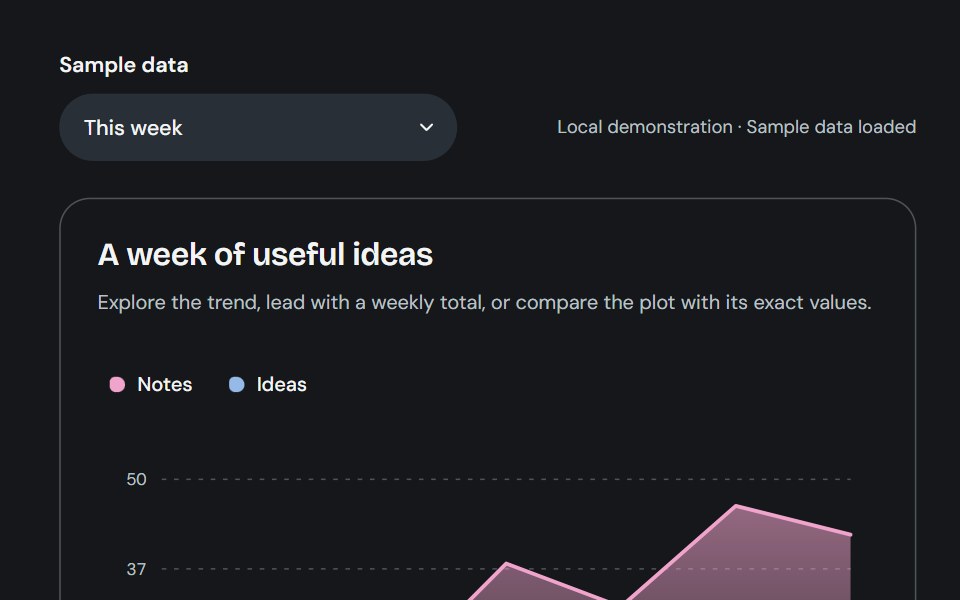 Area chartCojeev UI · ReactLayered area charts with shared series colors, responsive bounds and a keyboard data inspector.
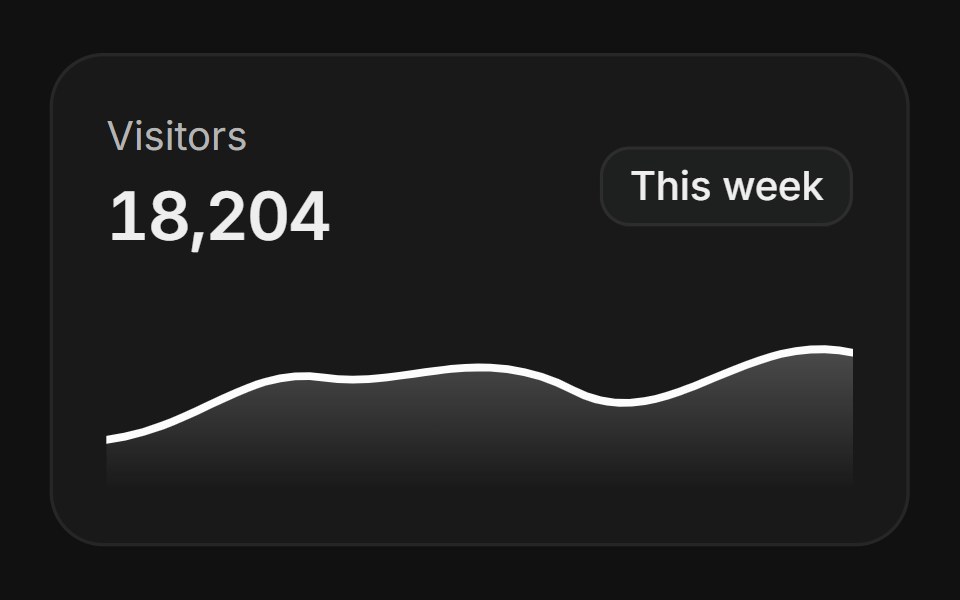 AnalyticsFLX UI · ReactA card with a gradient area chart.
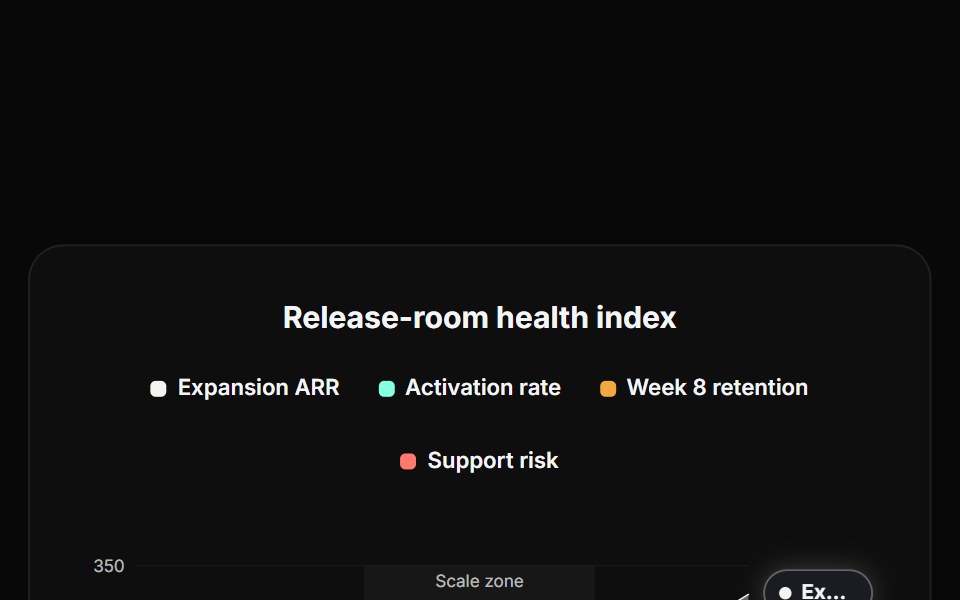 Line ChartReactFrame · ReactA multi-series line/area chart, smooth Catmull-Rom curves, a highlighted zone band, a reference line, endpoint value…
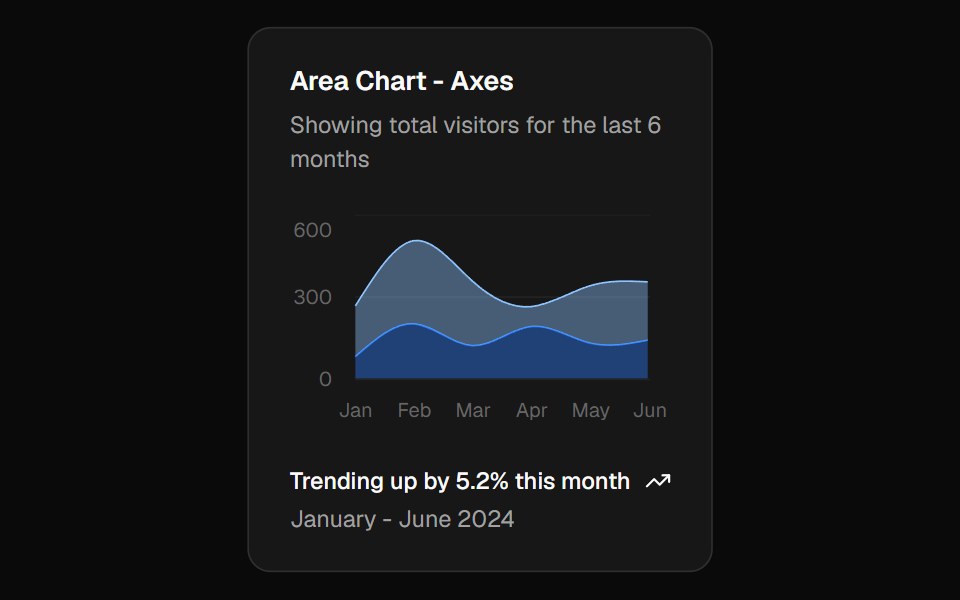 Chart Area Axesshadcn/ui · React
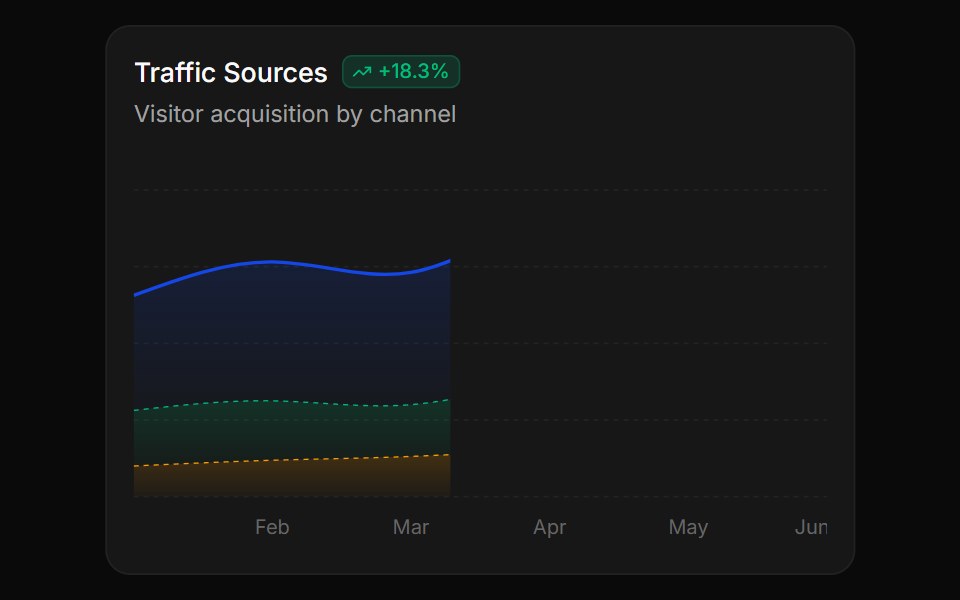 Stacked area chart with dashed strokesReUI · ReactStacked area chart with dashed strokes
 Mono Rounded Area ChartAmicro Micro Transitions · React
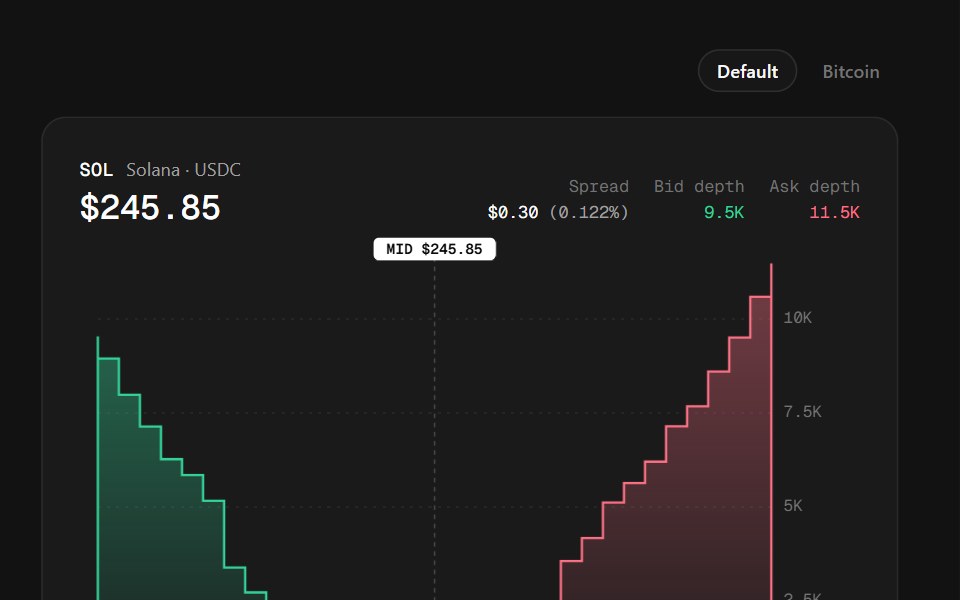 Depth ChartSpectrum UI · ReactCumulative bid and ask liquidity either side of the mid, with a crosshair that reports the size resting up to any price.
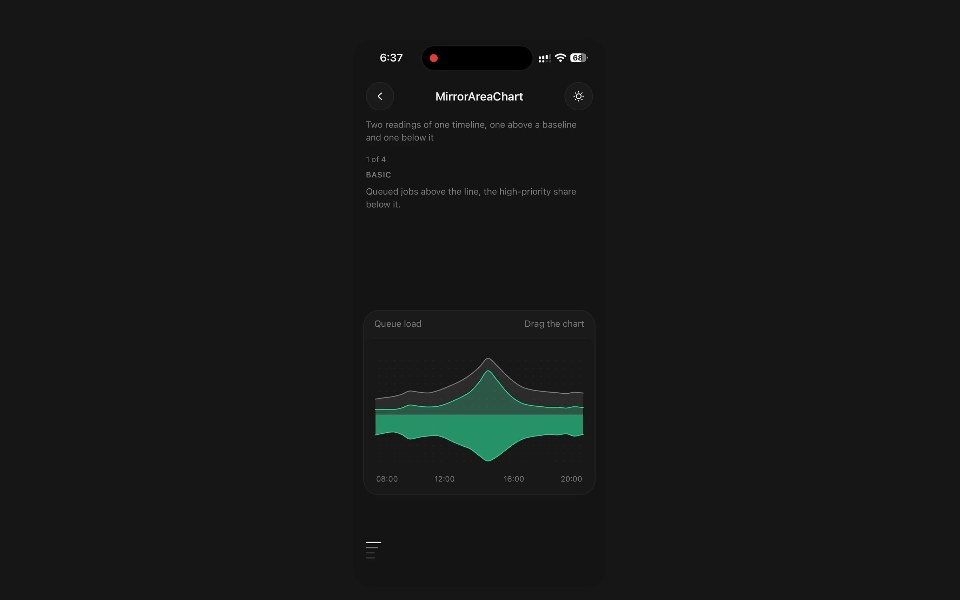 Mirror Area ChartPanel UI · React NativeTwo readings of one timeline, one above a baseline and one below it.
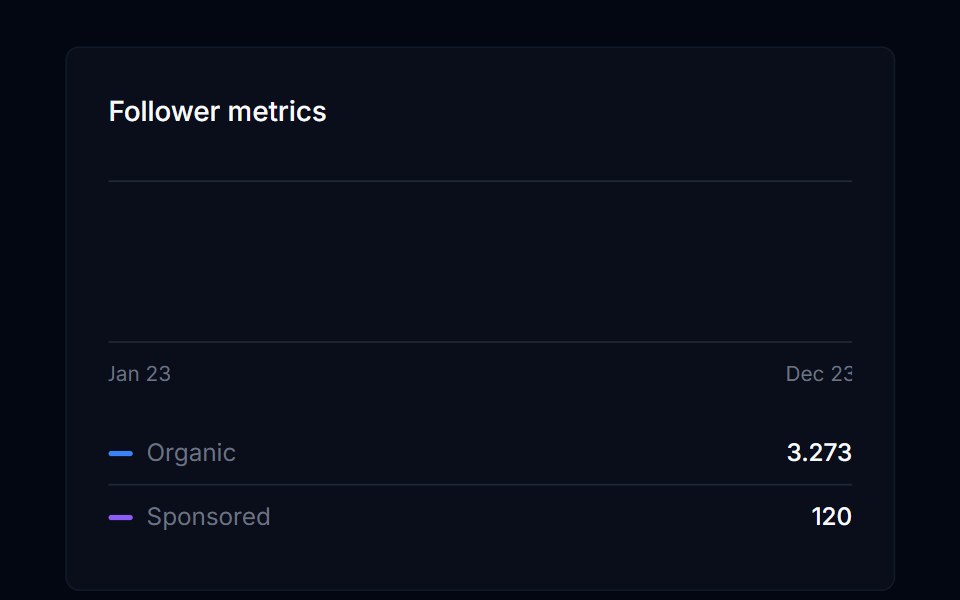 Area Chart 01Tremor Blocks · ReactCard with a compact area chart of two filled series over time (no legend, no Y axis) and, below it, a list with the…
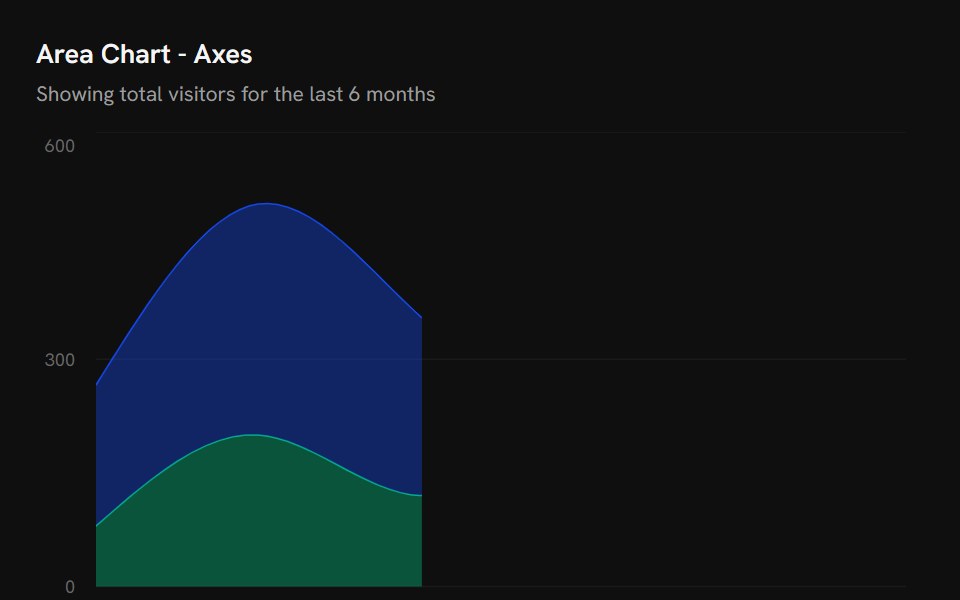 Chart Area AxesShark UI · React
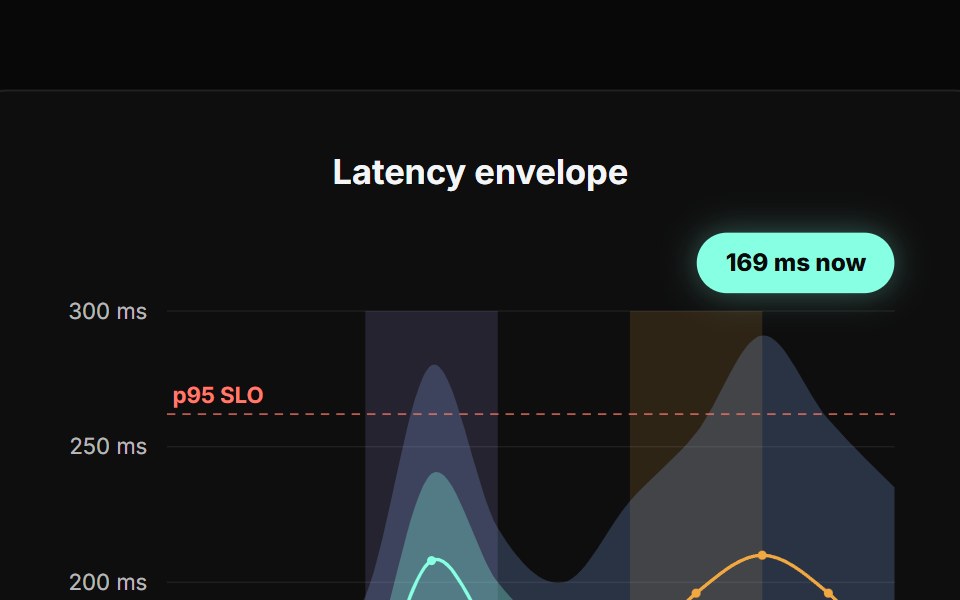 Range Area ChartReactFrame · ReactA min/max envelope chart with a nested core-range band, an actual-to-forecast line split, annotated risk zones, a…
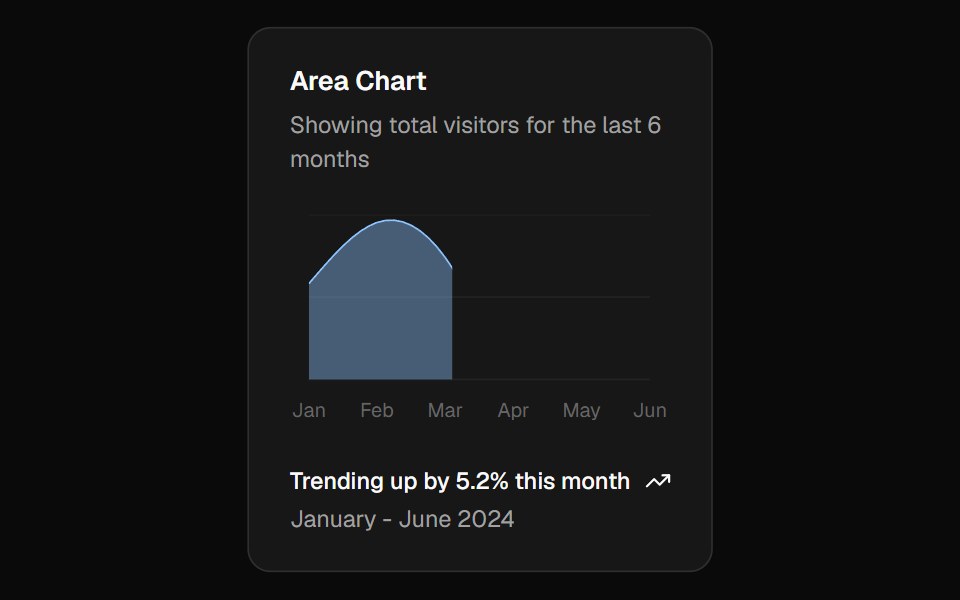 Chart Area Defaultshadcn/ui · React
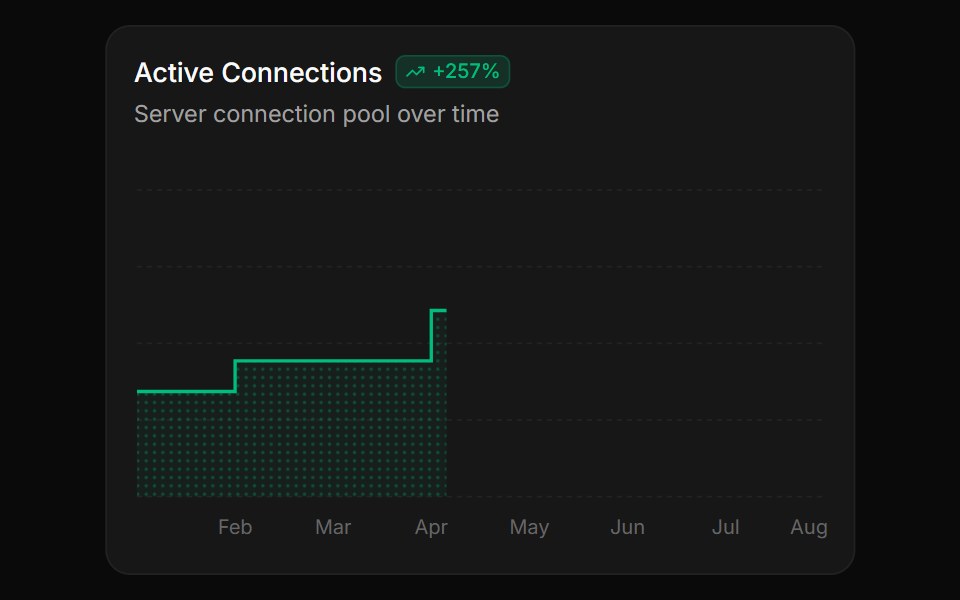 Step area chart with dotted pattern fillReUI · ReactStep area chart with dotted pattern fill
 Mono Rounded Range ChartAmicro Micro Transitions · React
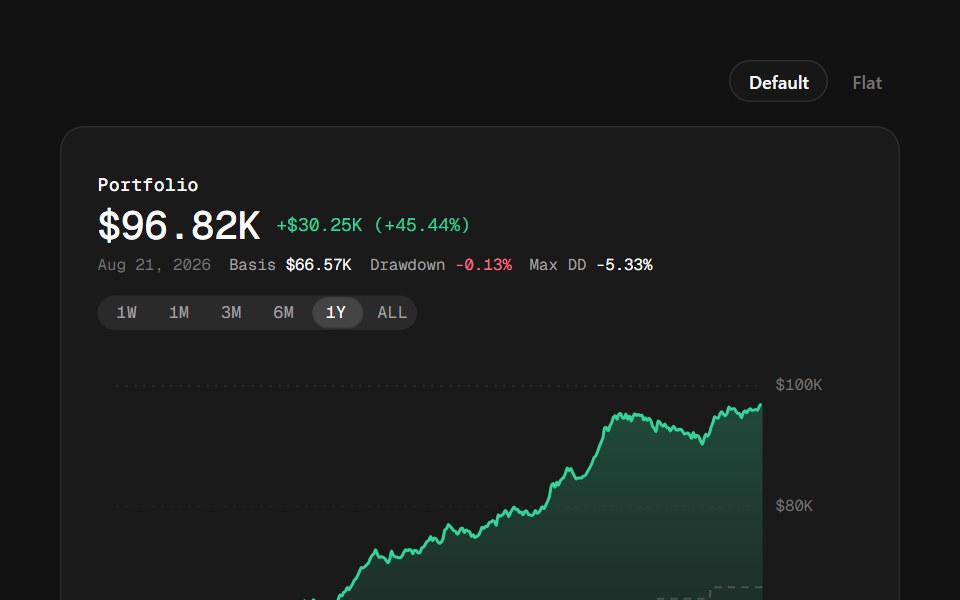 Portfolio ChartSpectrum UI · ReactAccount value against cost basis with drawdown from the running peak shaded underneath.
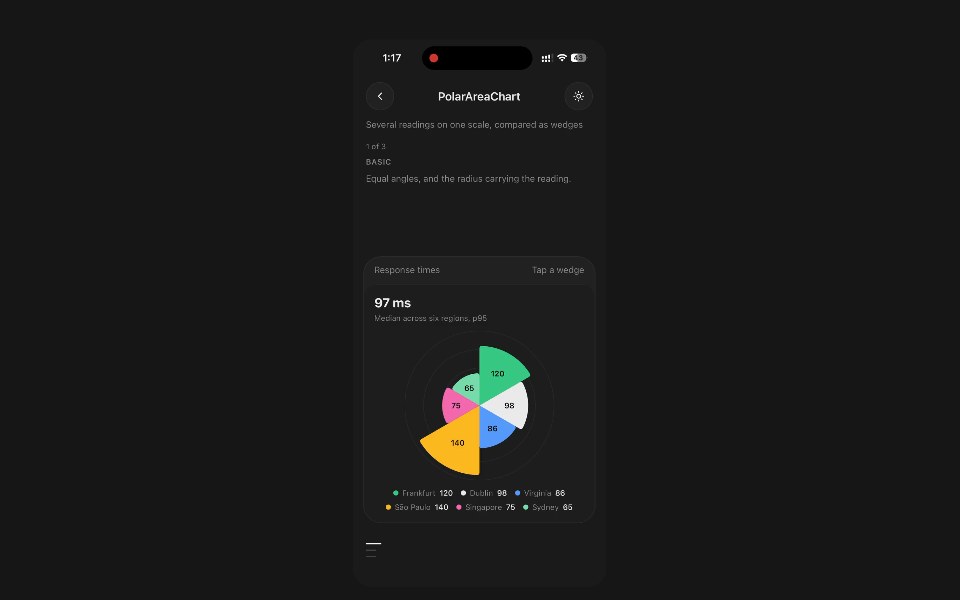 Polar Area ChartPanel UI · React NativeSeveral readings on one scale, compared as wedges.
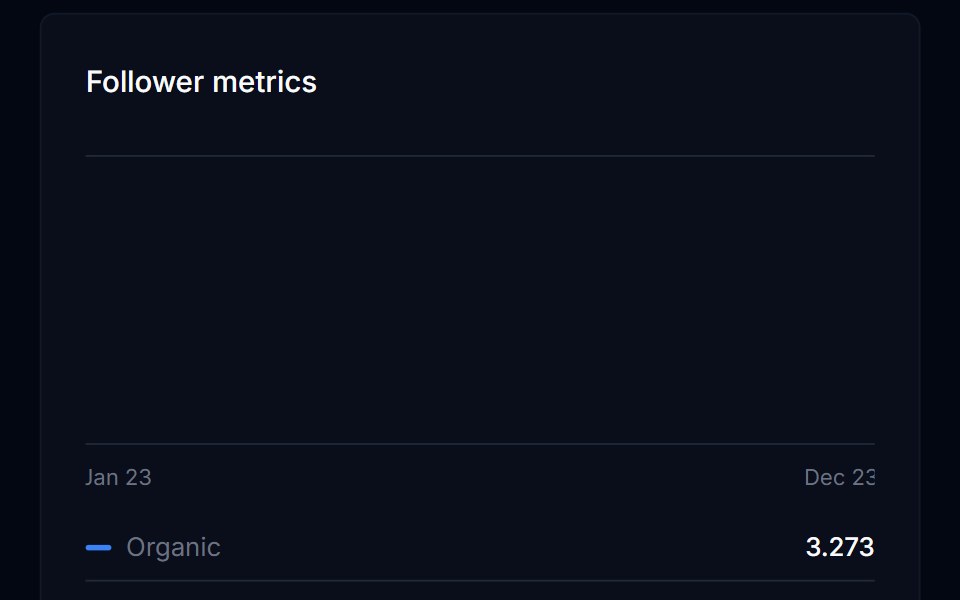 Area Chart 02Tremor Blocks · React
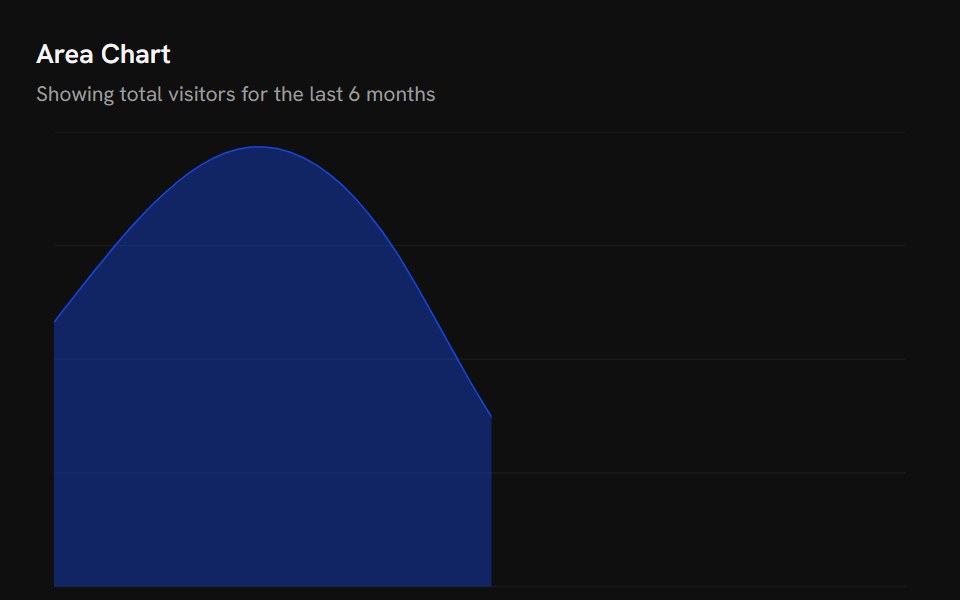 Chart Area DefaultShark UI · React
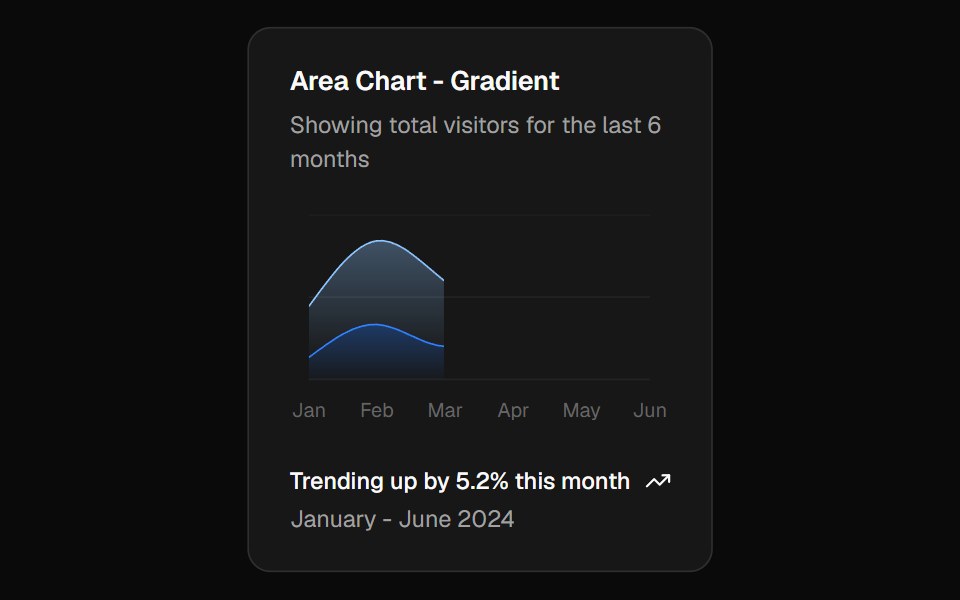 Chart Area Gradientshadcn/ui · React
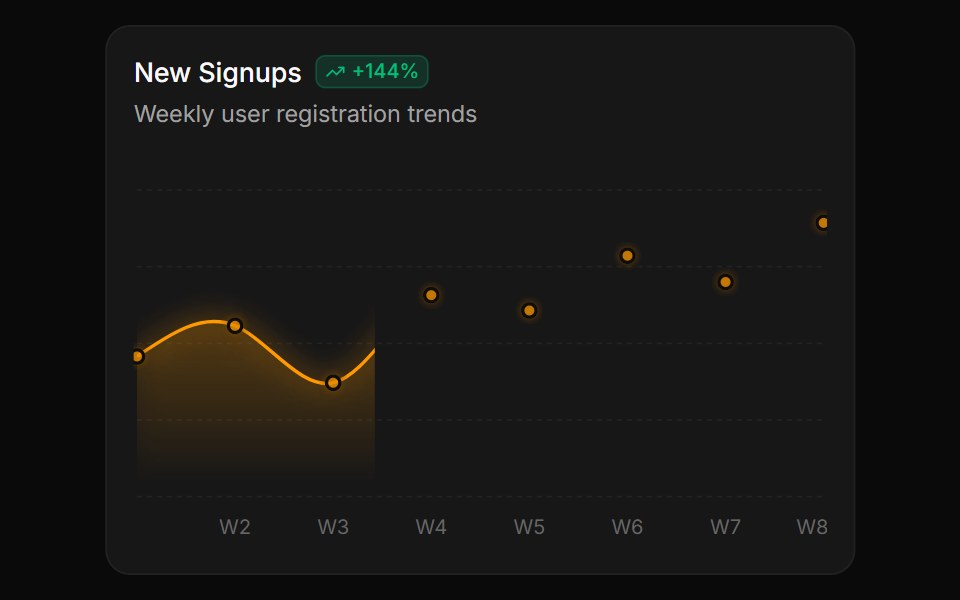 Area chart with glowing dot markersReUI · ReactArea chart with glowing dot markers
 Mono Rounded Stream ChartAmicro Micro Transitions · React
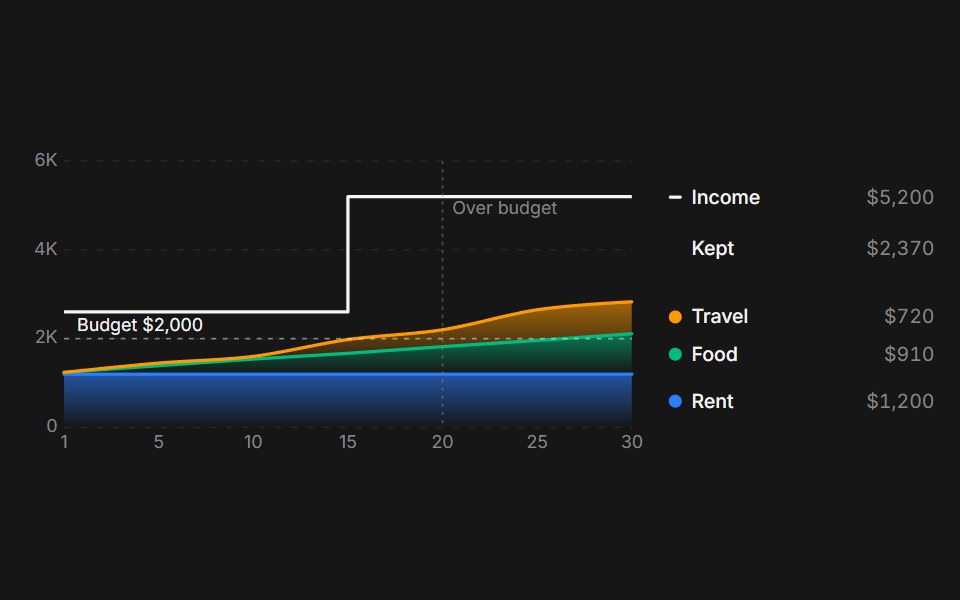 Web Area ChartPanel UI · React NativeArea charts with replay, hover readout and variants such as budget lines and stacked series.
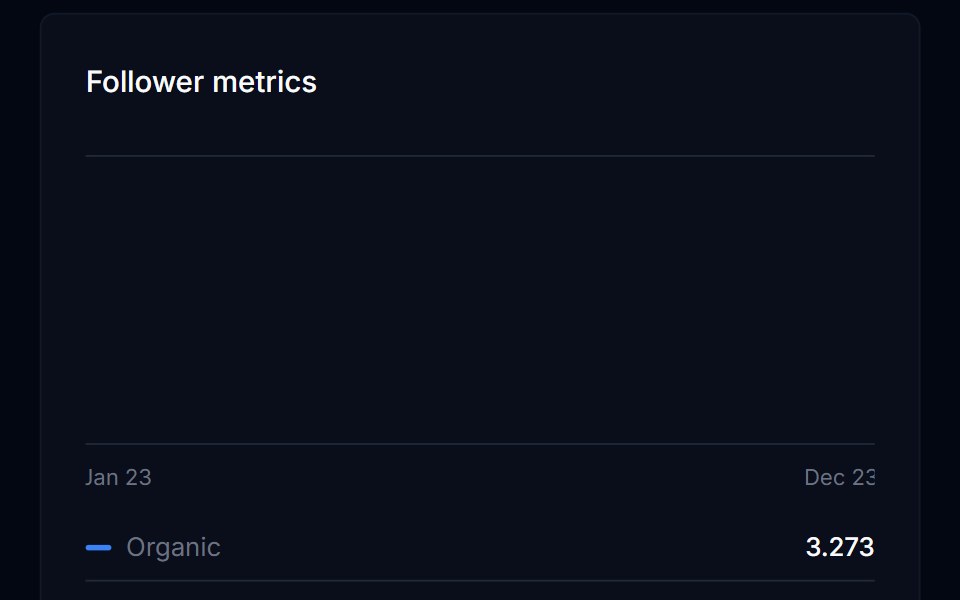 Area Chart 03Tremor Blocks · React
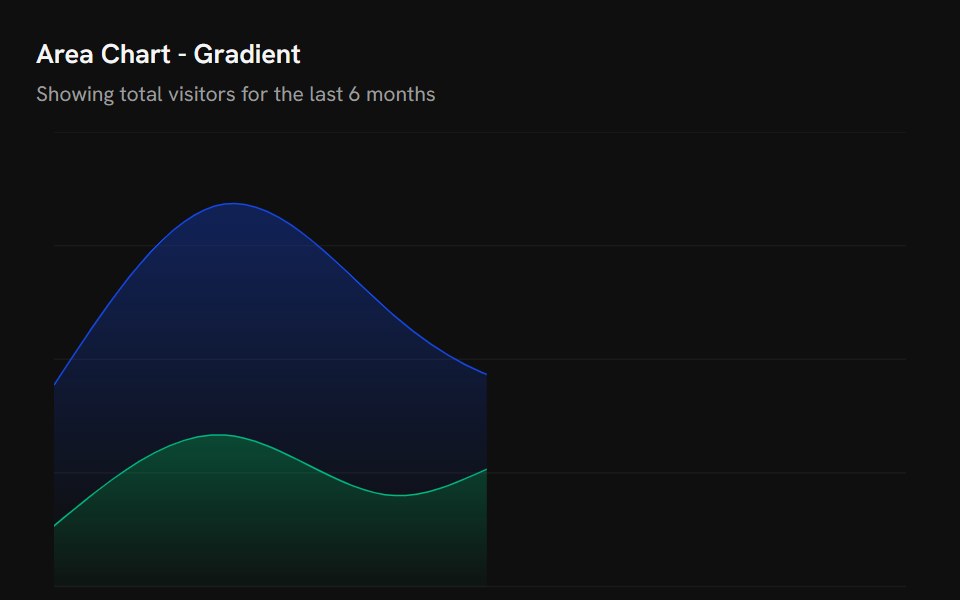 Chart Area GradientShark UI · React
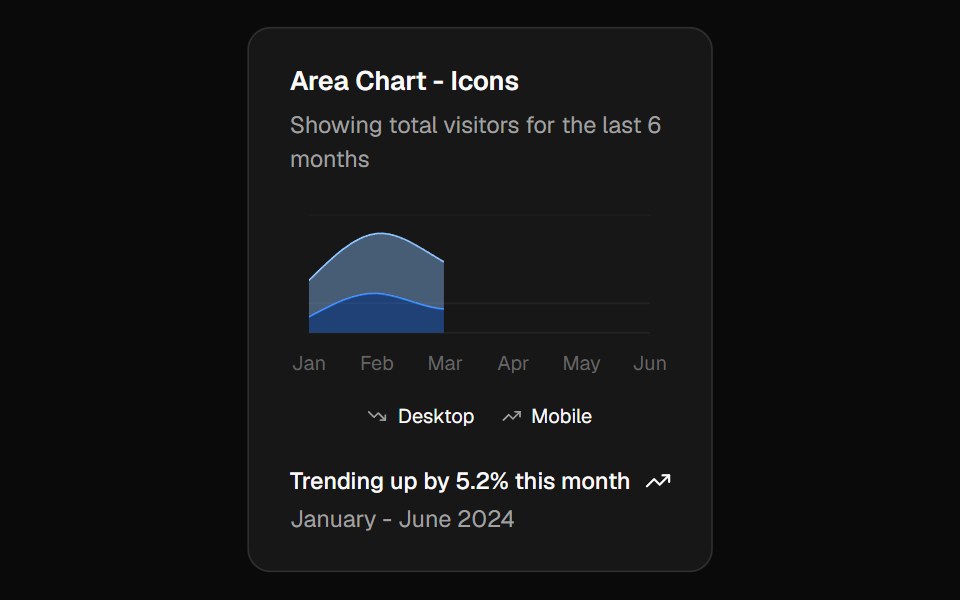 Chart Area Iconsshadcn/ui · React
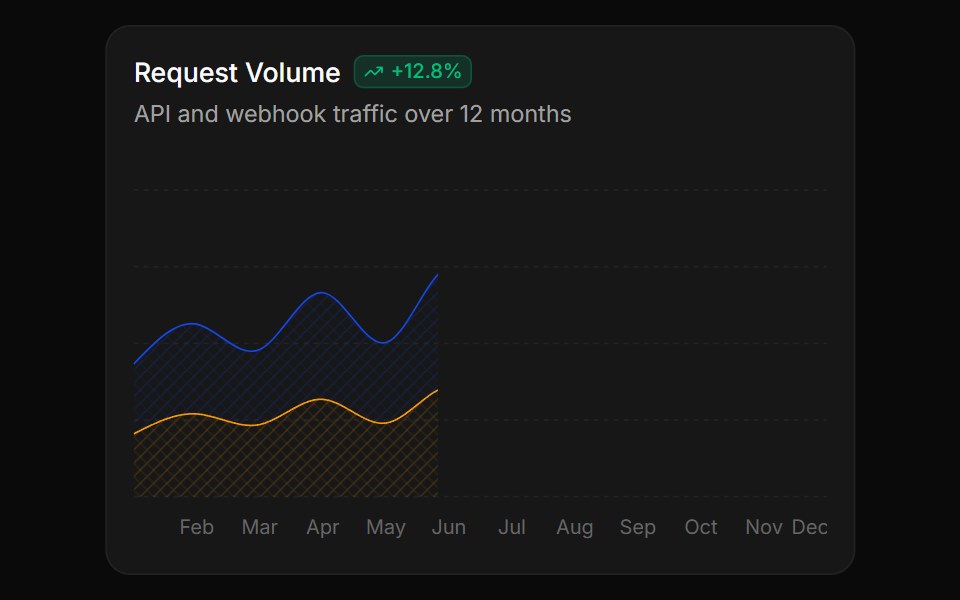 Stacked area chart with crosshatch pattern fillReUI · ReactStacked area chart with crosshatch pattern fill
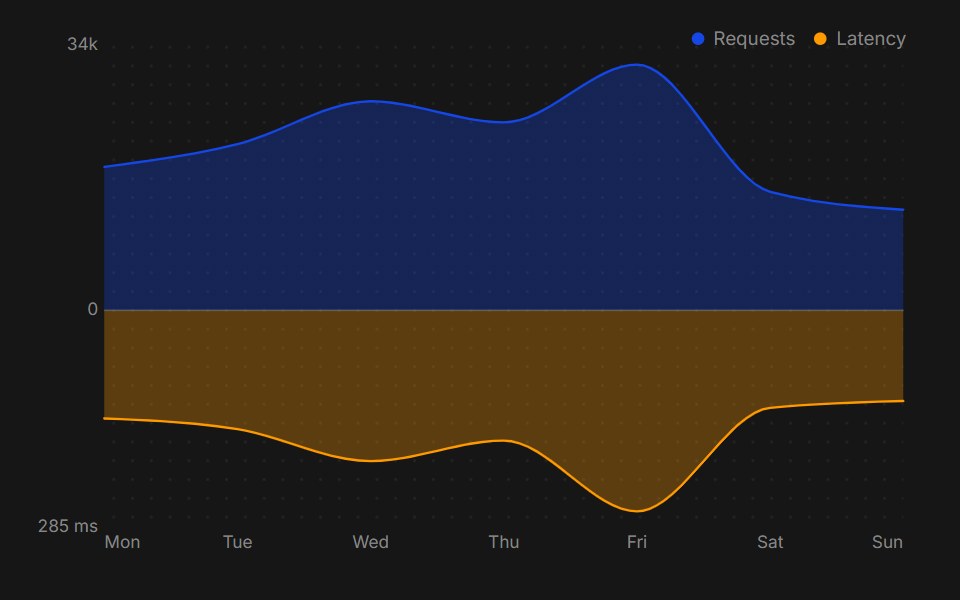 Web Mirror Area ChartPanel UI · React NativeA mirrored area chart comparing two series above and below one axis.
 Area Chart 04Tremor Blocks · React
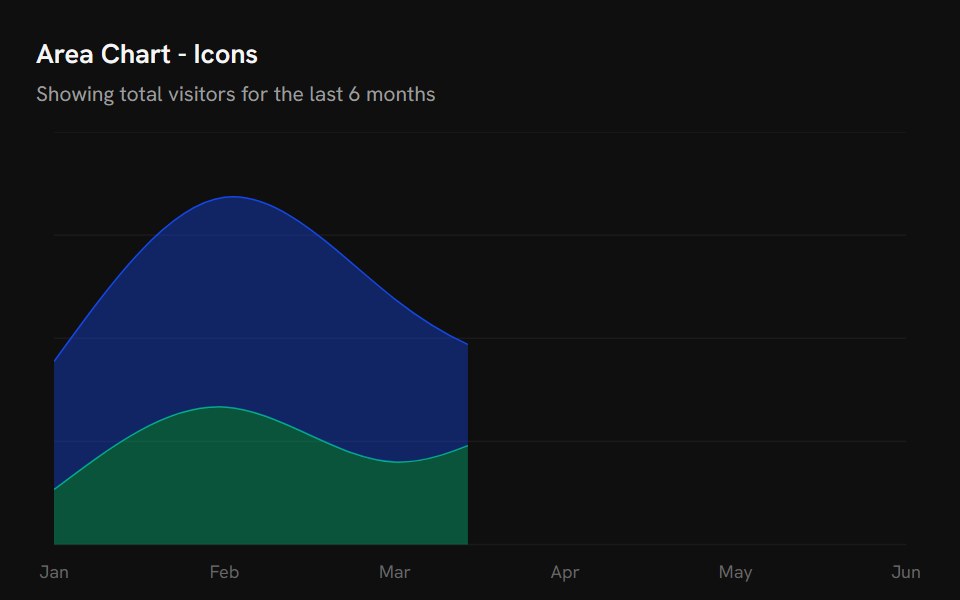 Chart Area IconsShark UI · React
 Chart Area Interactiveshadcn/ui · React
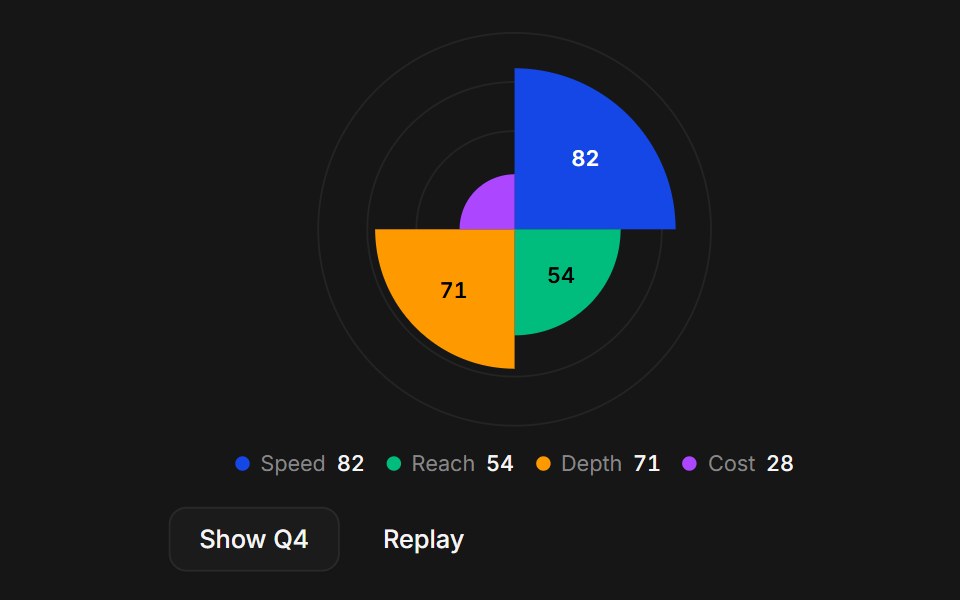 Web Polar Area ChartPanel UI · React NativeA polar area chart comparing scores across categories.
 Area Chart 05Tremor Blocks · React
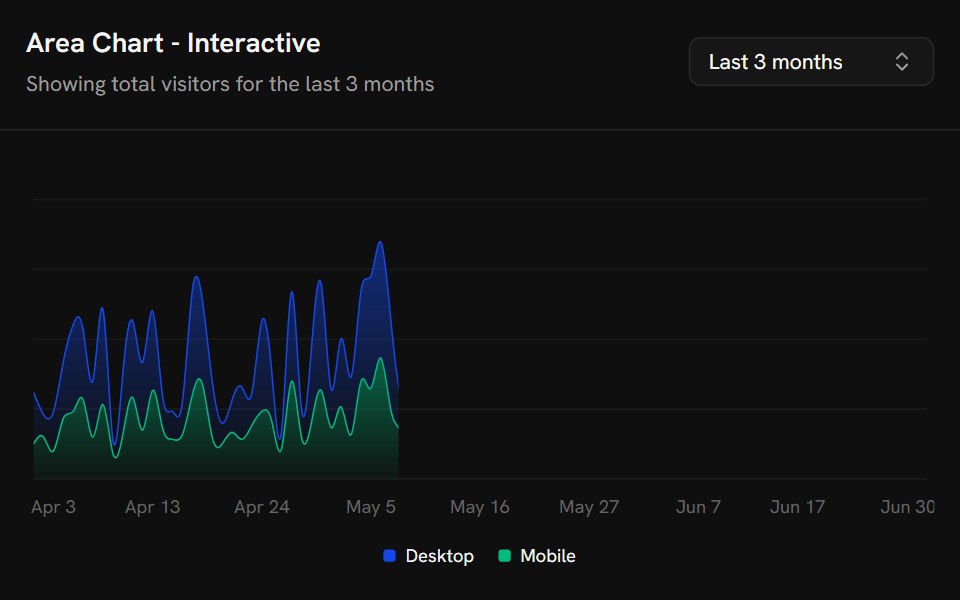 Chart Area InteractiveShark UI · React
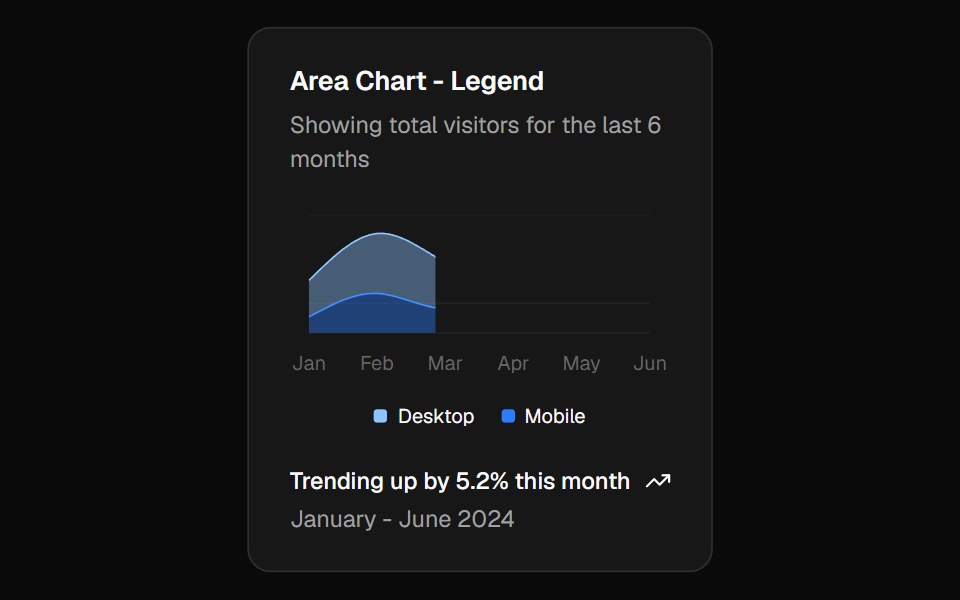 Chart Area Legendshadcn/ui · React
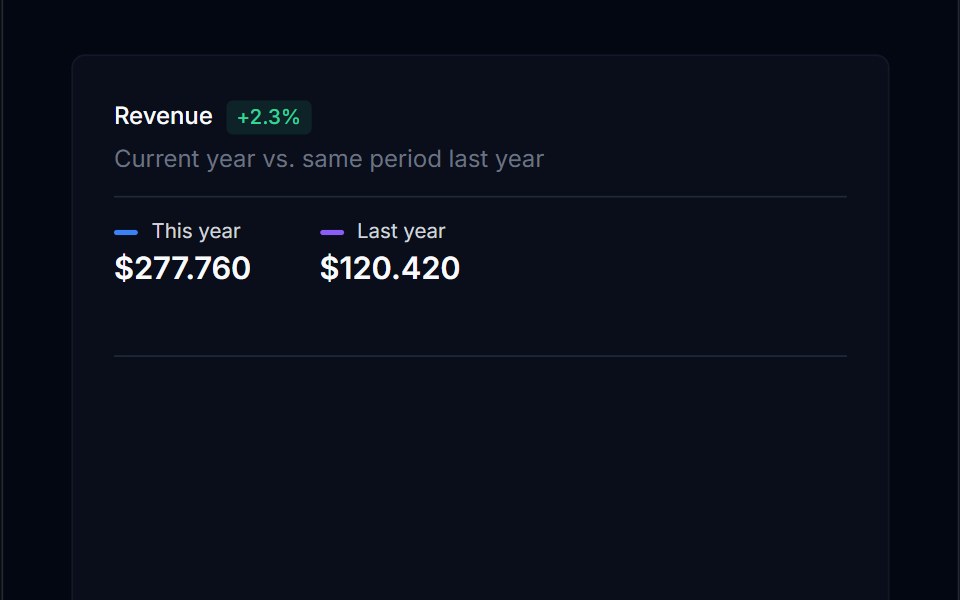 Area Chart 06Tremor Blocks · React
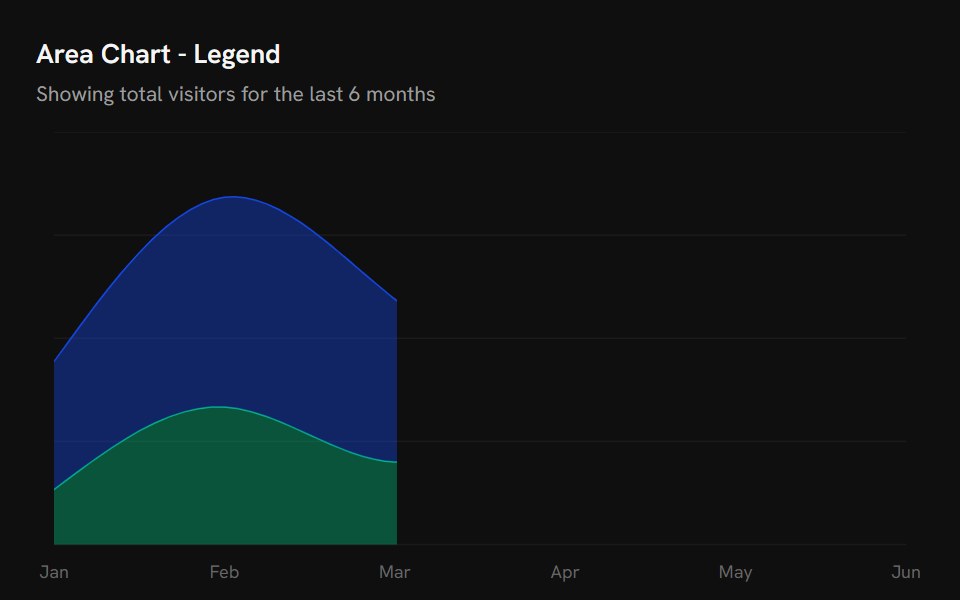 Chart Area LegendShark UI · React
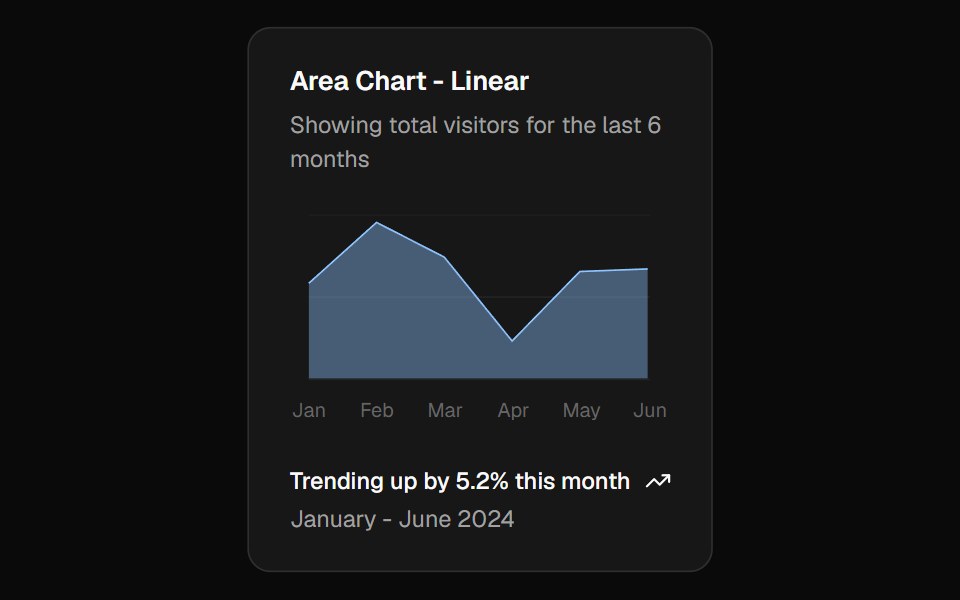 Chart Area Linearshadcn/ui · React
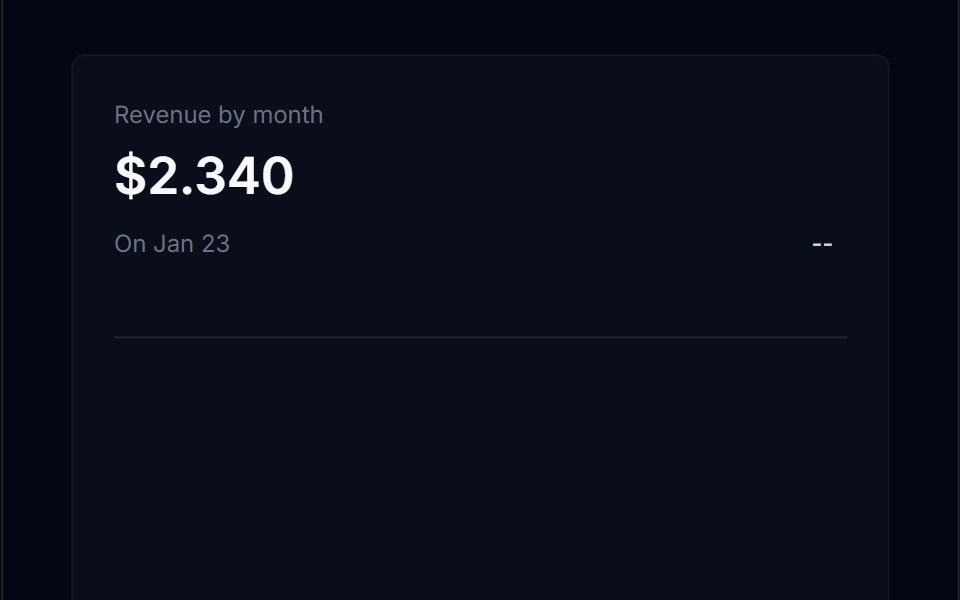 Area Chart 07Tremor Blocks · React
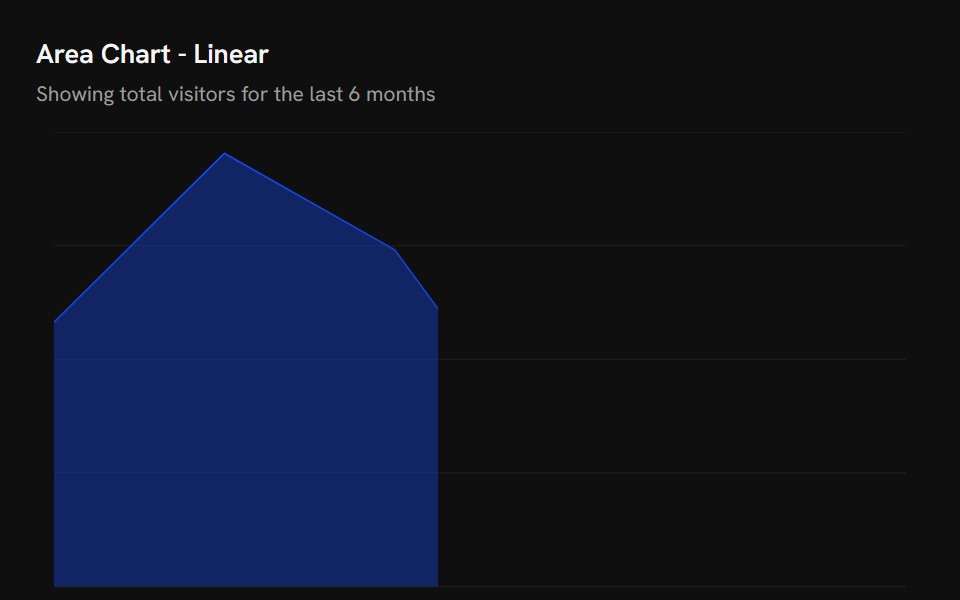 Chart Area LinearShark UI · React
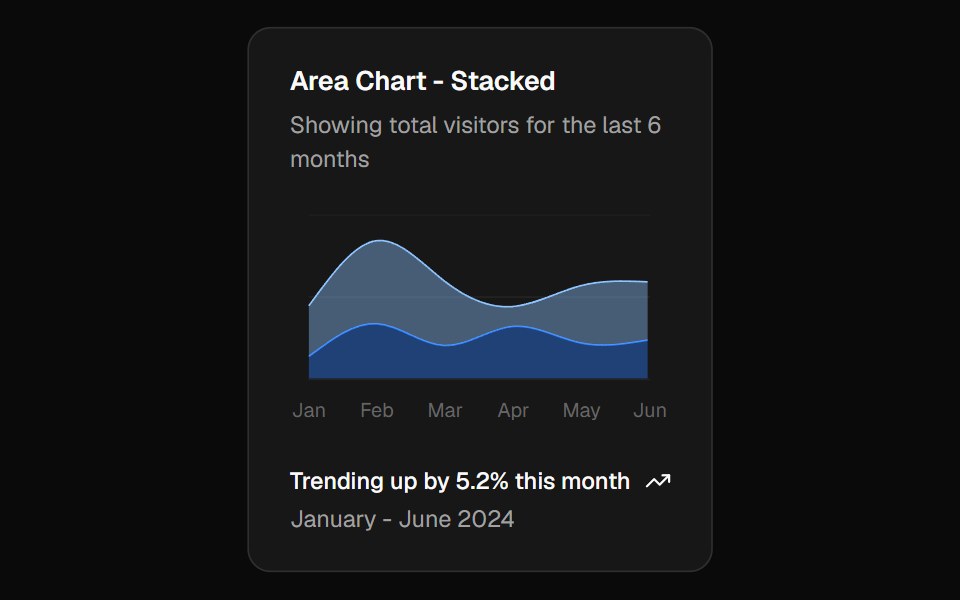 Chart Area Stackedshadcn/ui · React
 Area Chart 08Tremor Blocks · React
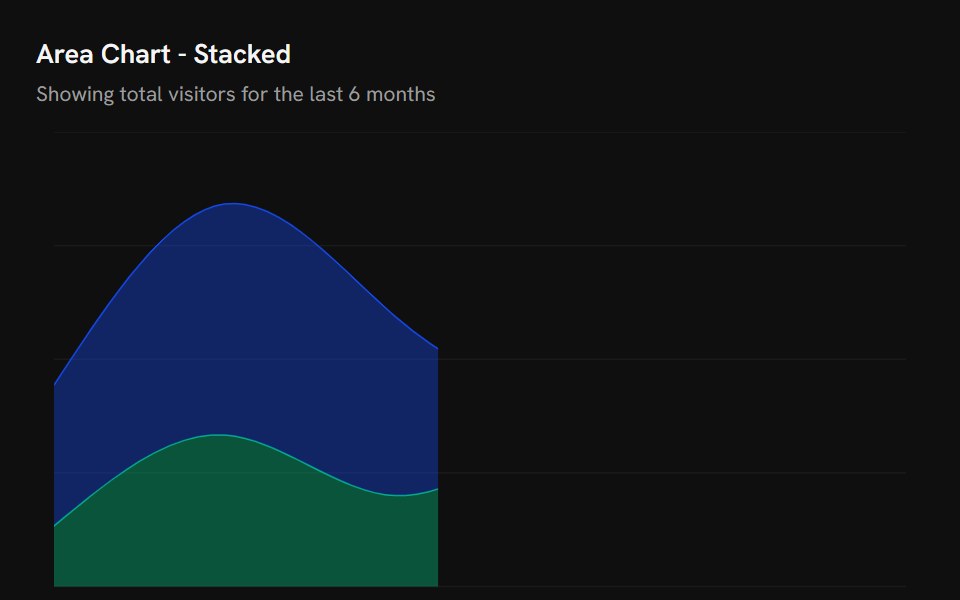 Chart Area StackedShark UI · React
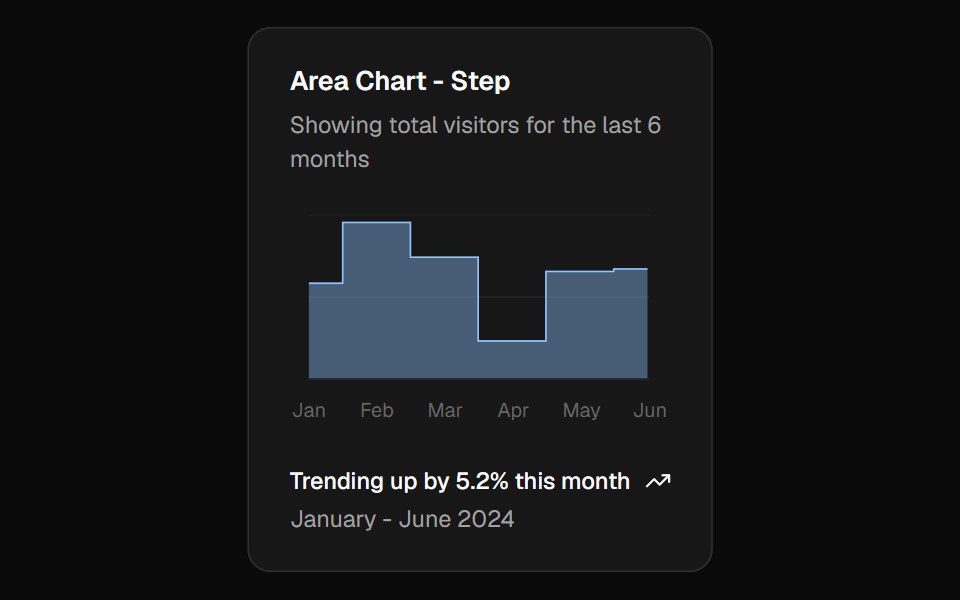 Chart Area Stepshadcn/ui · React
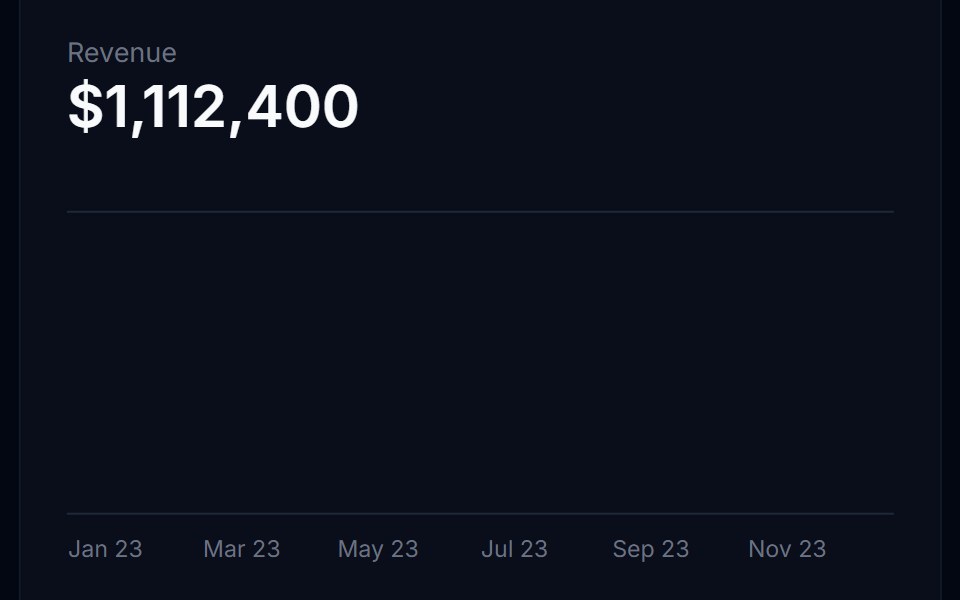 Area Chart 09Tremor Blocks · React
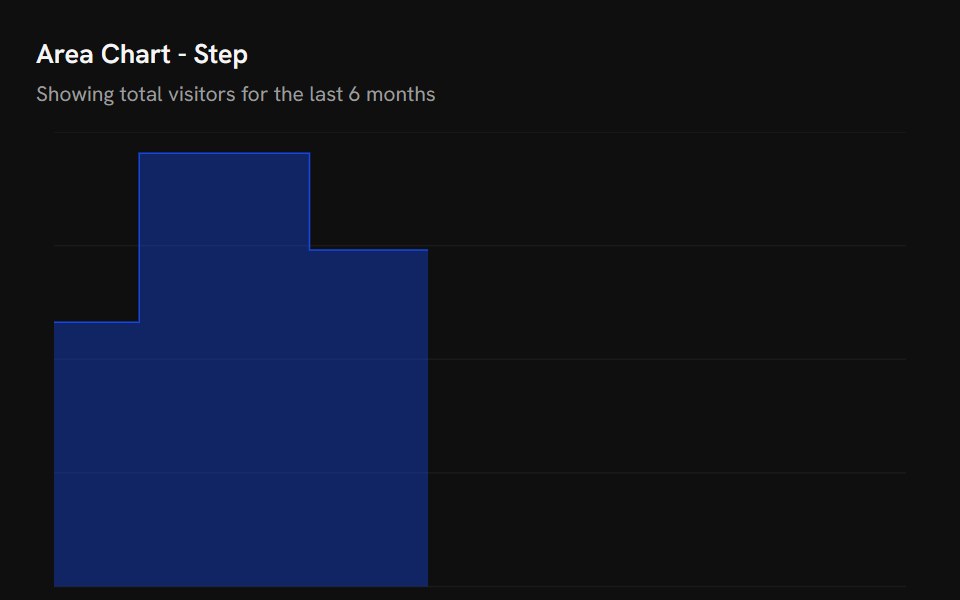 Chart Area StepShark UI · React
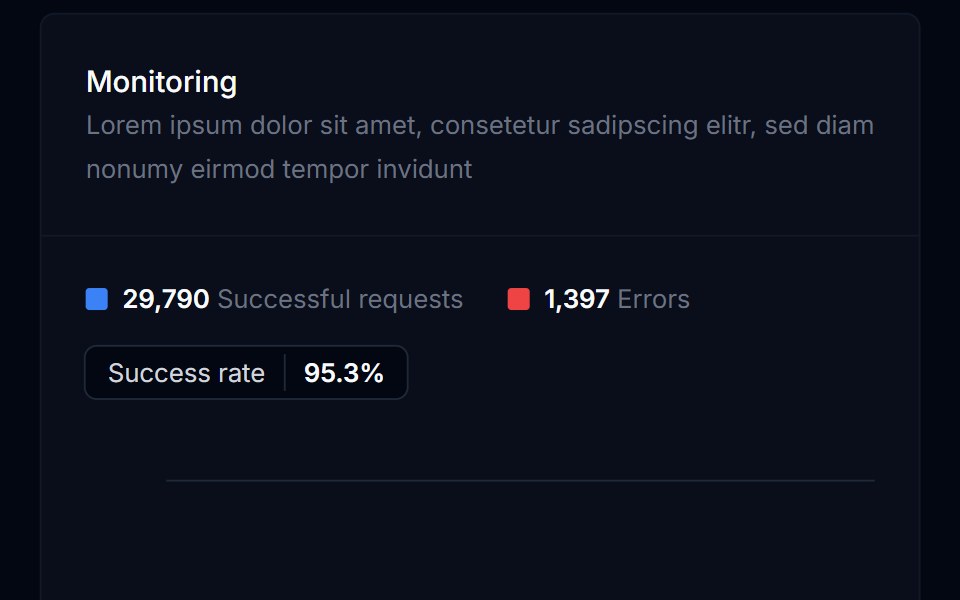 Area Chart 10Tremor Blocks · React
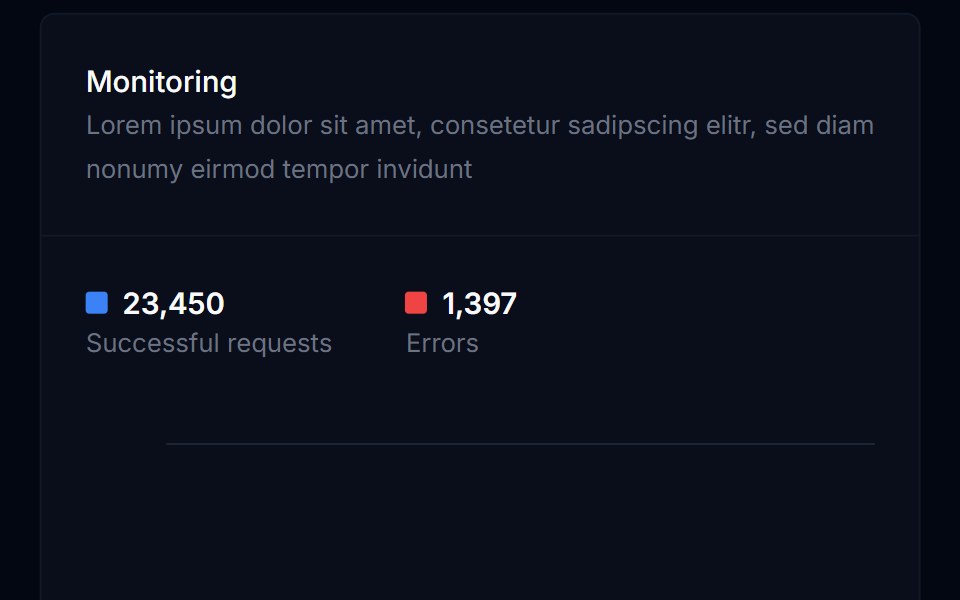 Area Chart 11Tremor Blocks · React
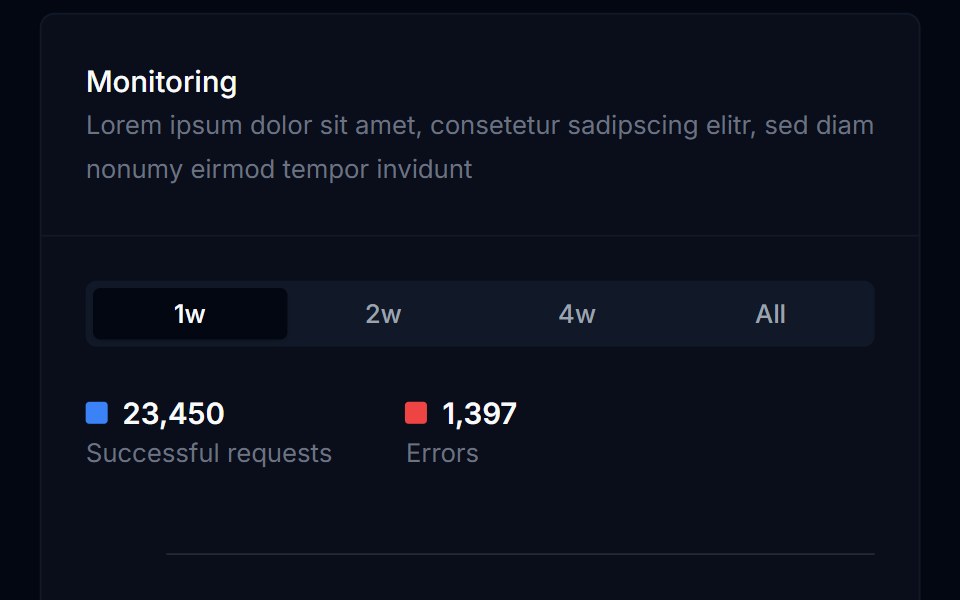 Area Chart 12Tremor Blocks · React
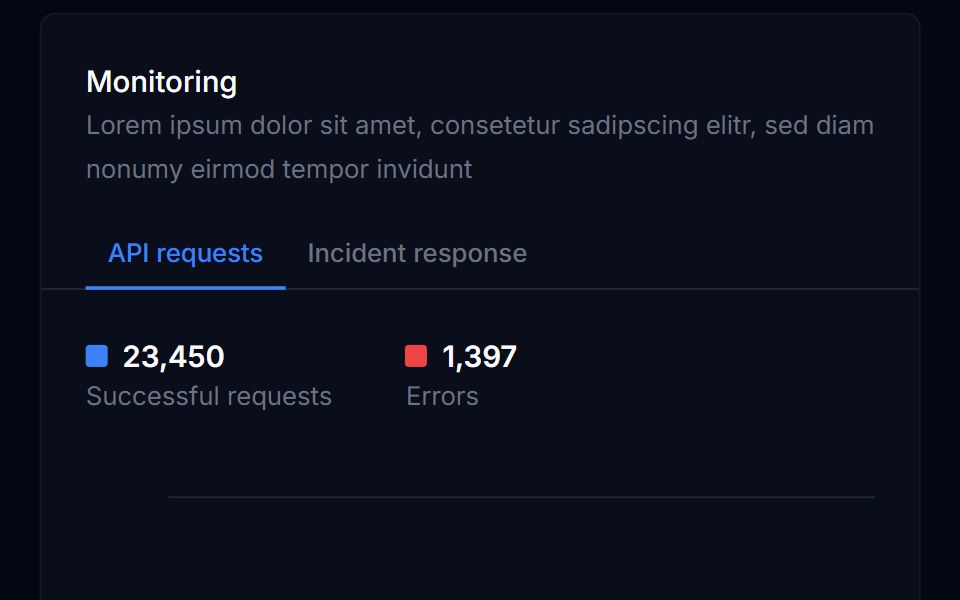 Area Chart 13Tremor Blocks · React
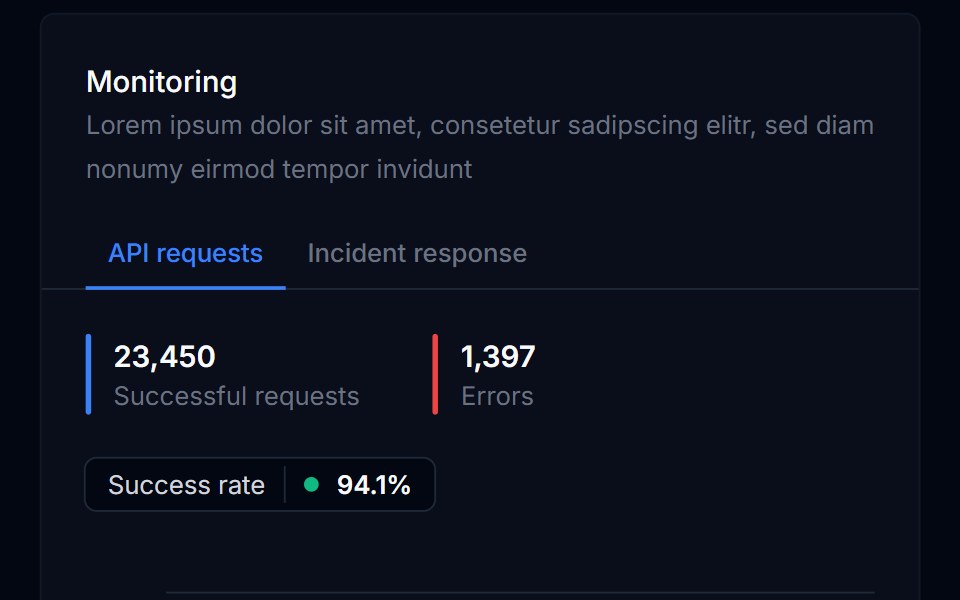 Area Chart 14Tremor Blocks · React
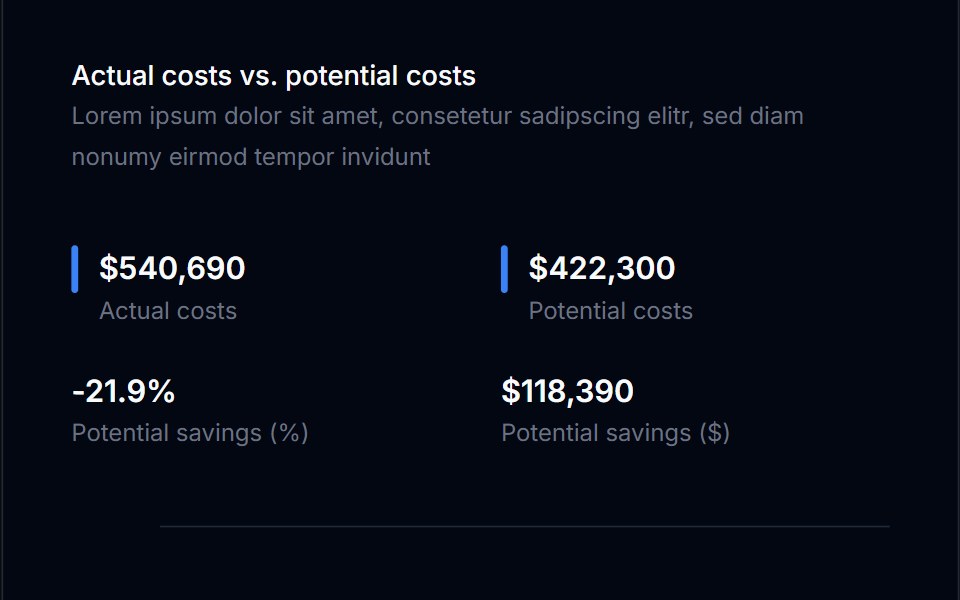 Area Chart 15Tremor Blocks · React
 Area Chart 16Tremor Blocks · React
Libraries with area chart components
Related categories
- Tailwind CSS Area Chart Components
- Animated Area Chart Components
- Data Display Components
- Card Components
- Chart Components
- Table Components
- Avatar Components
- List Components
- Stat Components
- Calendar Components
- Accordion Components
- Data Table Components
- Carousel Components
- Collapsible Components
- Avatar Group Components
- Stat Card Components
- Bar Chart Components
- Tree View Components