 Dev Design Library
Chart Components
Dev Design Library indexes 600 chart components from 50 open-source UI libraries, with the most coming from Tremor Blocks, shadcn/ui, Shark UI, Panel UI and Amicro Micro Transitions. Each one links to its page with the source code, a live preview where available, the library license and the install command. Chart components belong to the Data display group.
Showing 120 of 600, a mix from every library. Open a library to see all of its components.
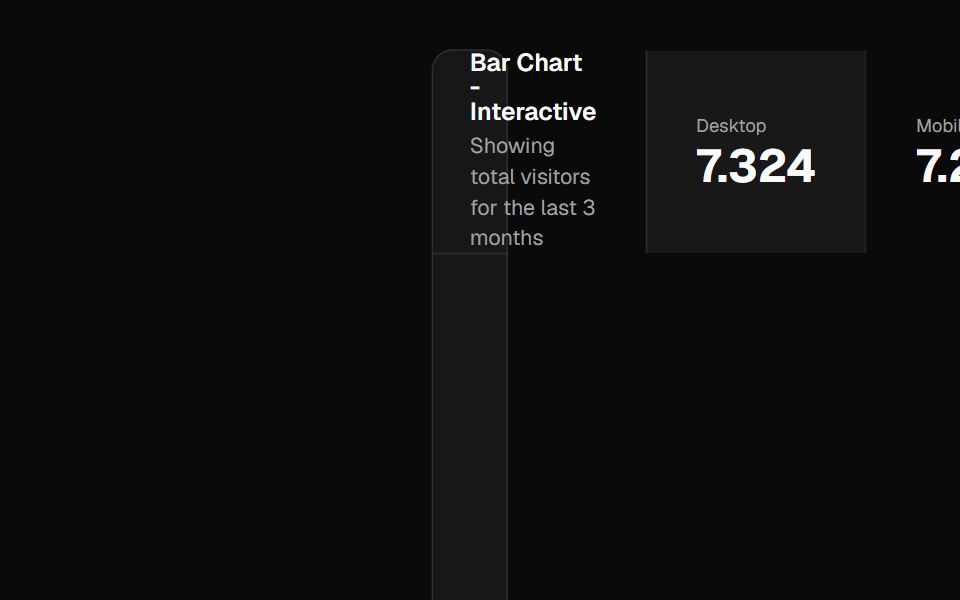 Chartshadcn/ui · ReactBeautiful charts. Built using Recharts. Copy and paste into your apps.
 RadarReact Bits · ReactRadar sweep effect with concentric rings, radial spokes, and a rotating beam.
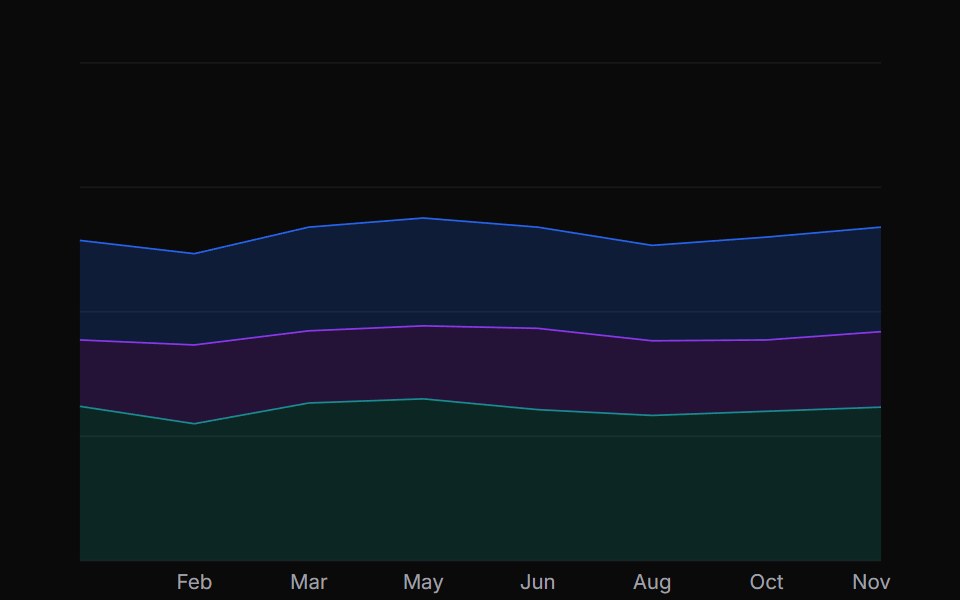 Area ChartChakra UI · ReactUsed to display quantitative data by filling the area between the line and axis, showing trends and patterns over time
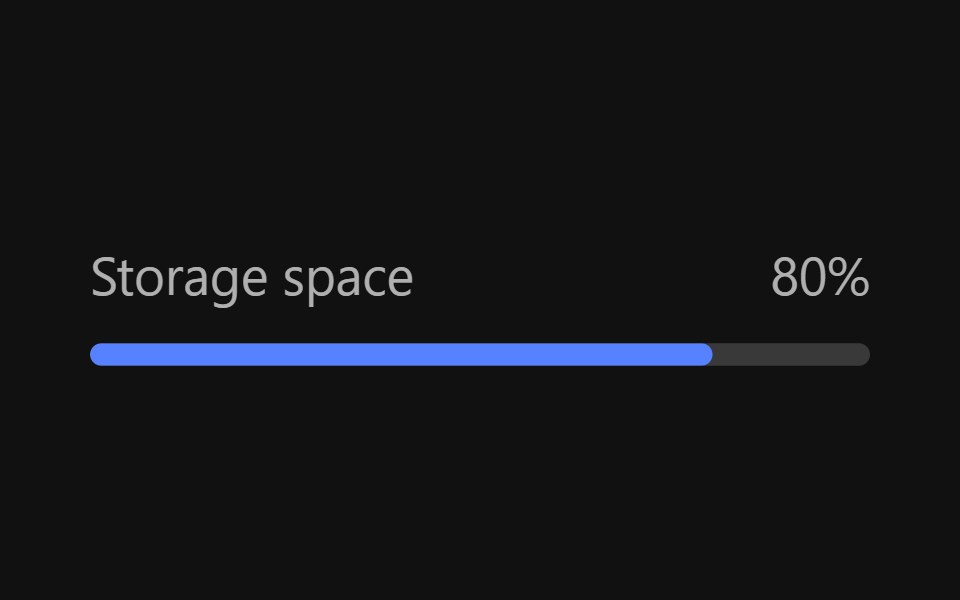 MeterReact Spectrum · ReactMeters are visual representations of a quantity or an achievement. Their progress is determined by user actions…
 Comp 362Origin UI · React
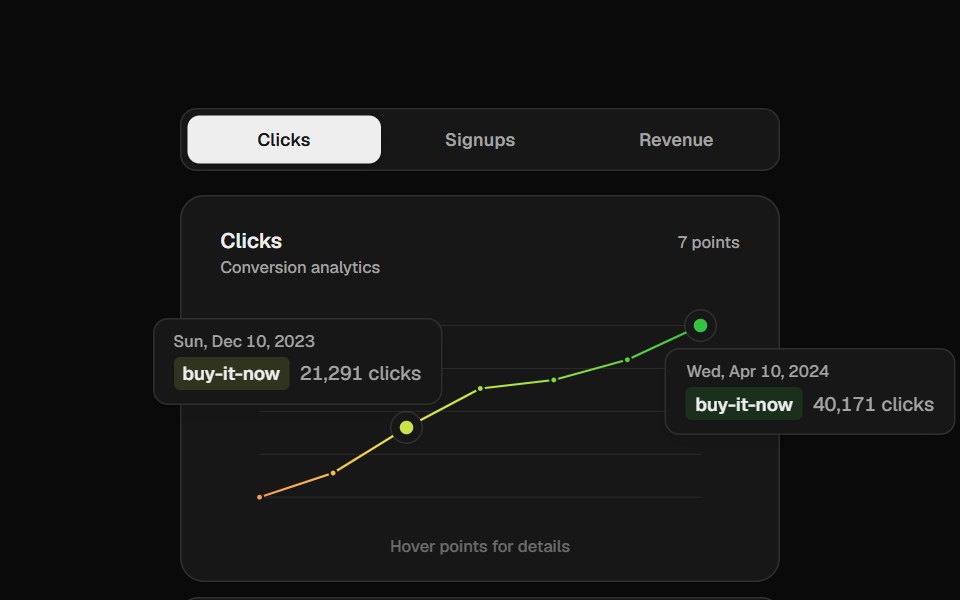 Analytics ChartCult UI · ReactVercel-style gradient line chart with floating tooltip cards
 Area ChartTremor · React
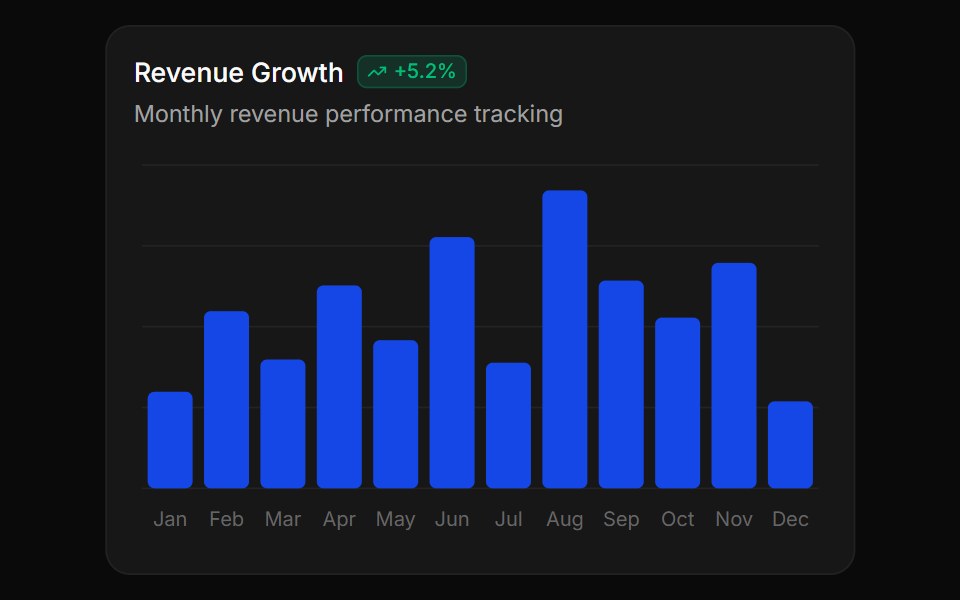 Basic bar chartReUI · ReactBasic bar chart
 Graphpdfcn · ReactGraph PDF component (forme)
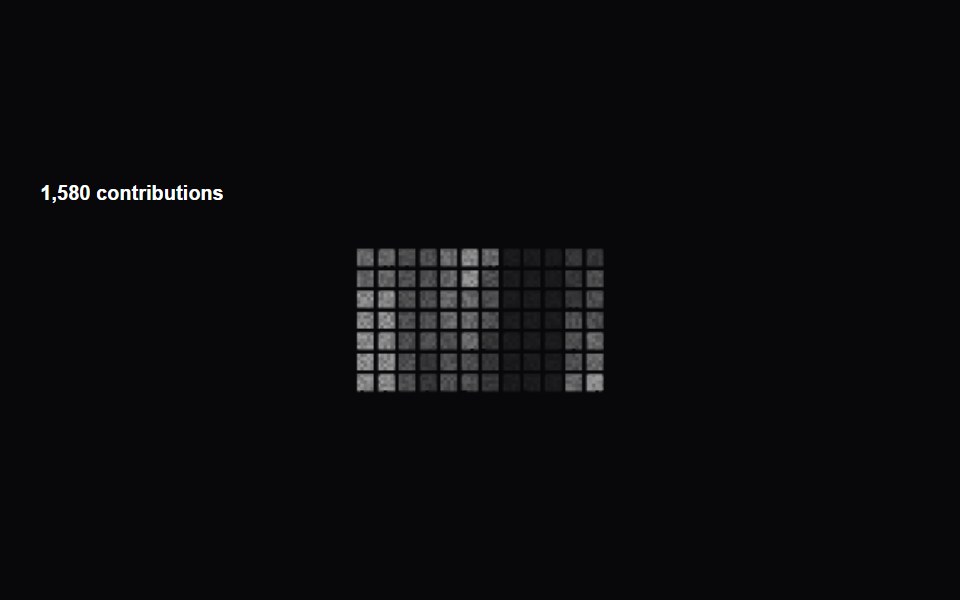 Activity Dither HeatmapAmicro Micro Transitions · ReactGitHub-style activity heatmap with interactive dither dots.
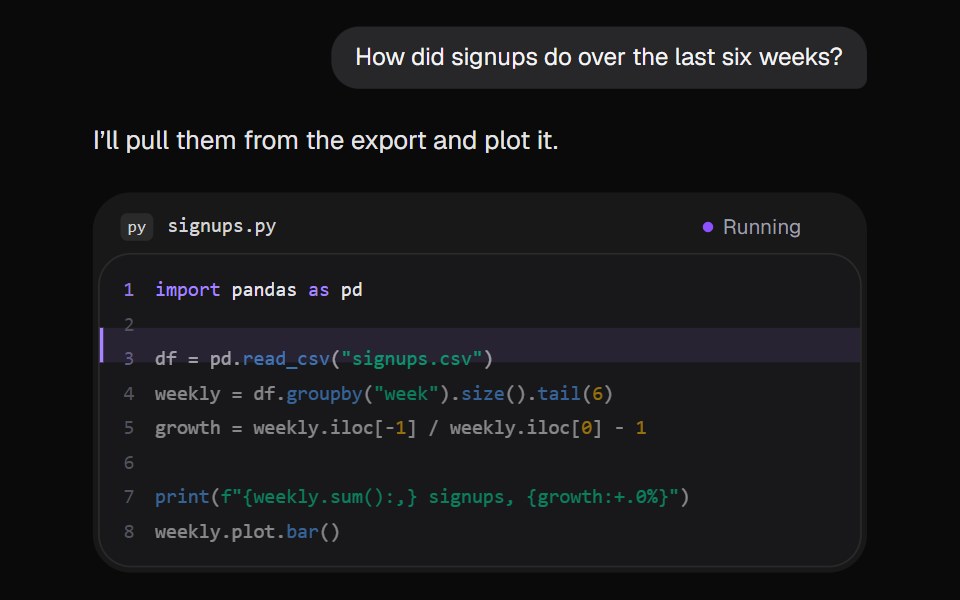 AI Code RunKokonut UI · ReactThe assistant runs a short Python script in the reply. A marker steps down the lines, the output prints, and the chart…
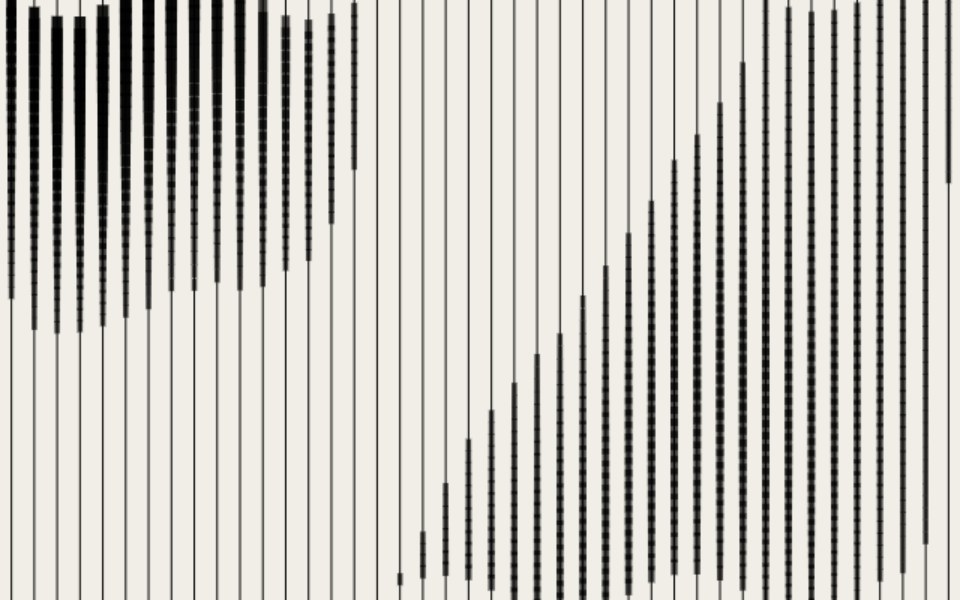 Horizontal BarsCursify · React
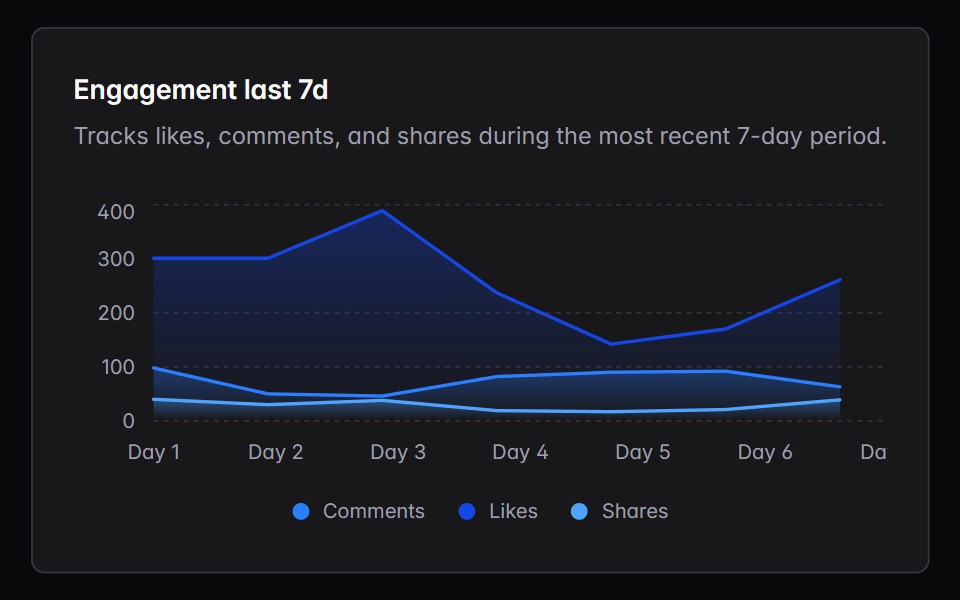 area-chartIntent UI · Reactarea-chart
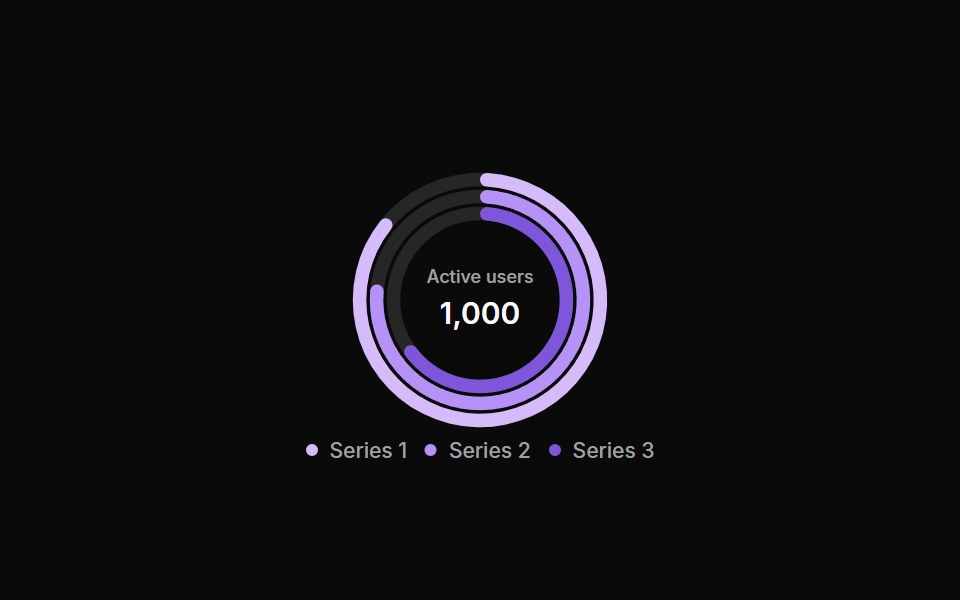 ChartsUntitled UI React · React
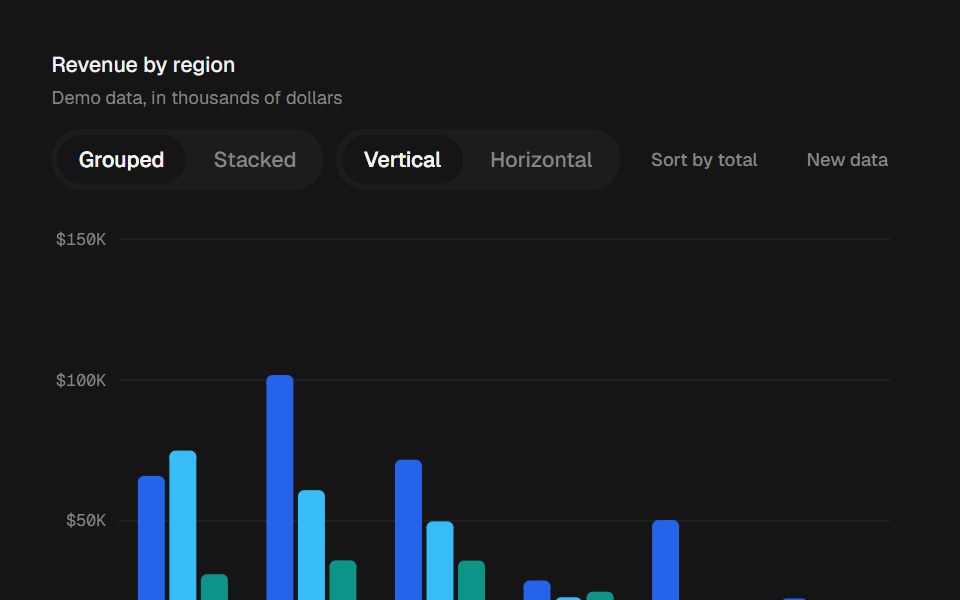 Bar ChartbeUI · ReactGrouped, stacked and horizontal bars that grow in, rescale and reorder with springs.
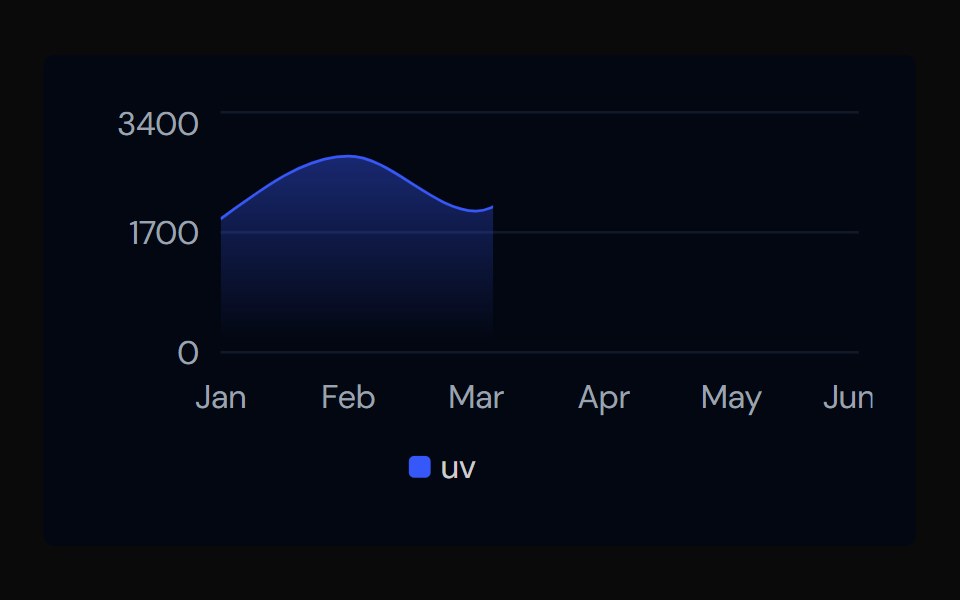 ChartTailGrids · ReactA chart component with multiple variants.
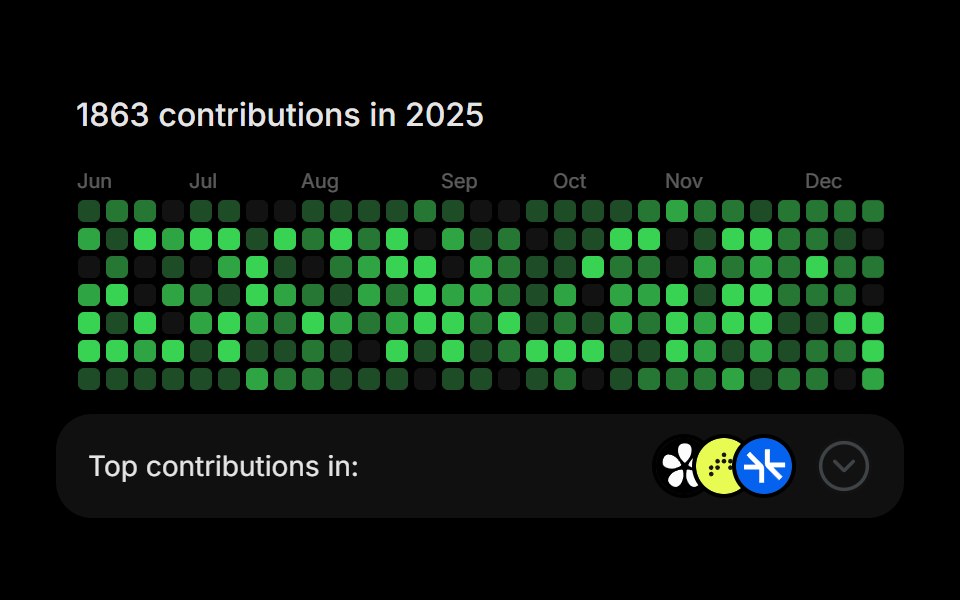 GitHub ActivityRare UI · ReactA contribution heatmap with a footer panel that expands over the grid to rank your top repositories.
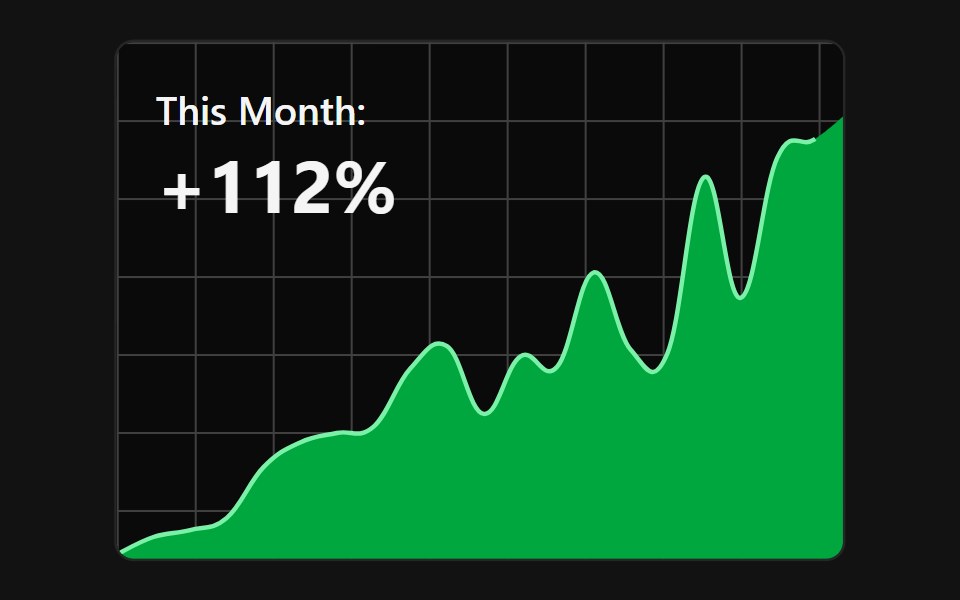 Animated SVG ChartSpectrum UI · Reactcomponent for the Animated SVG Chart
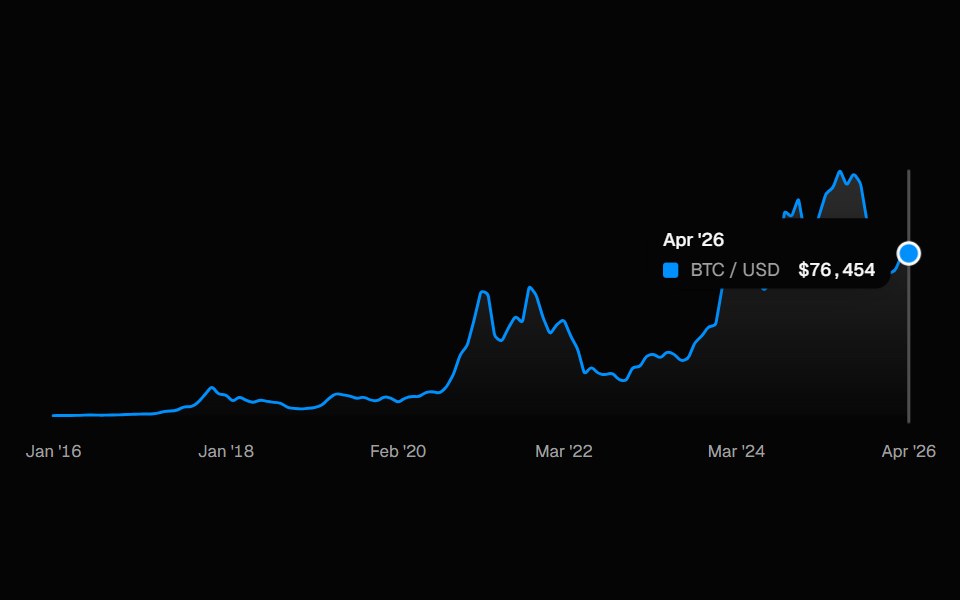 ChartSpell UI · ReactInteractive line chart with a cursor-tracked tooltip card, snap-to-point hover, and built-in X-axis labels.
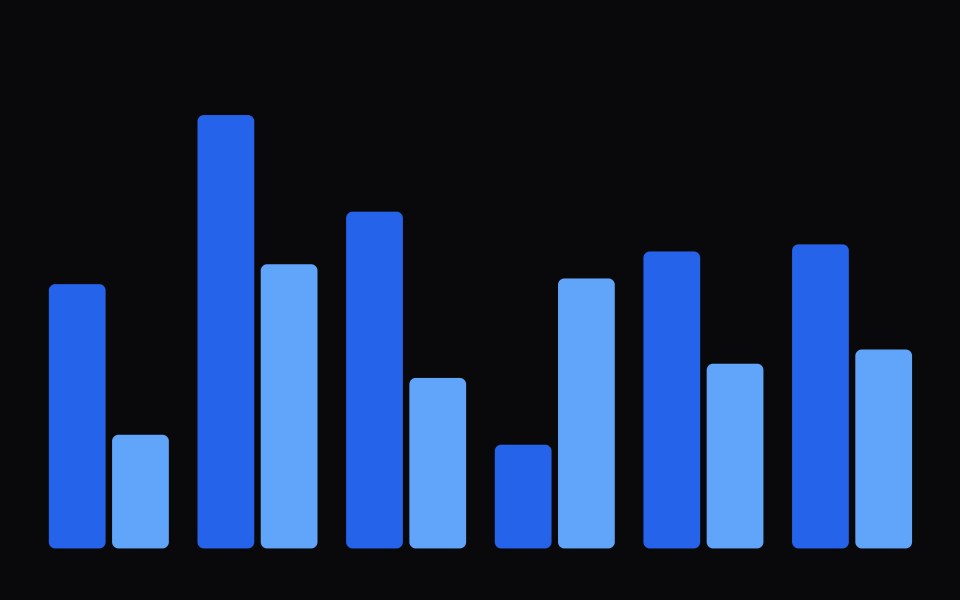 ChartVengeance UI · React
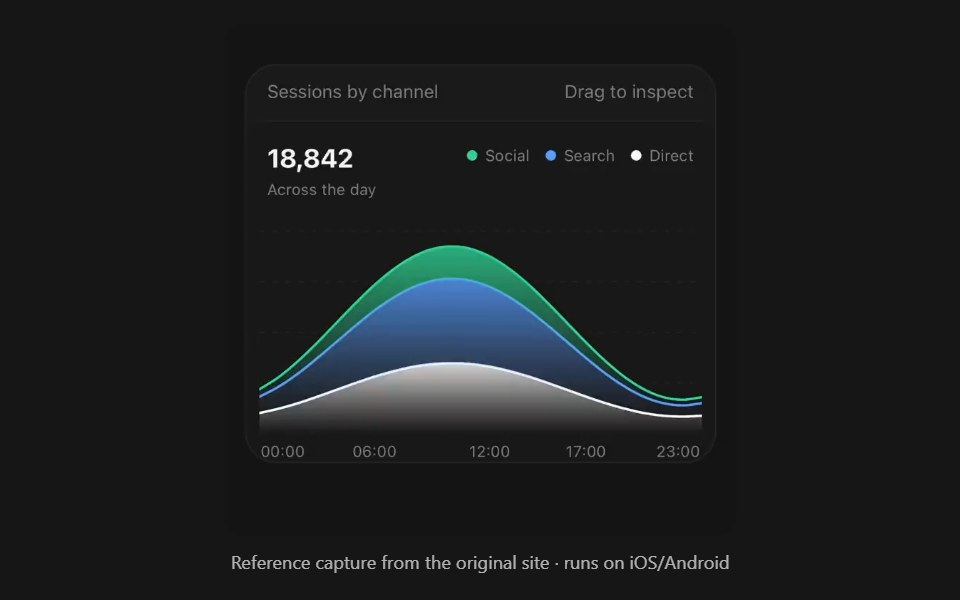 Area ChartPanel UI · React NativeFilled bands over time, stacked or overlaid.
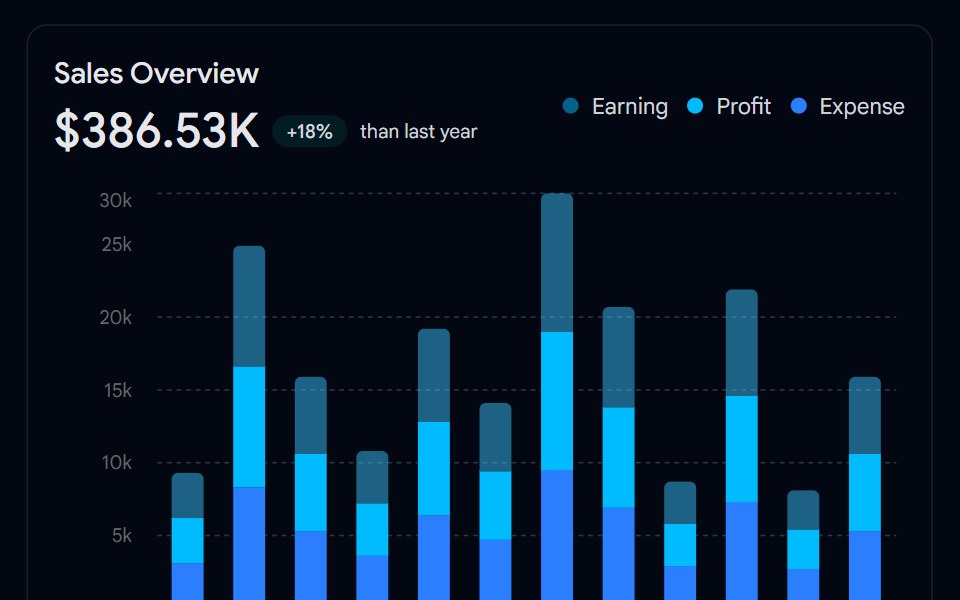 Chart 01 - Sales Performance Bar ChartShadcn Space · ReactAn interactive stacked bar chart displaying monthly earnings, profit, and expenses, ideal for admin dashboards to…
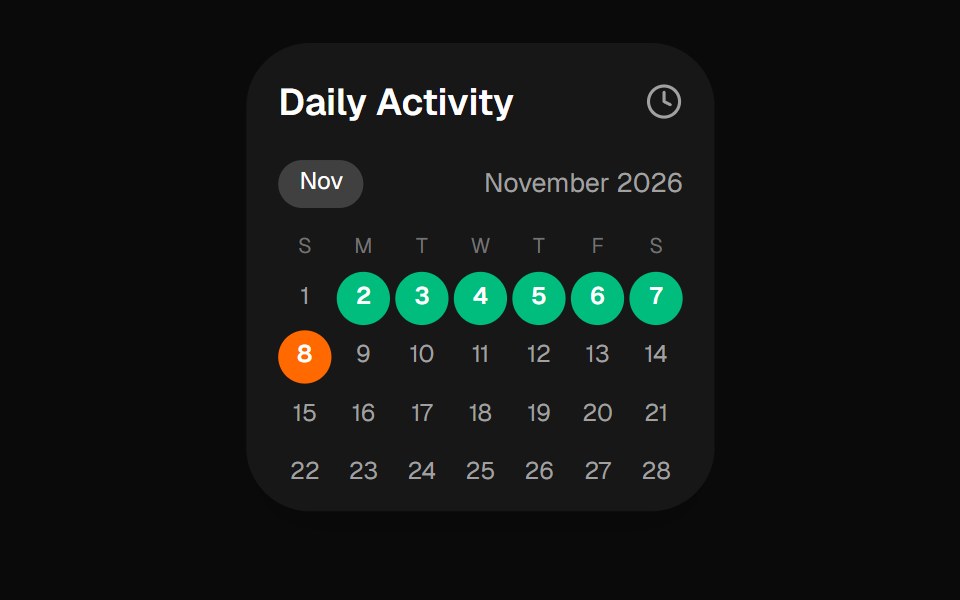 Daily Activity Calendar WidgetOpenSourceUI · React
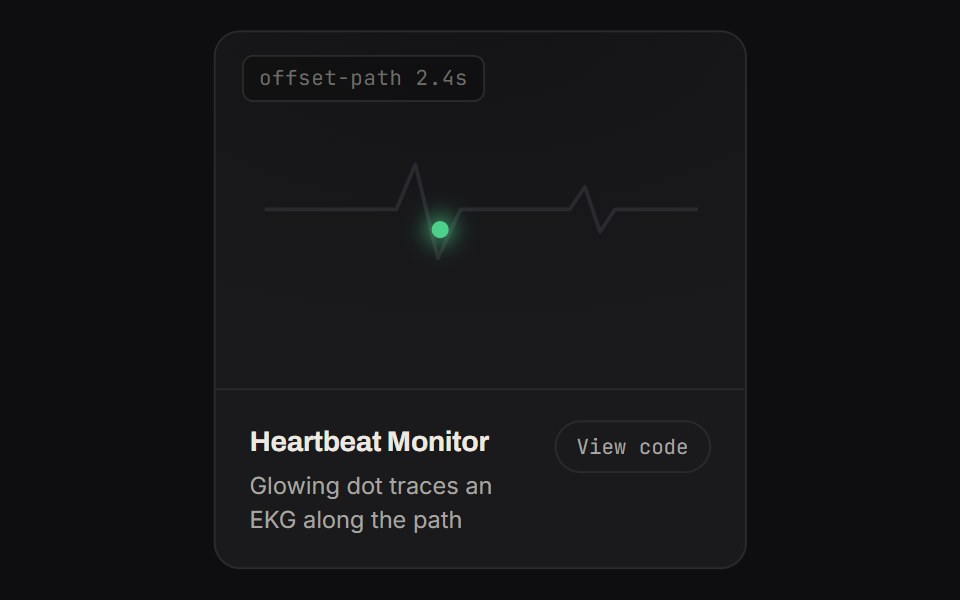 Heartbeat MonitorKinetics · HTML/CSSGlowing dot traces an EKG along the path
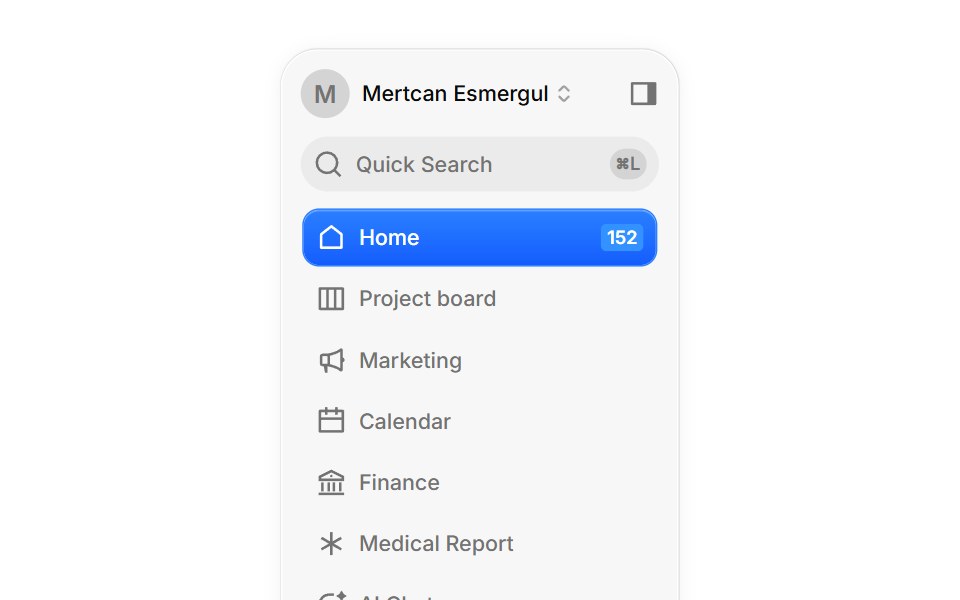 DashboardBoardUI · React
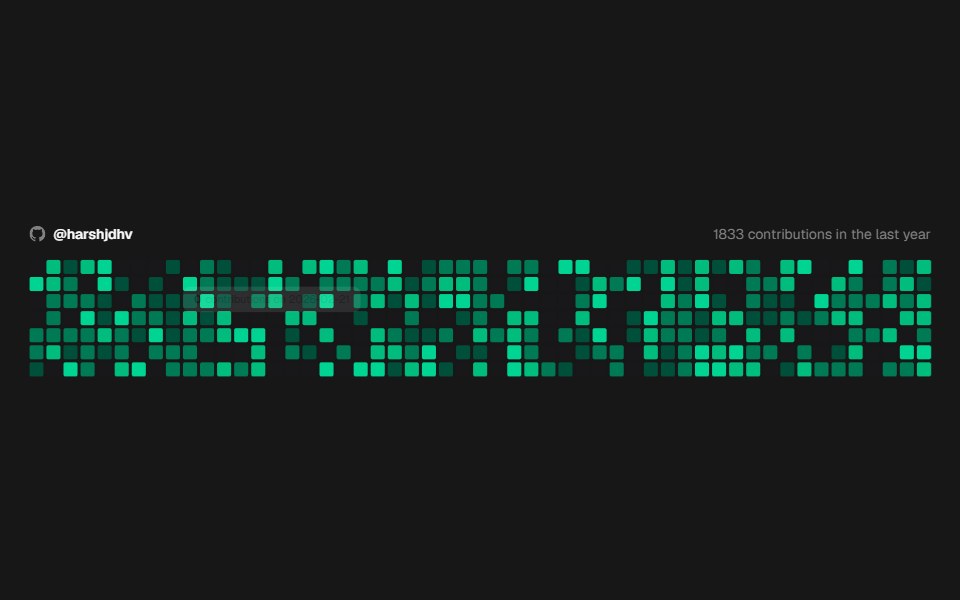 Github CalendarComponentry · ReactGitHub-style contribution calendar heatmap.
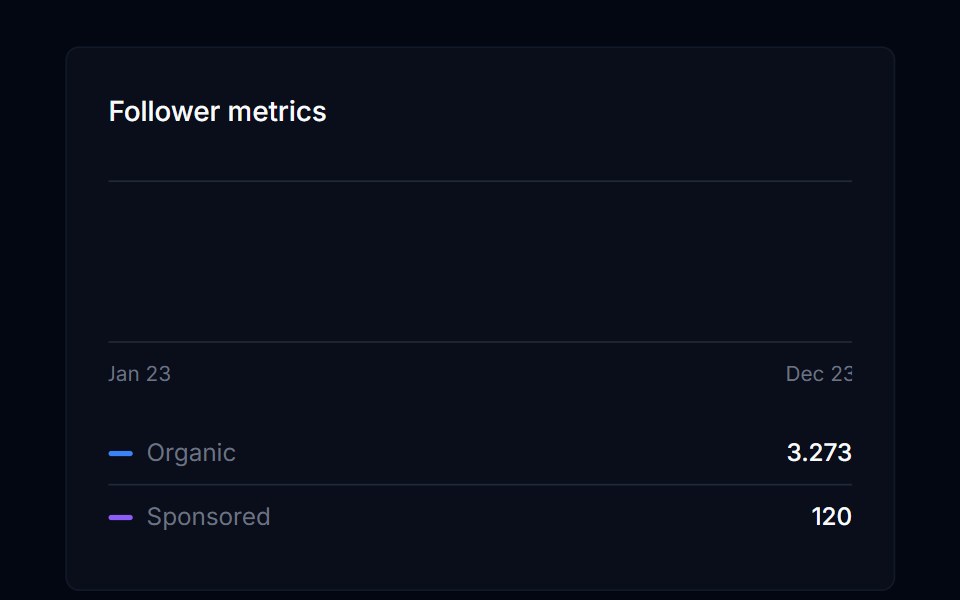 Area ChartTremor Blocks · ReactThe base area chart component (Recharts): any number of series, legend, tooltip, axes, stacked or percent mode…
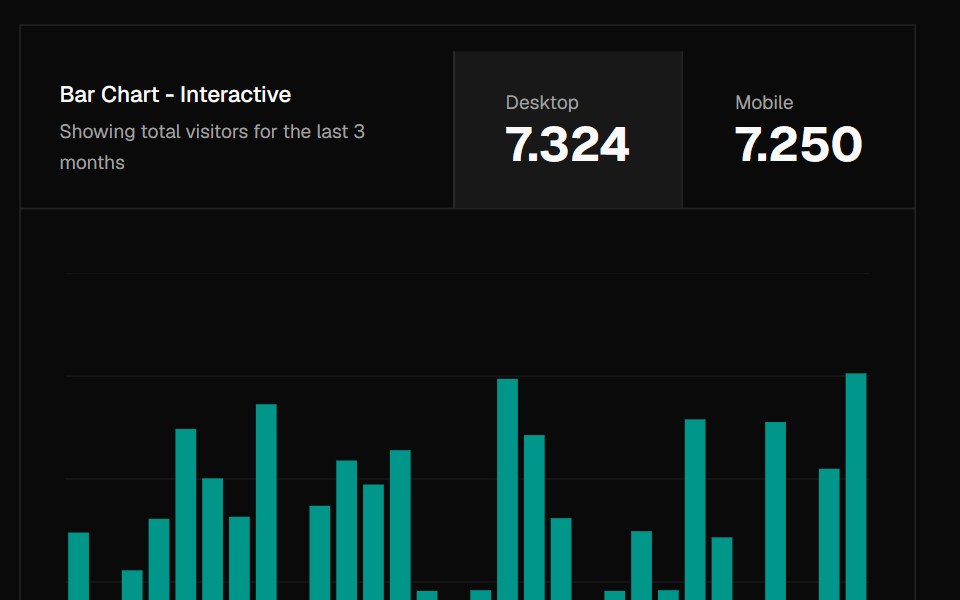 ChartShadcn Dashboard · React
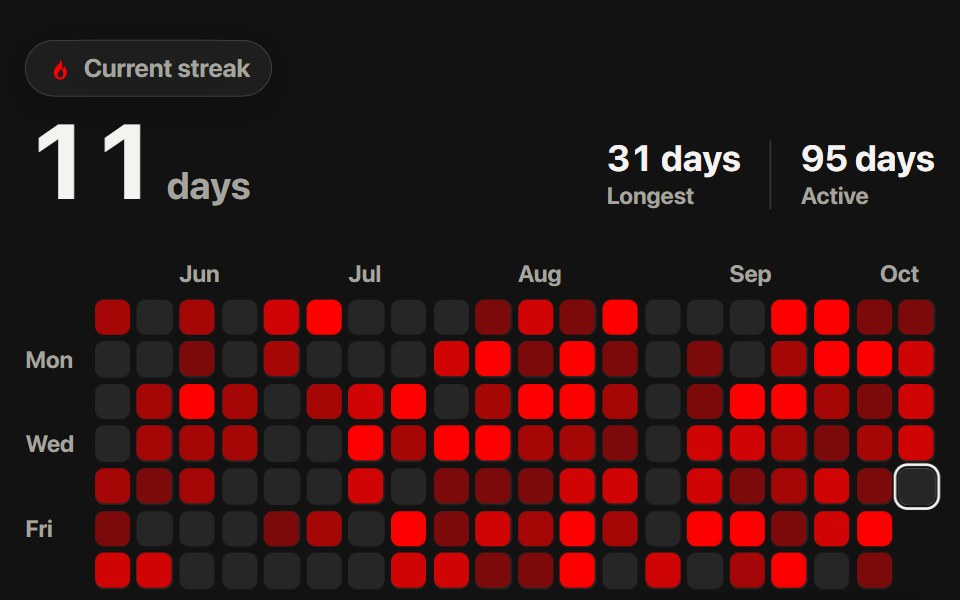 Activity HeatmapSwiftPieces · SwiftUIA streak calendar in steps of red with a glass streak chip, and a scrub that lifts each day with a callout and a…
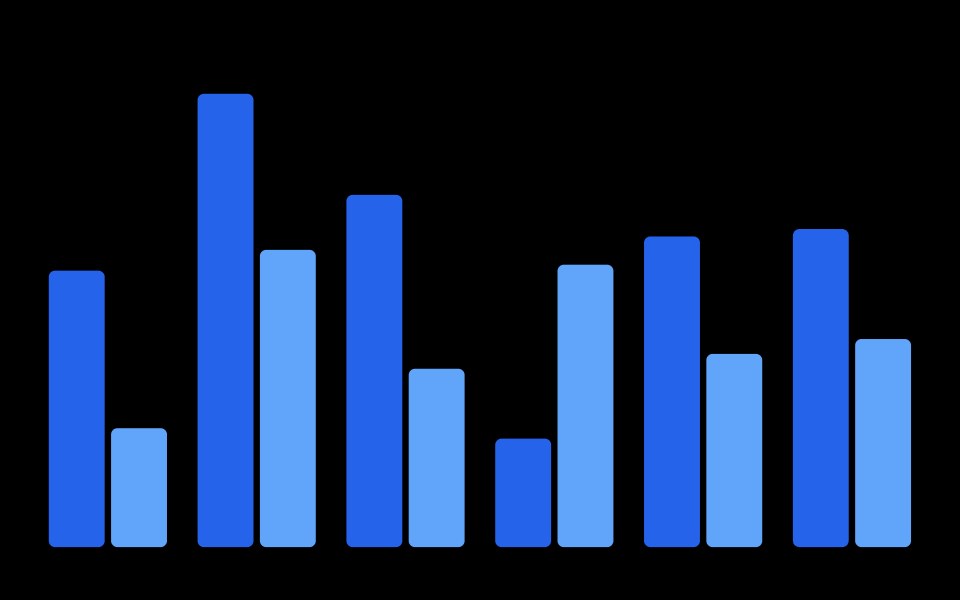 ChartObsidianUI · React
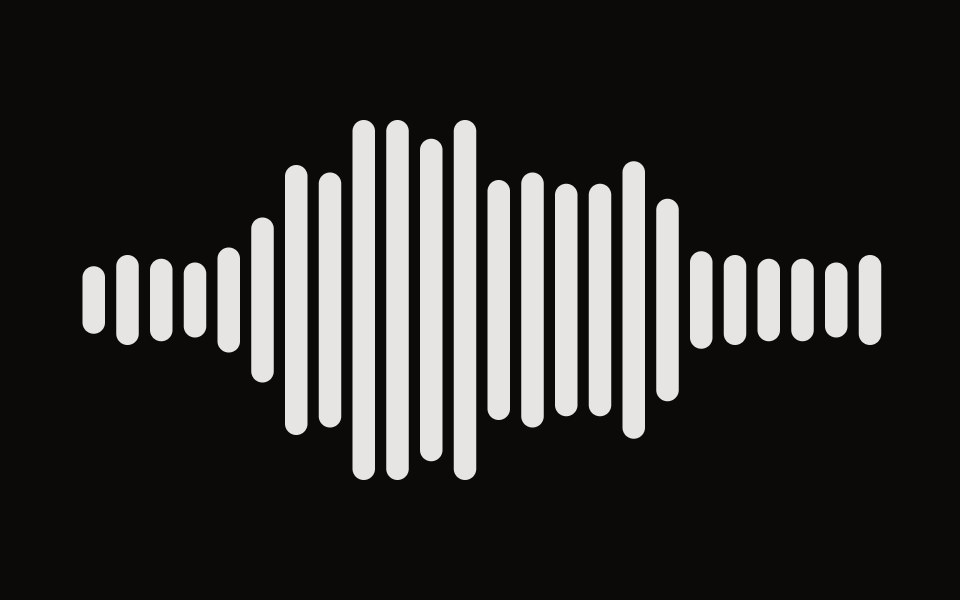 Bar Visualizeraudiocn · ReactA row of bars driven by frequency bands, with idle, loading and mirrored modes. Bars paint without re-rendering React.
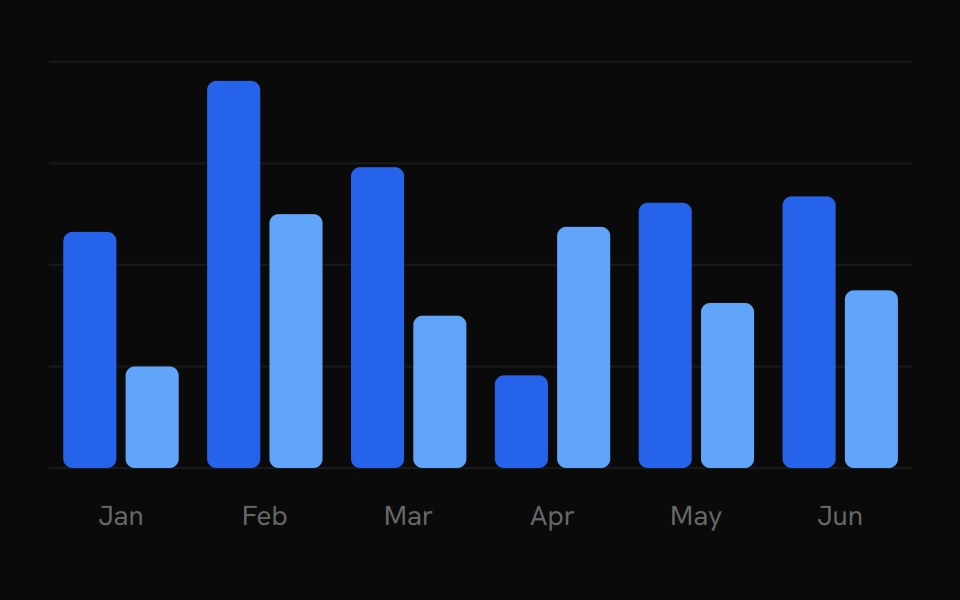 ChartShark UI · ReactVisualize data with beautiful charts.
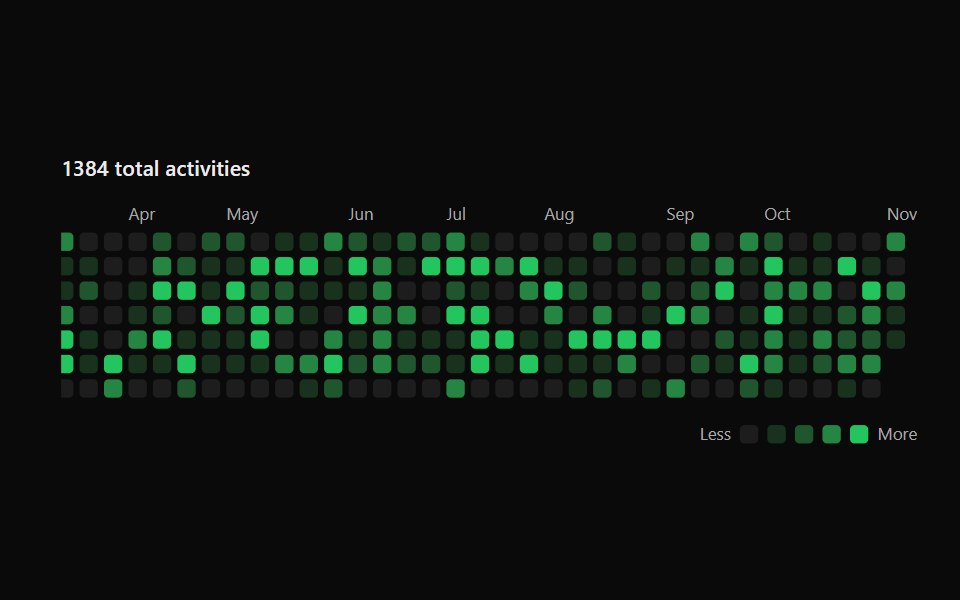 Activity GraphSona UI · ReactA keyboard-accessible calendar heatmap with normalized intensity levels and an interruptible shared focus surface.
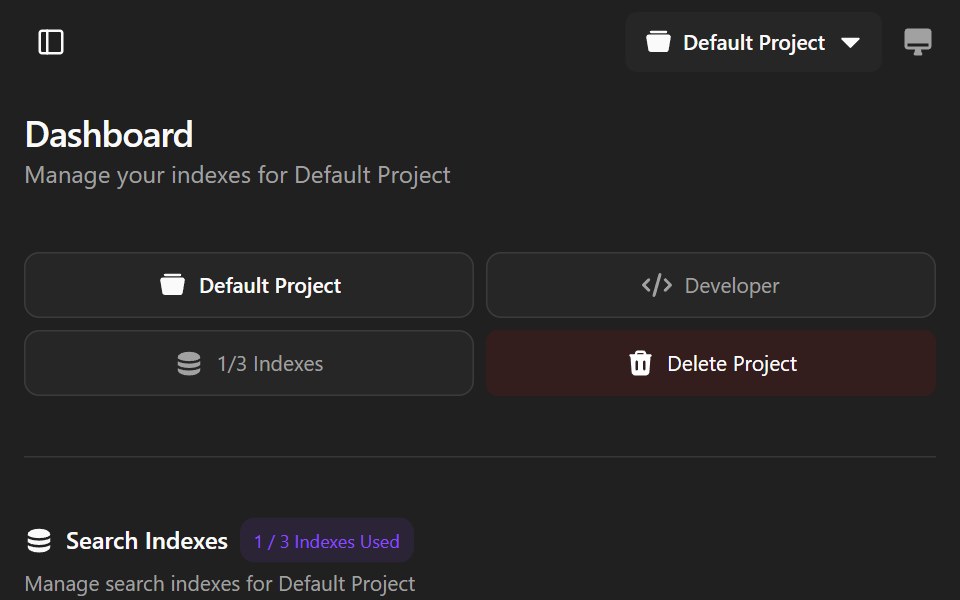 Agndex DashboardWatermelon UI · ReactA developer portal for managing search indexes, API credentials, billing, and project settings with light and dark…
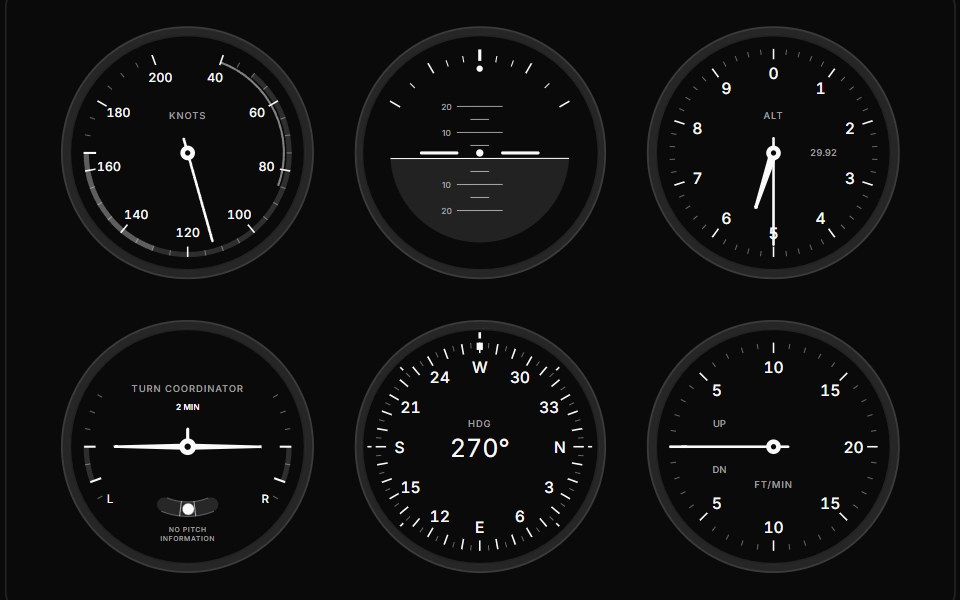 GaugeGauge UI · ReactComposable SVG gauge primitives: track, arc, zones, ticks, tick fills, labels, needle, hub, dot, tooltip and value…
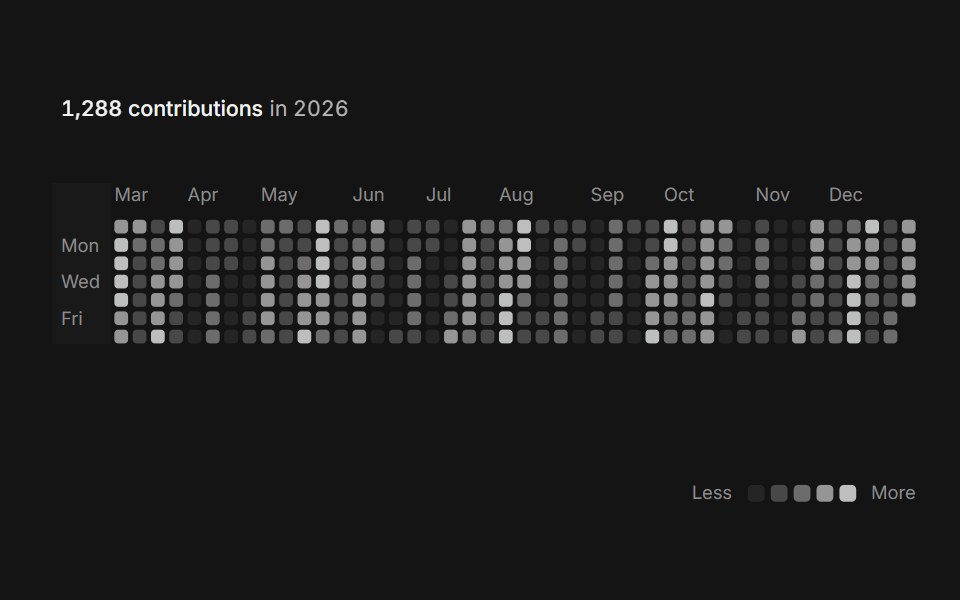 Activity heatmapArc Library · ReactSee a year of activity at a glance, one square per day.
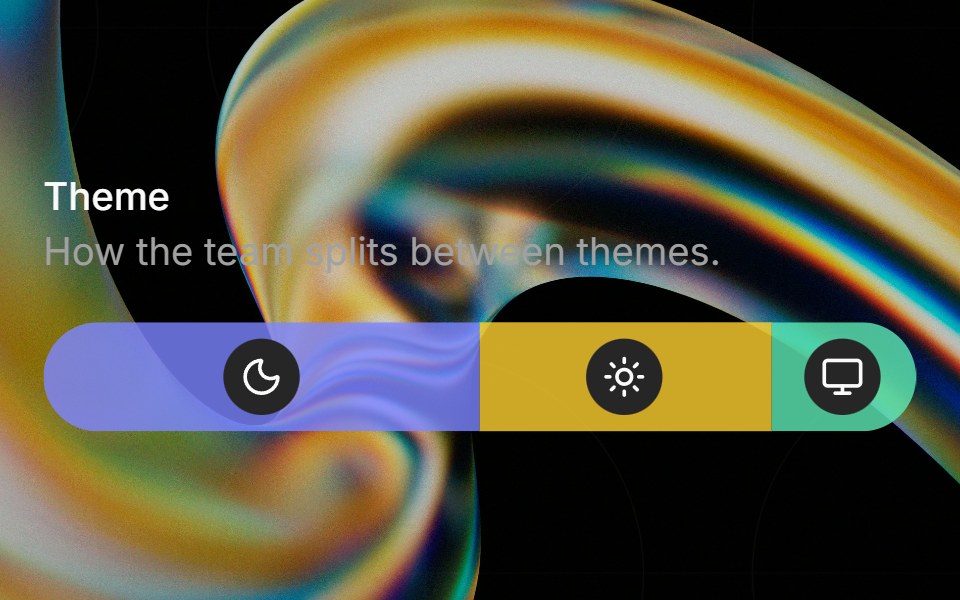 Preferenceglasscn · ReactA weighted preference bar with icon badges, hover tinting, and tooltip descriptions.
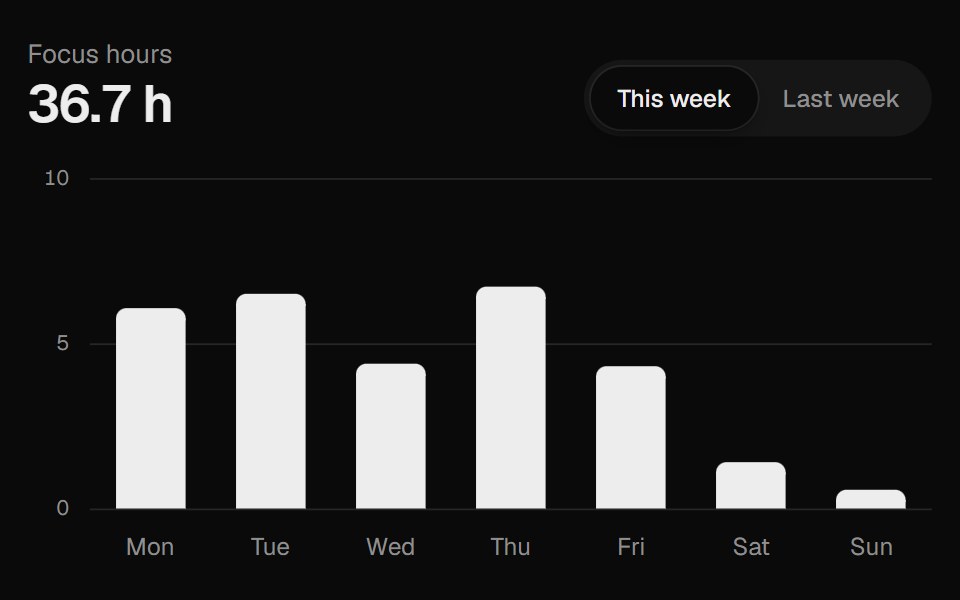 Bar ChartUI Lab · ReactGrows its bars from the baseline and springs them between two weeks.
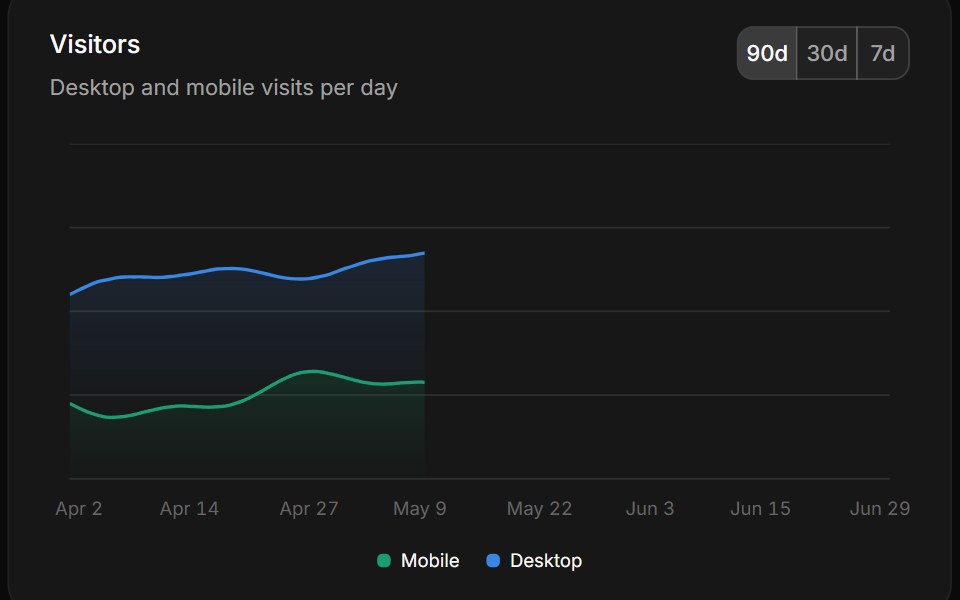 ChartHextaUI · ReactRecharts charts with themed colors, a tooltip and legend that read labels from one config, and keyboard navigation…
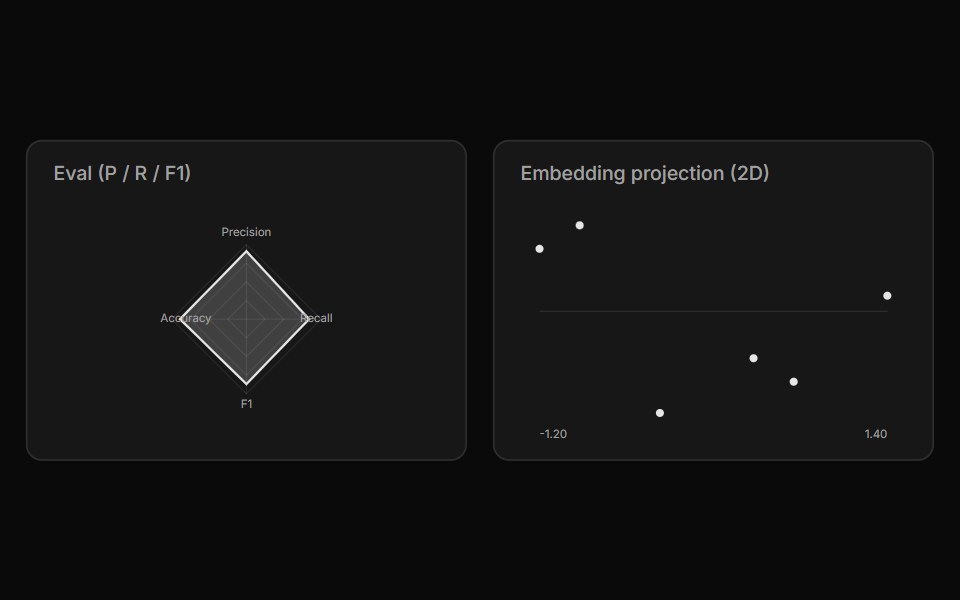 Chart ArtifactLocalMode · ReactA dependency-free inline-SVG chart (line / bar / area / scatter / radar / gauge) for local metrics — eval curves…
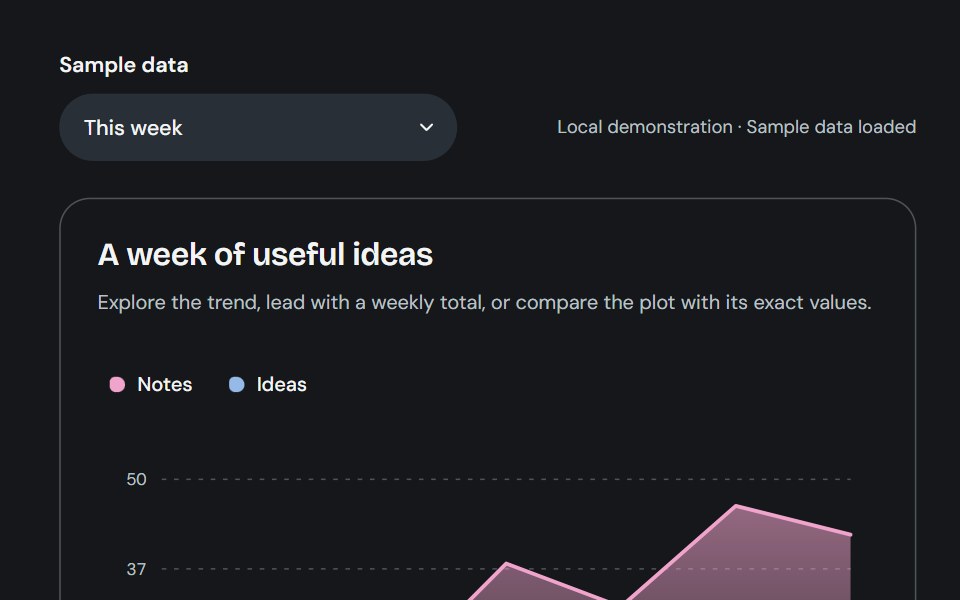 Area chartCojeev UI · ReactLayered area charts with shared series colors, responsive bounds and a keyboard data inspector.
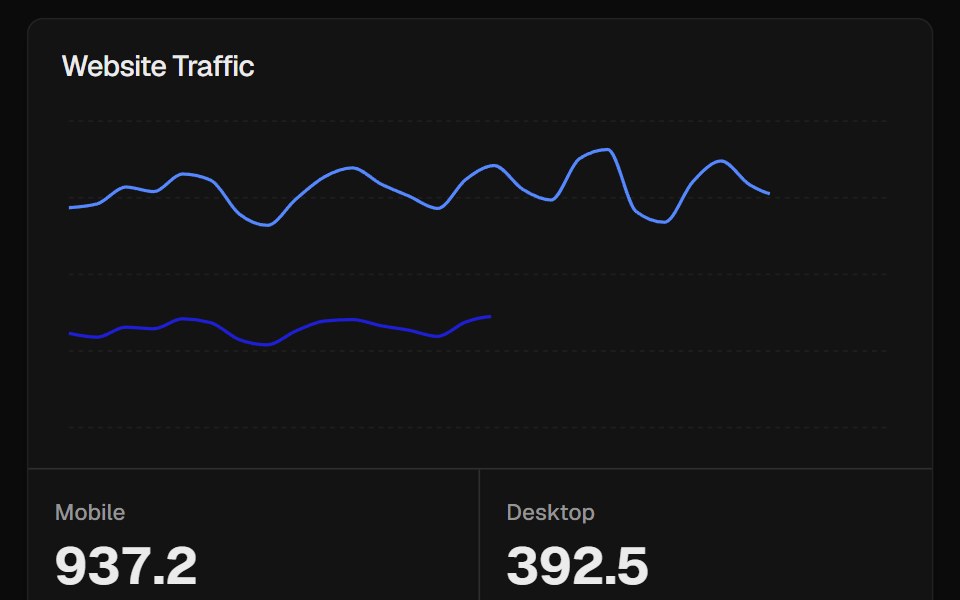 Traffic CardROI UI · ReactA website traffic card component with line chart and statistics.
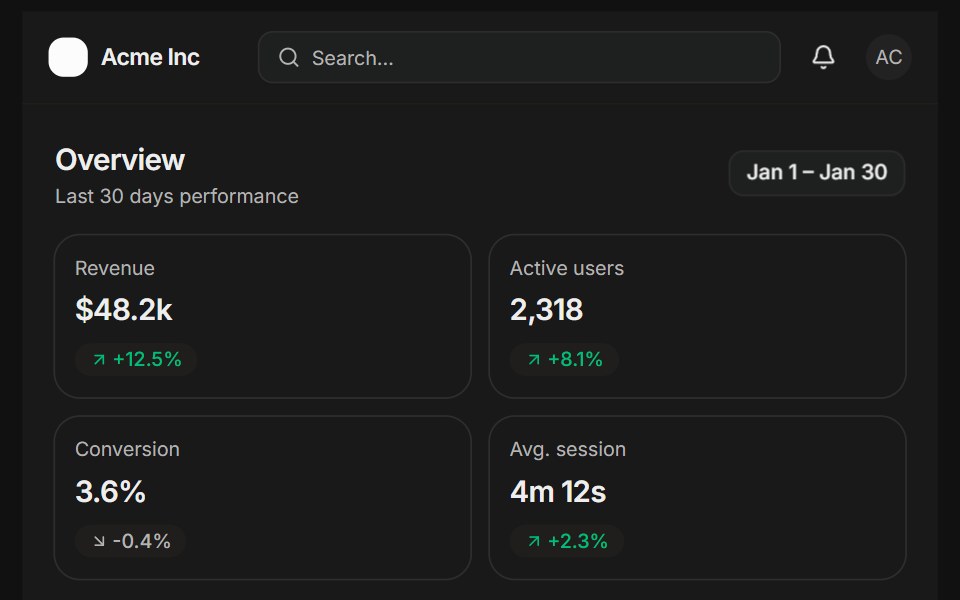 Analytics overviewFLX UI · ReactSidebar, KPI cards, a bar chart, and a recent activity list.
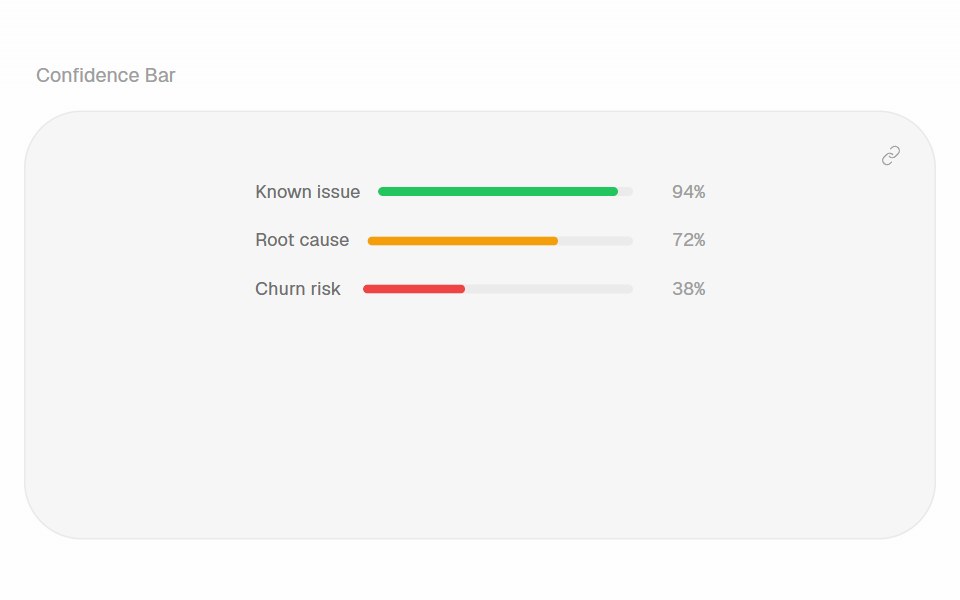 Confidence BarHalaska UI · React
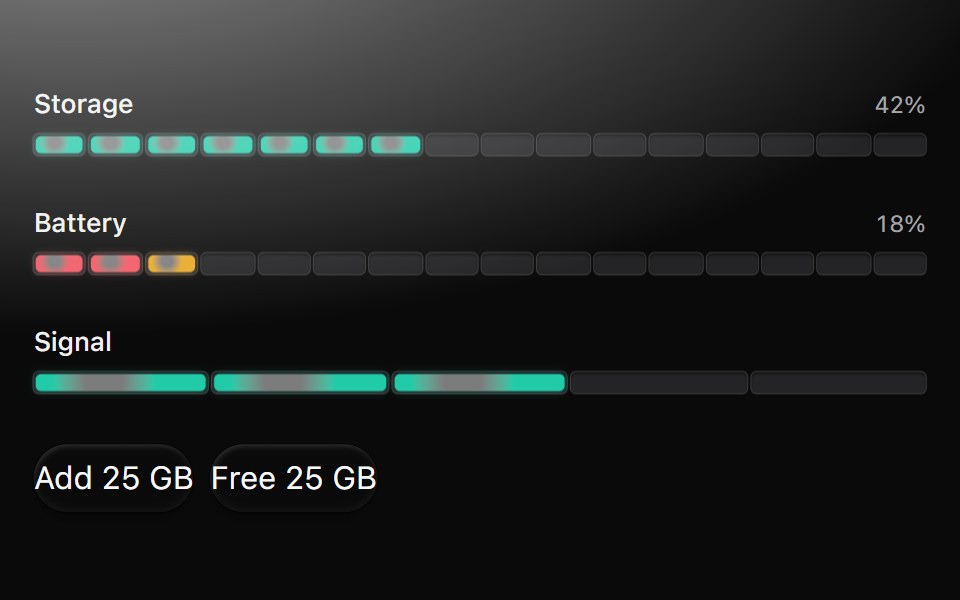 MeterMetal UI · React + SwiftUIA level in a range as a row of LED segments coloured by position (green, amber, red); a change sweeps segment by…
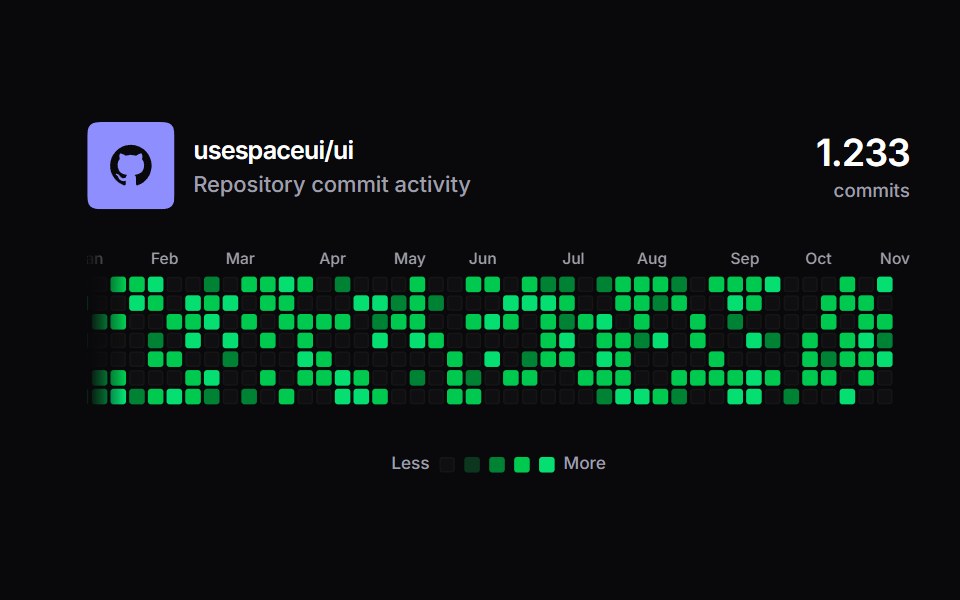 Github ActivitySpaceUI · ReactAn interactive GitHub ecosystem showcase featuring pure 52-week contribution heatmap matrix content with live fetch…
 Aria ChartReScript shadcn · ReScript
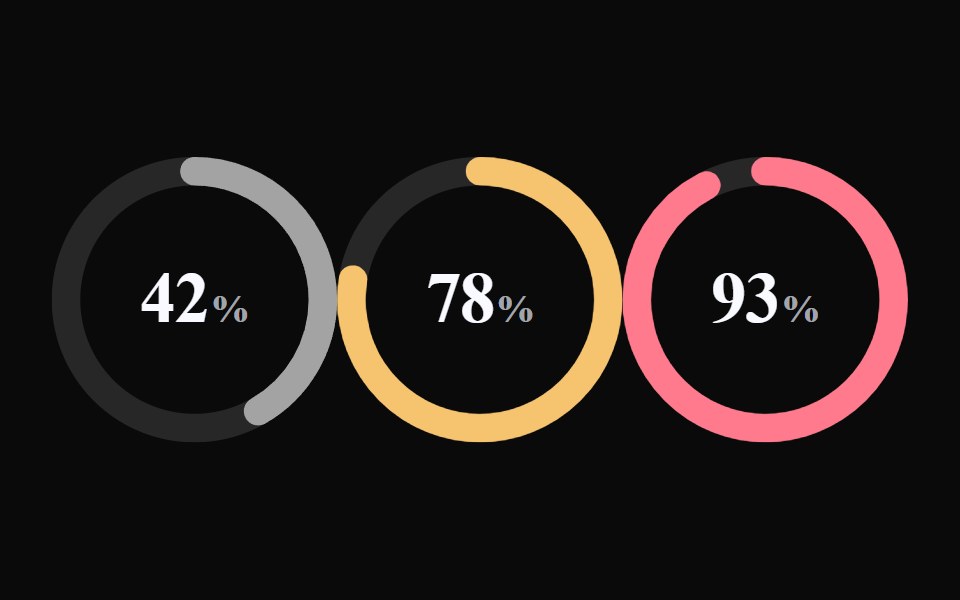 Liquid GaugeLiquefy UI · React
 Bento 01D2Studio UI · ReactBento grid for an education program platform with admin overview, faculty view and a program form.
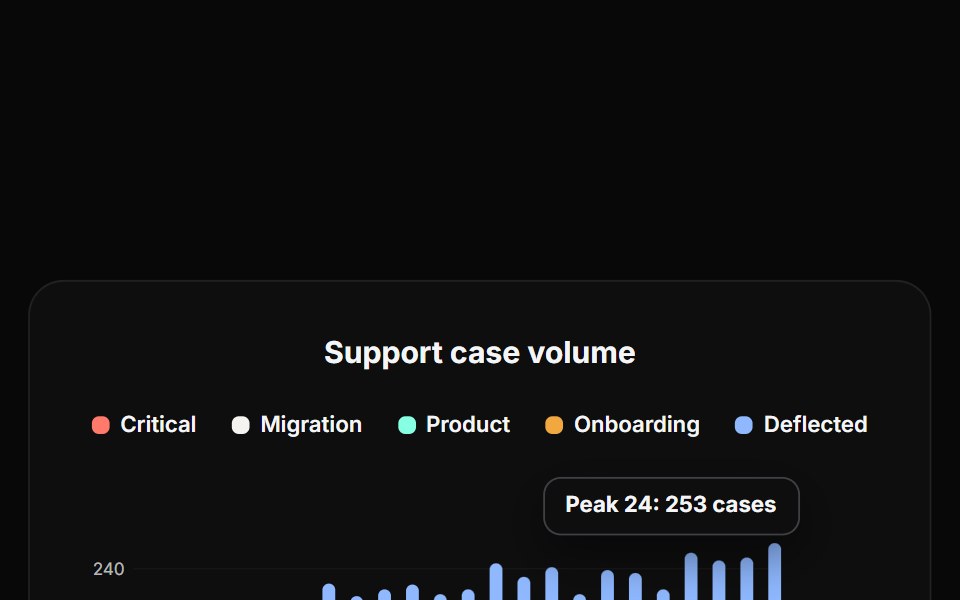 Bar ChartReactFrame · ReactA stacked bar chart, up to 5 series per bar, a reference line, a peak-value annotation, and a hover tooltip breaking…
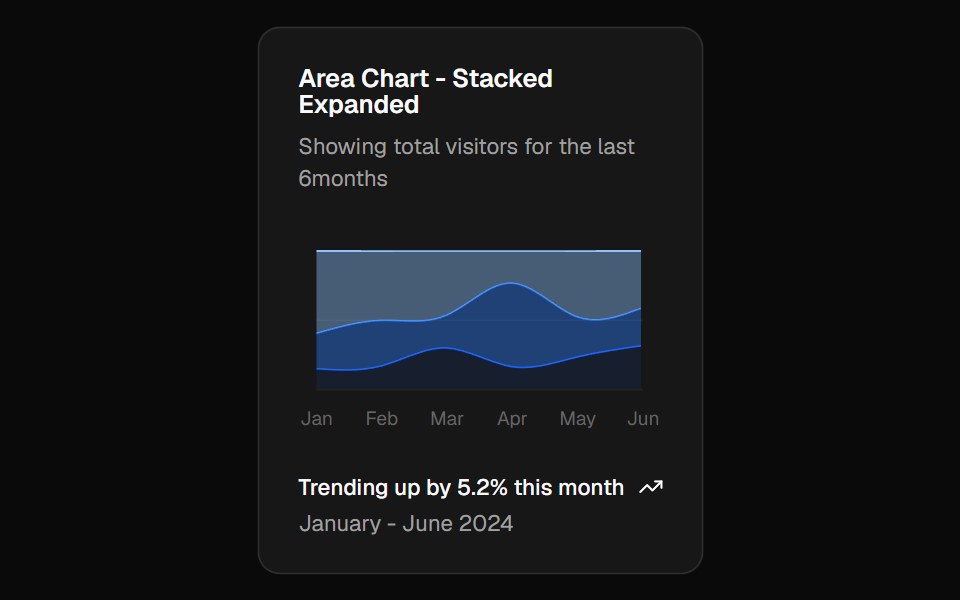 Chart Area Stacked Expandshadcn/ui · ReactStacked area chart example normalised to 100%, showing each series as a share of the total.
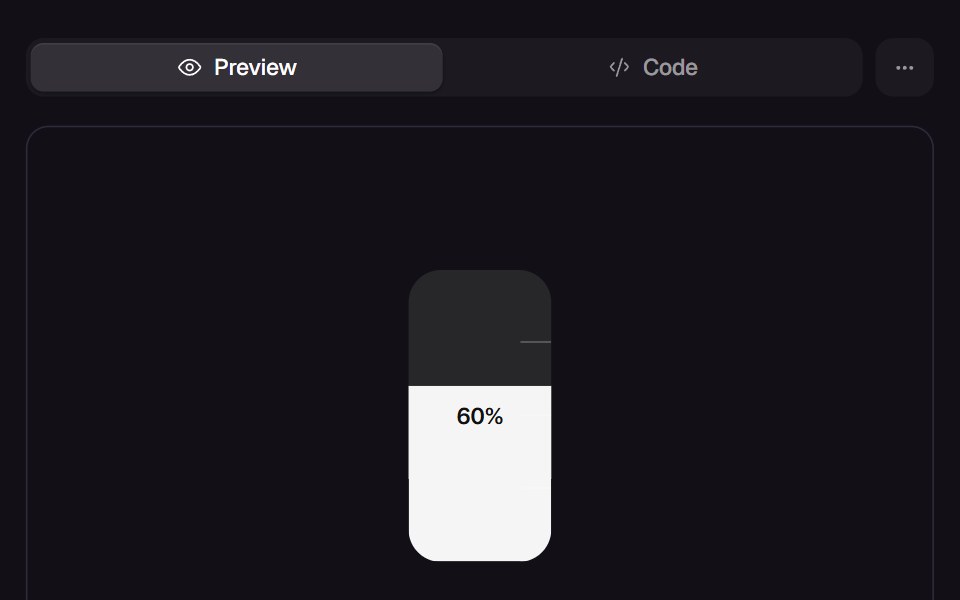 Slosh GaugeReact Bits · ReactTank gauge whose liquid chases the value with mass, tilts with its own speed and splashes against the top when it…
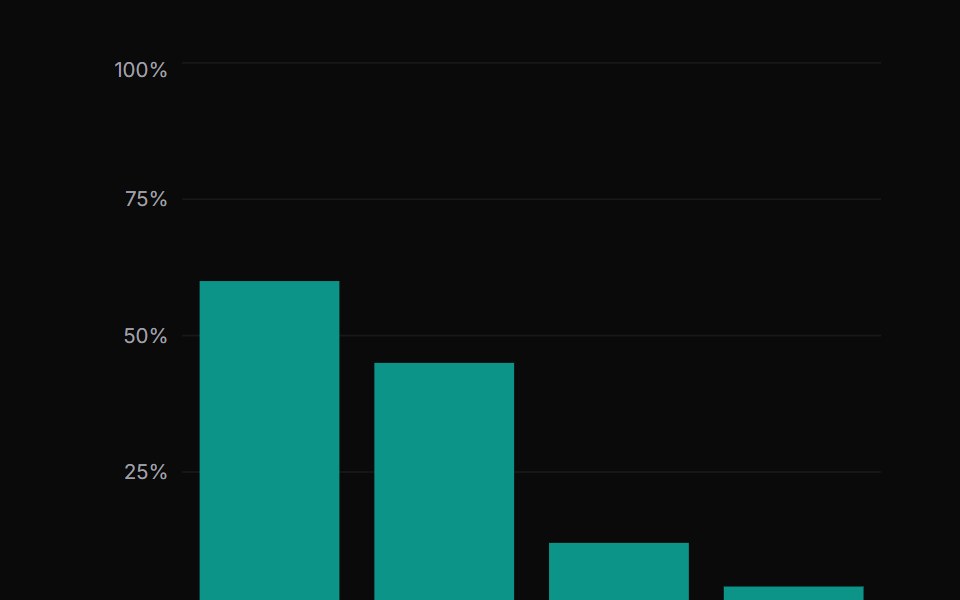 Bar ChartChakra UI · ReactUsed to display categorical data using rectangular bars of varying heights or lengths
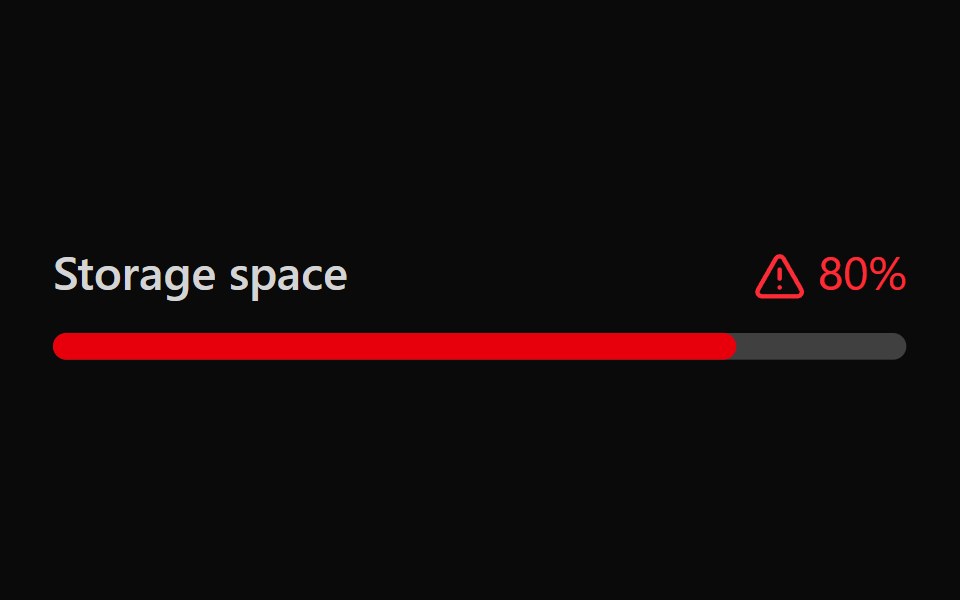 Tailwind MeterReact Spectrum · React
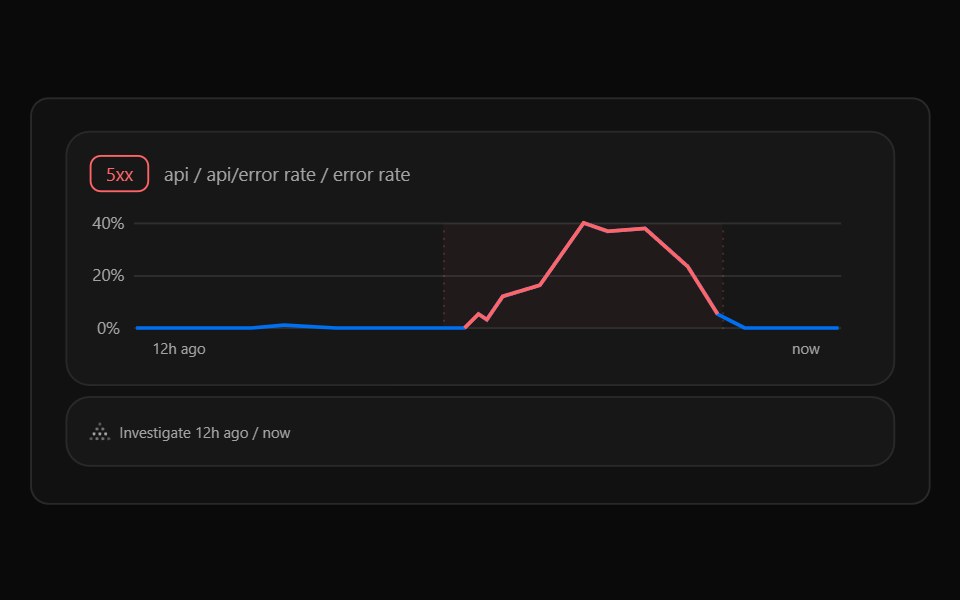 Illustration GraphCult UI · ReactGraph illustration component
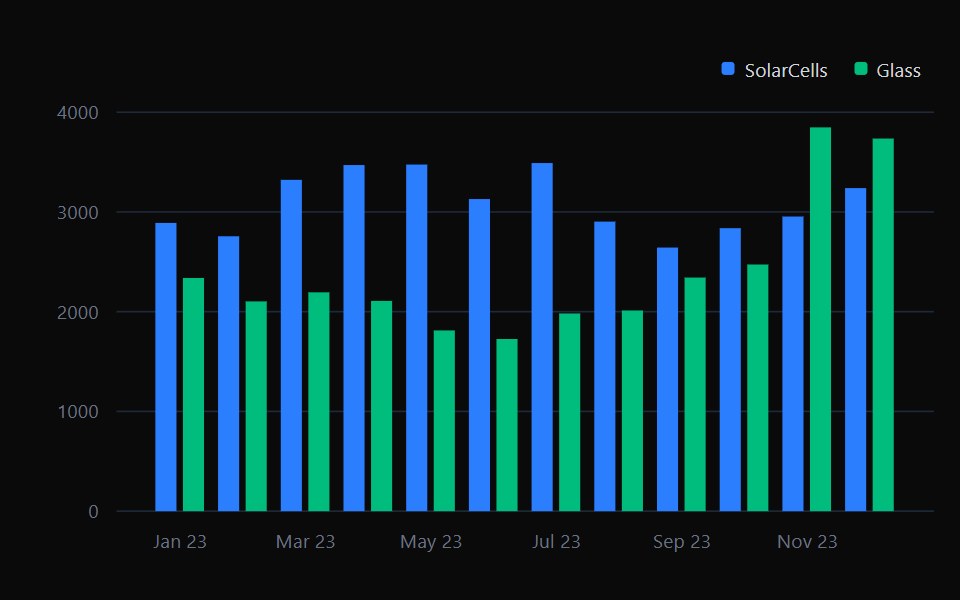 Bar ChartTremor · React
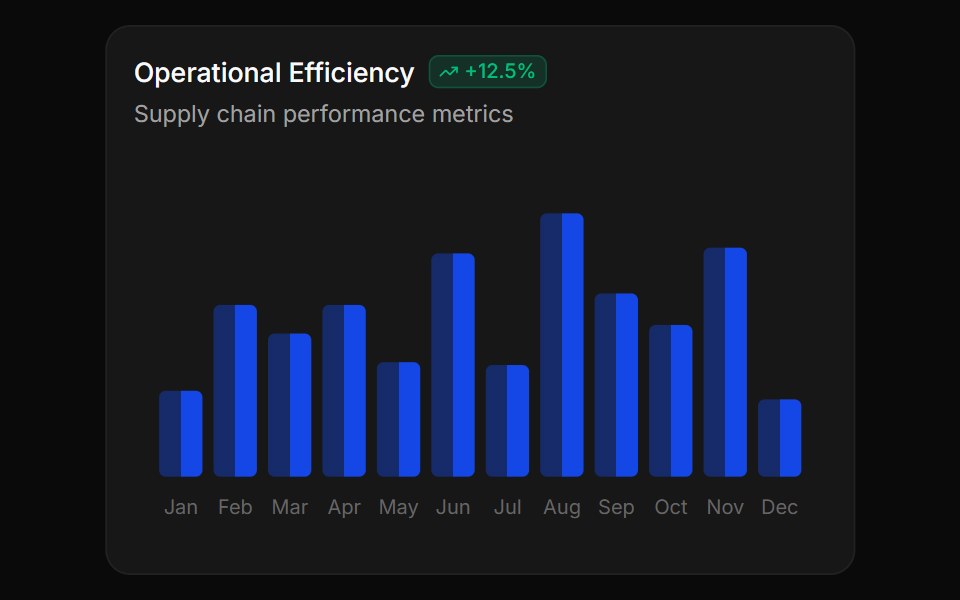 Duotone gradient bar chartReUI · ReactDuotone gradient bar chart
 Graphpdfcn · ReactGraph PDF component (takumi)
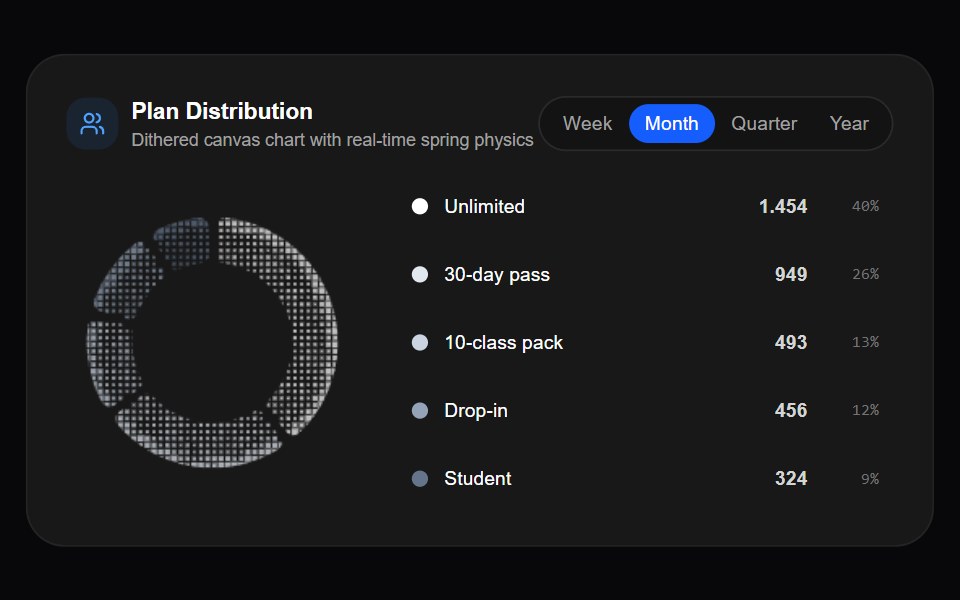 Dither Donut ChartAmicro Micro Transitions · ReactInteractive pixelated dither donut chart with real-time spring physics.
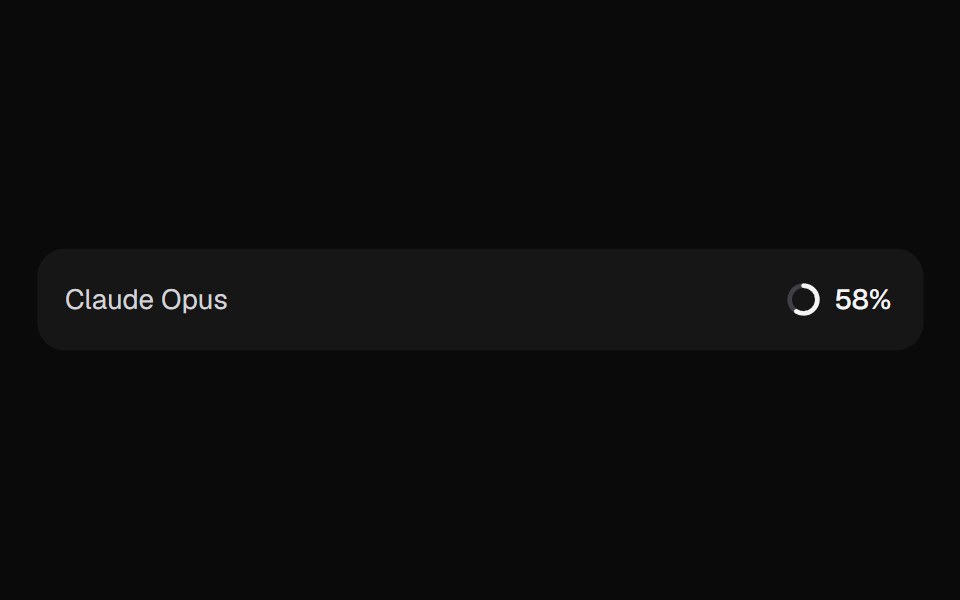 AI Context MeterKokonut UI · ReactHow full the context window is, as a ring in the prompt footer that opens a breakdown by source and compacts when it…
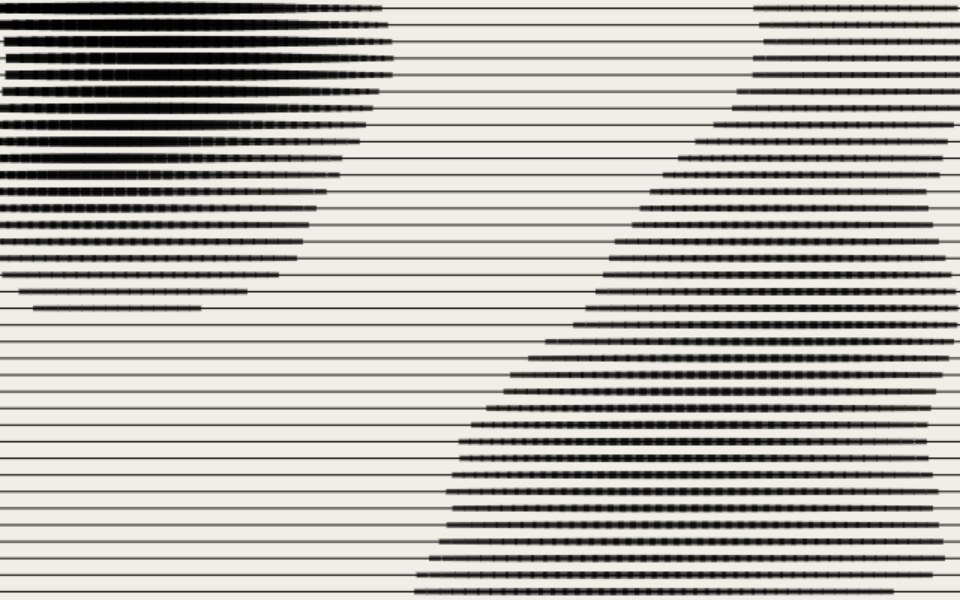 Verticle BarsCursify · React
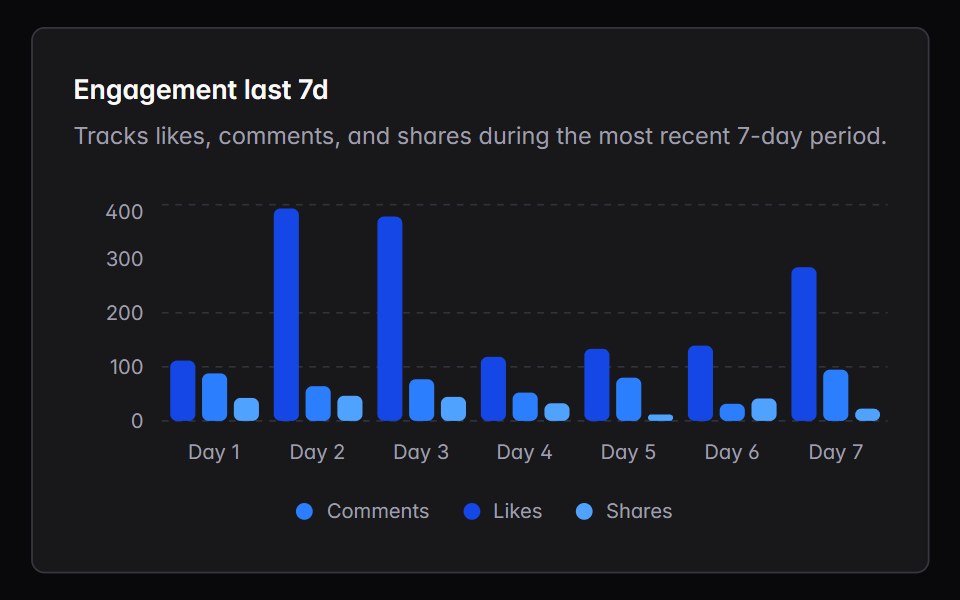 bar-chartIntent UI · Reactbar-chart
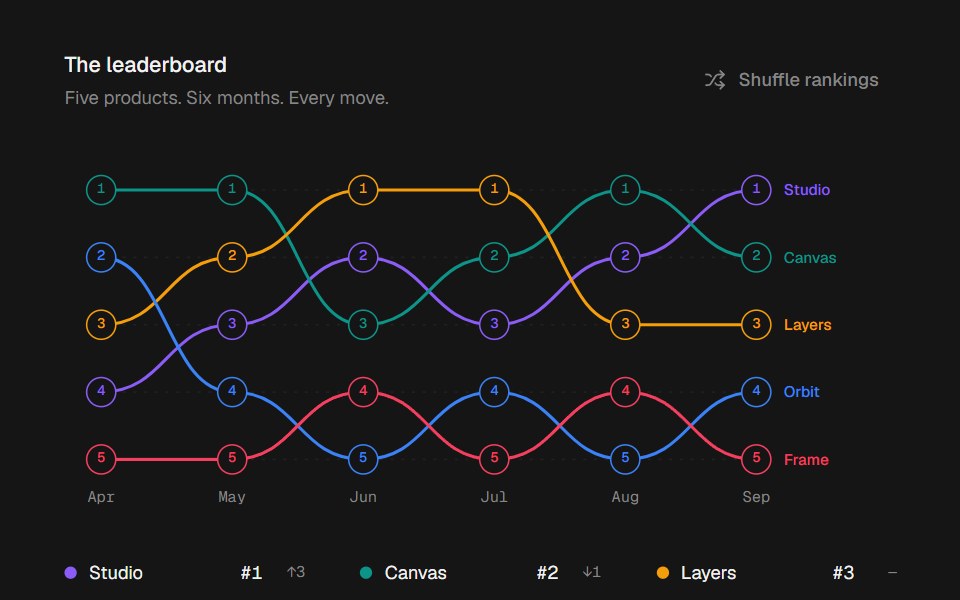 Bump ChartbeUI · ReactAnimated rankings with curved paths, interactive rank dots, and tooltips.
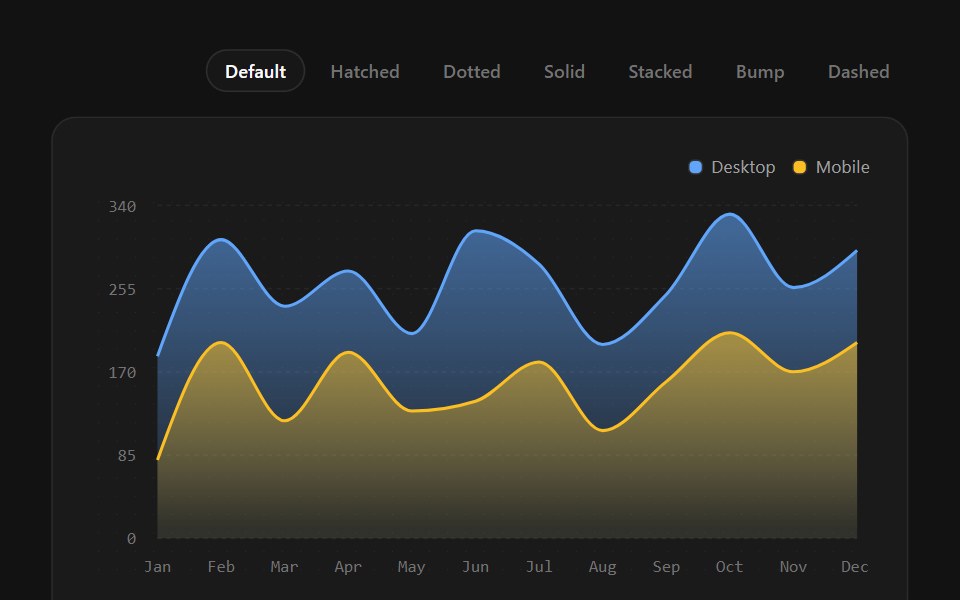 Area ChartSpectrum UI · ReactFilled areas with gradient, hatch, dotted, stacked, and dashed-stroke variants.
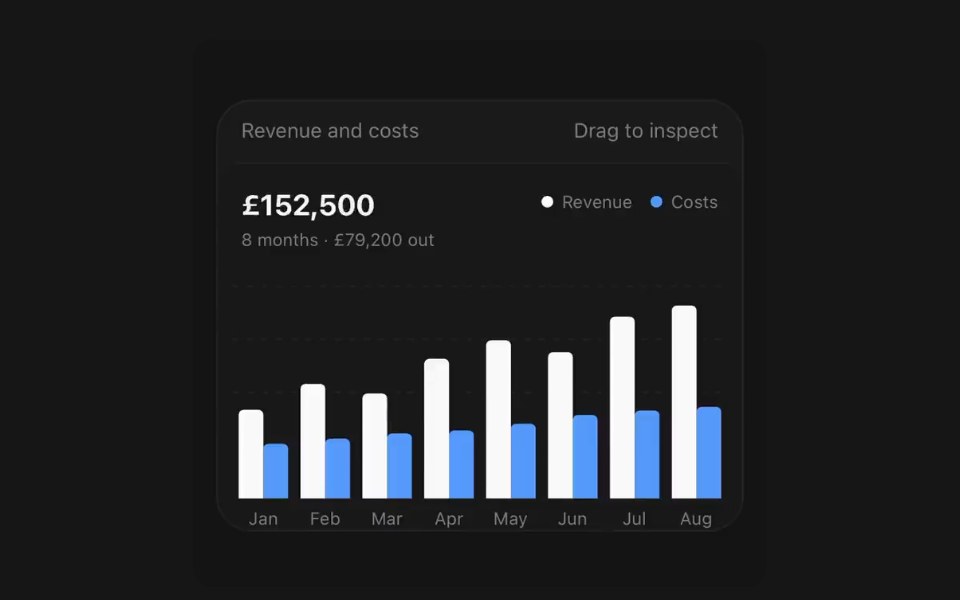 Bar ChartPanel UI · React NativeCategories compared by length, grouped or stacked.
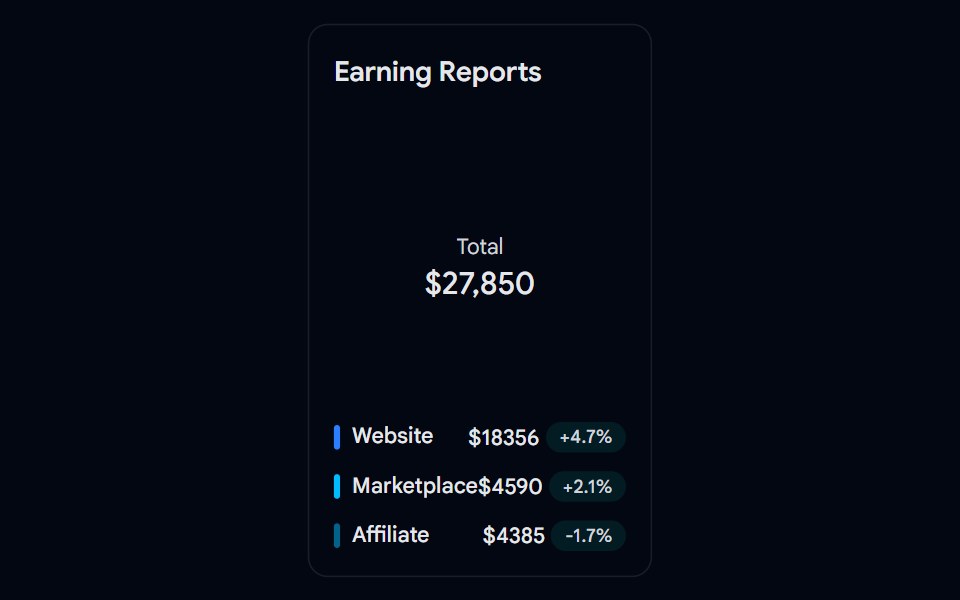 Chart 02 - Earnings Pie ChartShadcn Space · ReactA clean donut chart widget summarizing total earnings with source-wise breakdown, perfect for admin dashboards to…
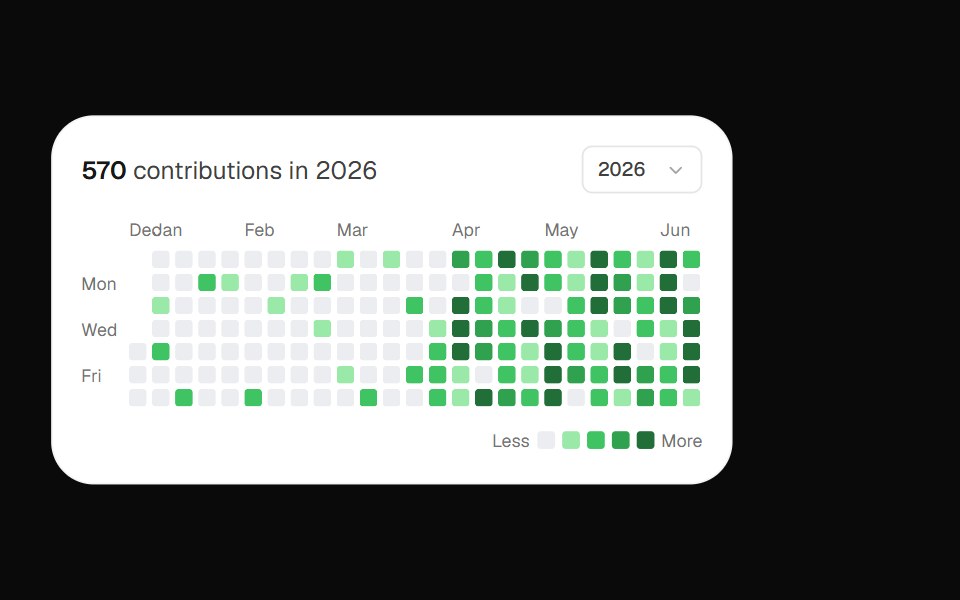 Github ContributionOpenSourceUI · React
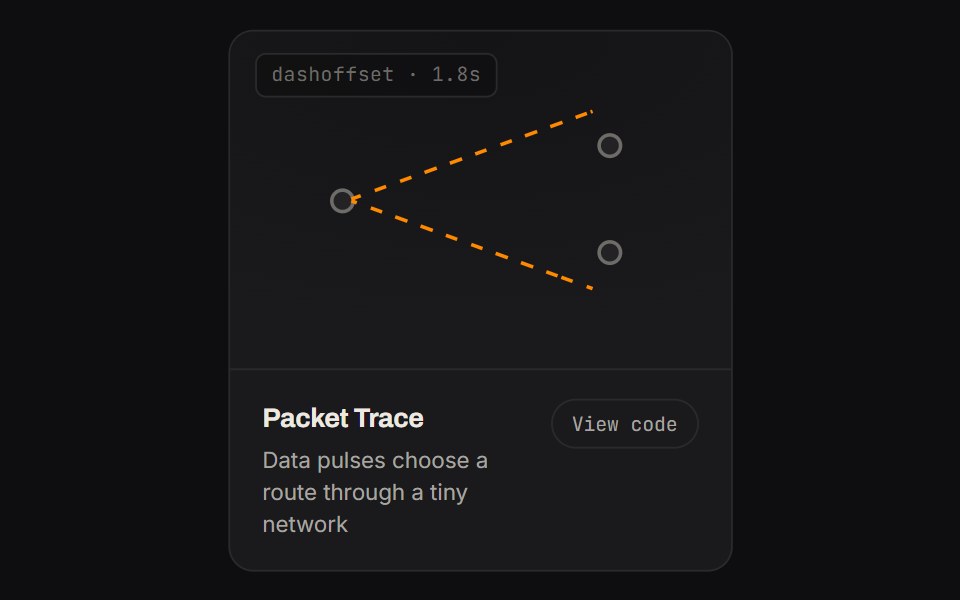 Packet TraceKinetics · HTML/CSSData pulses choose a route through a tiny network
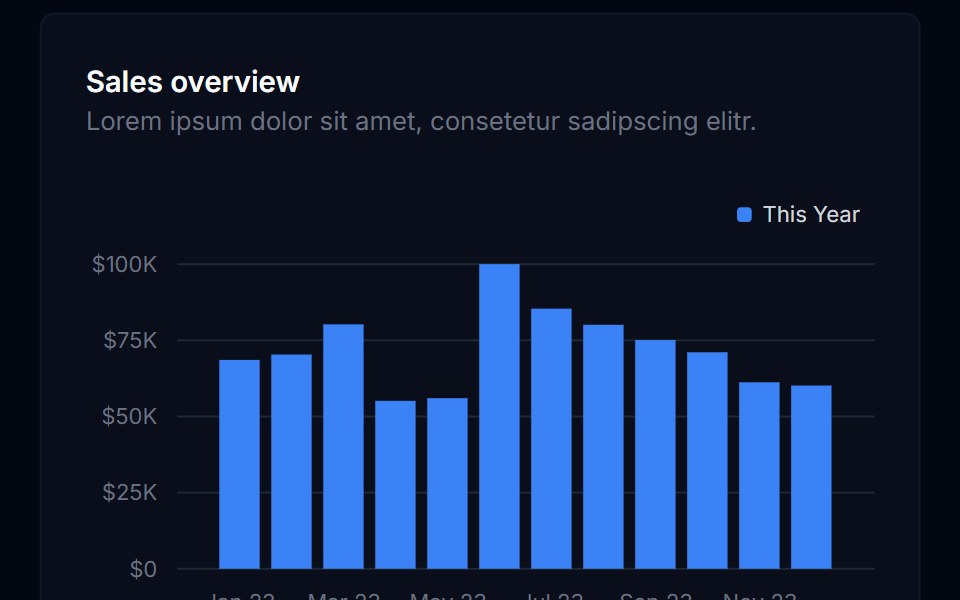 Bar ChartTremor Blocks · ReactThe base bar chart component (Recharts): vertical or horizontal bars, grouped or stacked, legend and tooltip…
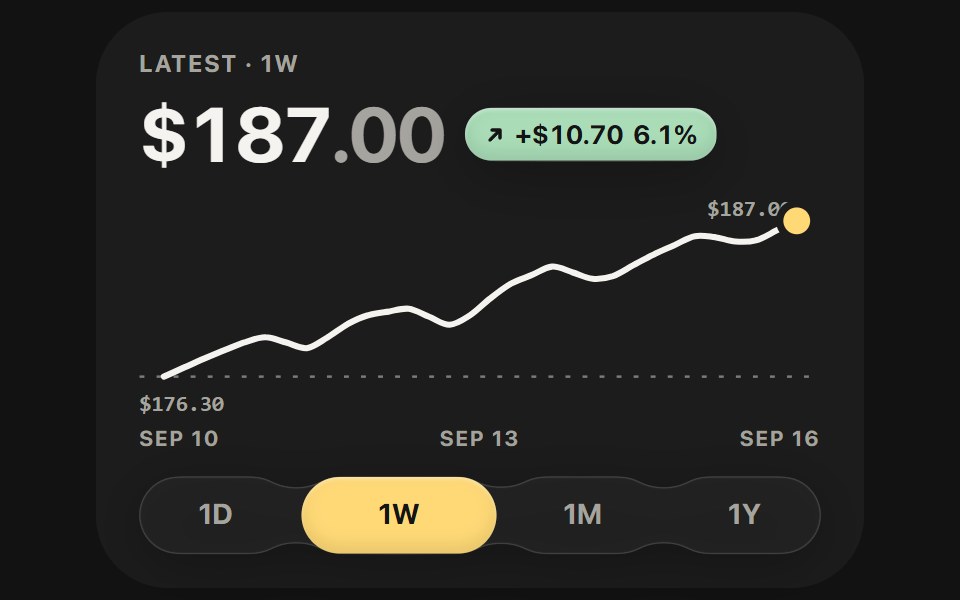 Scrub ChartSwiftPieces · SwiftUIA line or bar chart you scrub under a glass flag, hold to select a range, and switch with a glass picker that morphs…
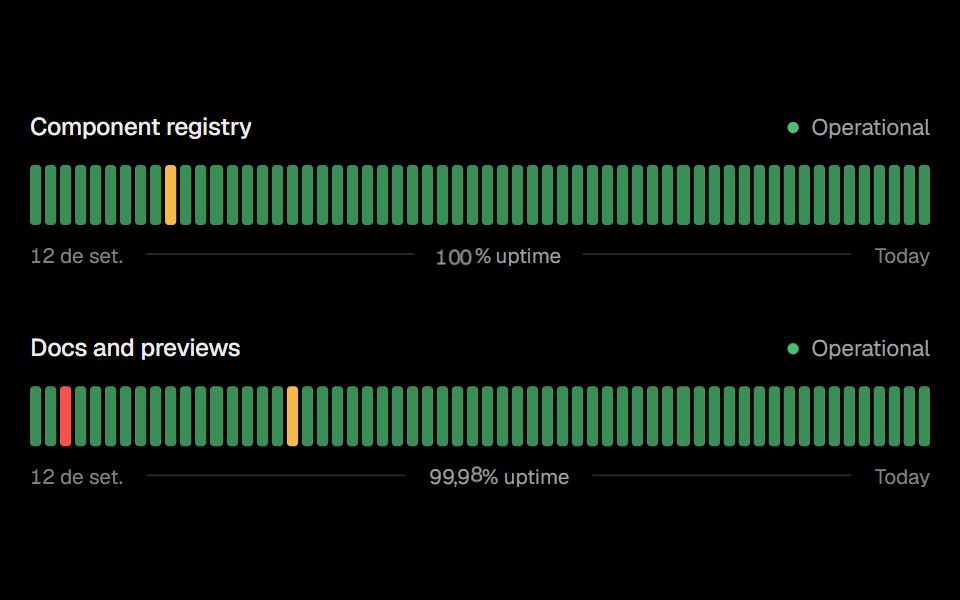 Status BarsObsidianUI · React
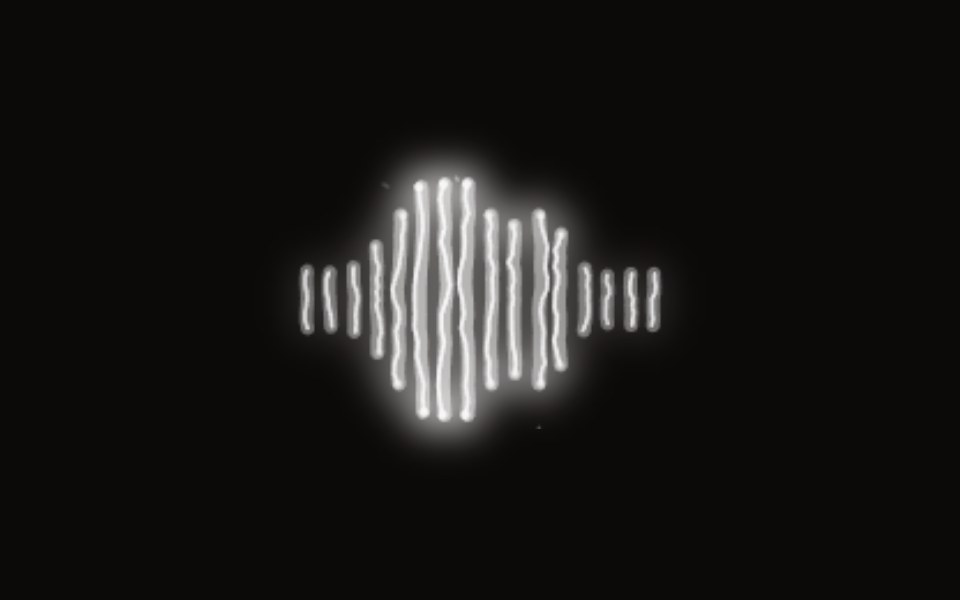 Electric Bar Visualizeraudiocn · ReactFrequency-band bars drawn as crackling filaments, with arcs between loud neighbours and sparks on sudden rises. Takes…
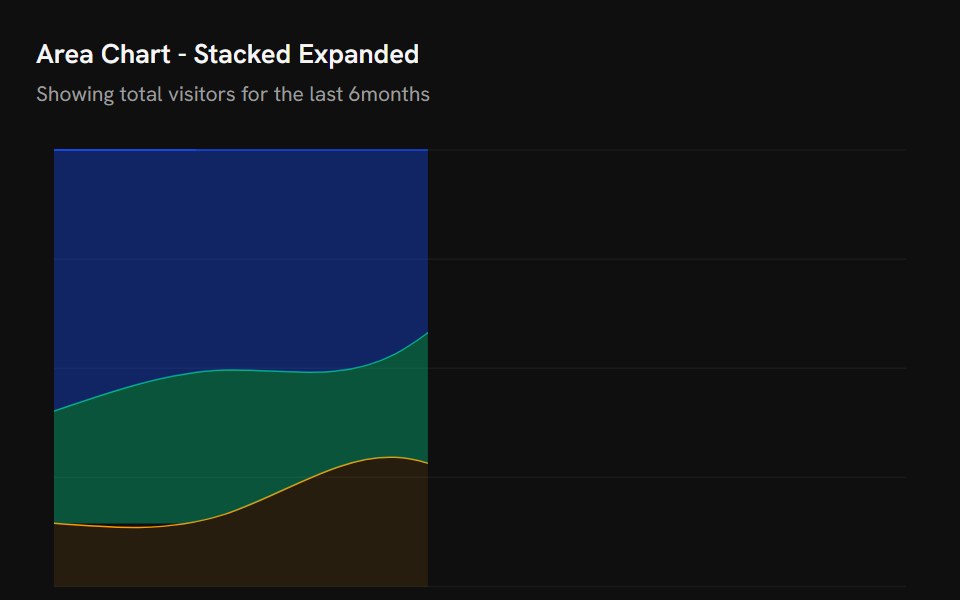 Chart Area Stacked ExpandShark UI · ReactStacked area chart example normalised to 100%, showing each series as a share of the total.
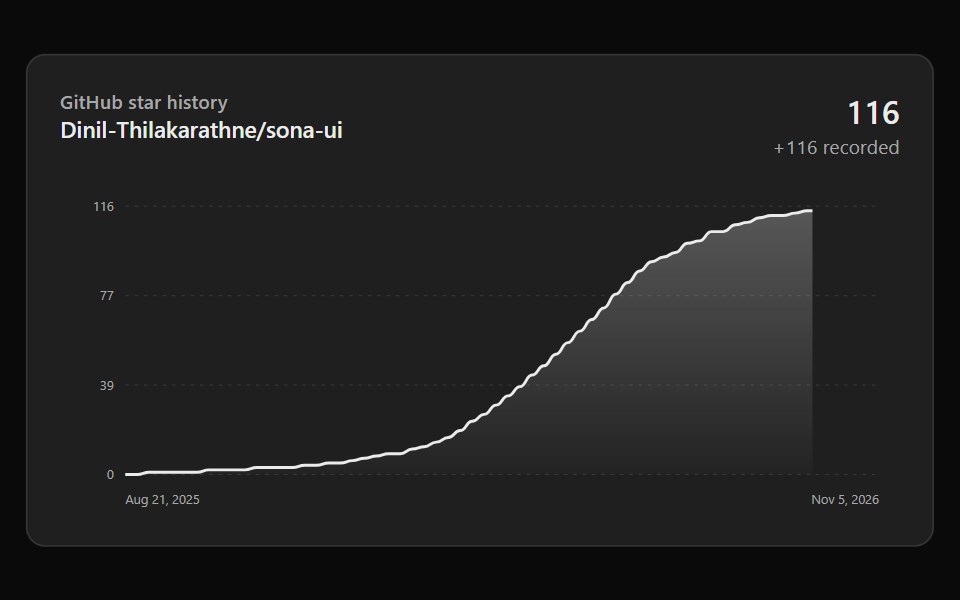 Github Star HistorySona UI · React
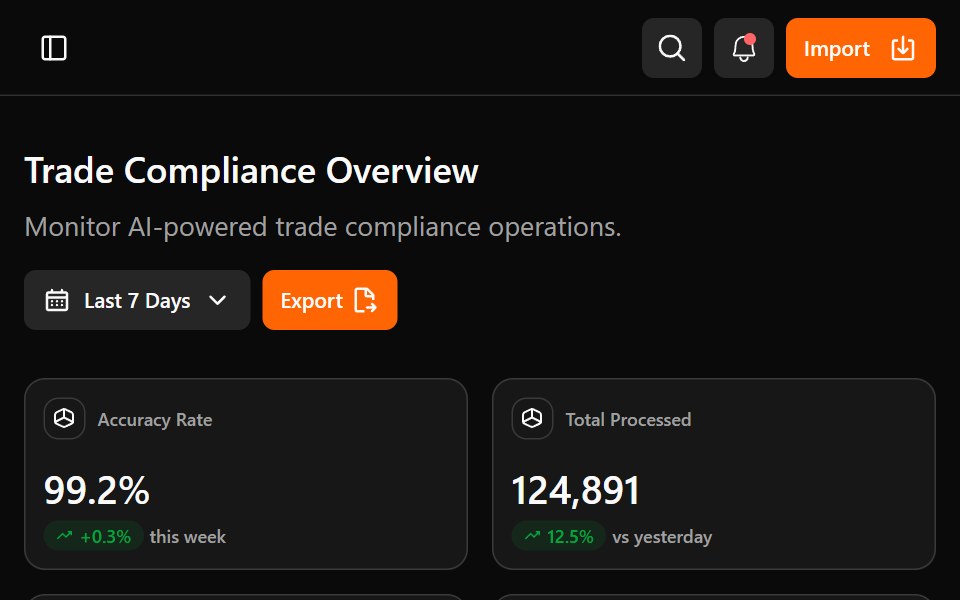 Astrix DashboardWatermelon UI · ReactA trade compliance workspace with AI classification metrics, a live pipeline, HS code stream review, and light and…
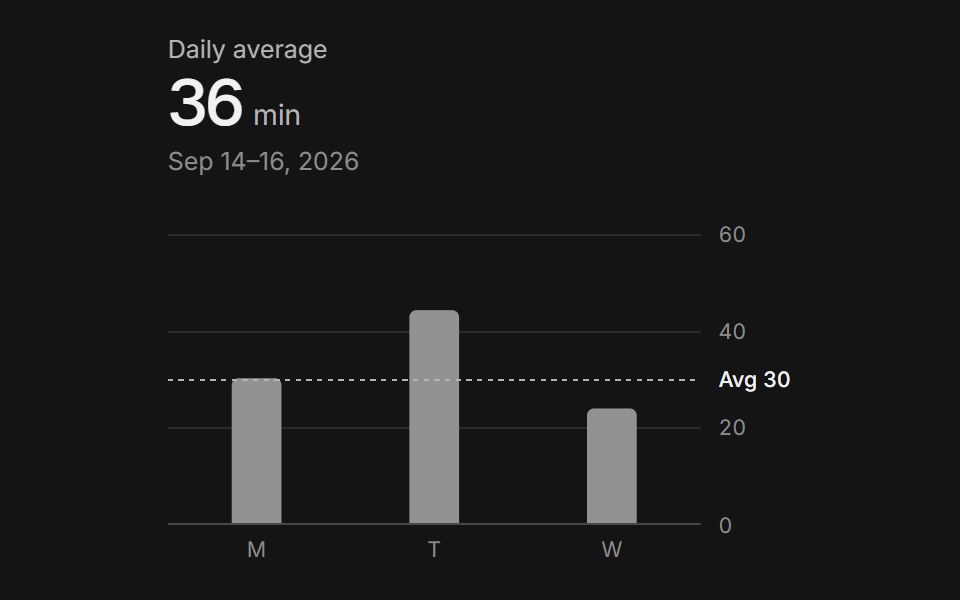 Bar chartArc Library · ReactCompare one measure across days and scrub any bar for its value.
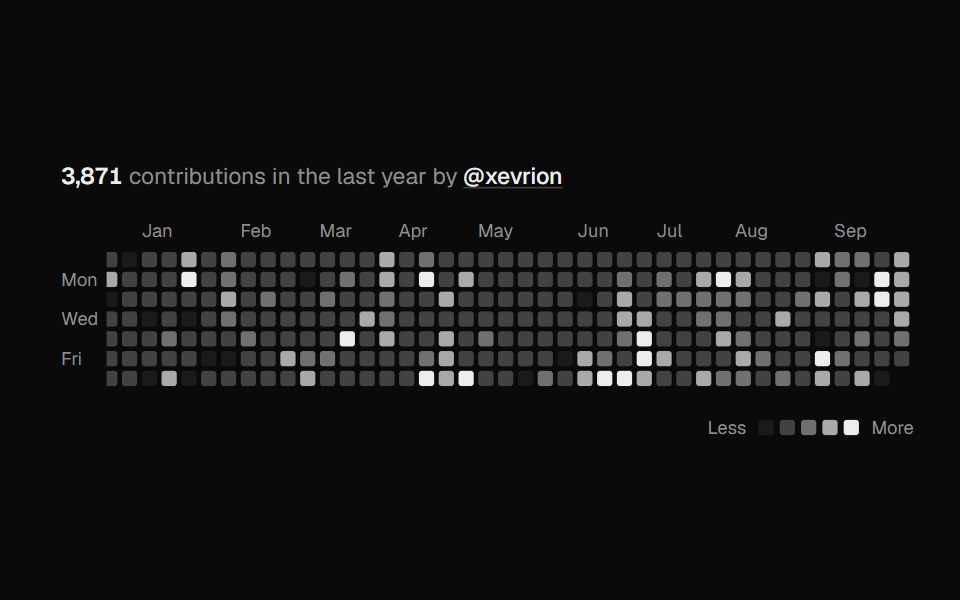 Contribution HeatmapUI Lab · ReactA year of activity at a glance, sweeping in week by week.
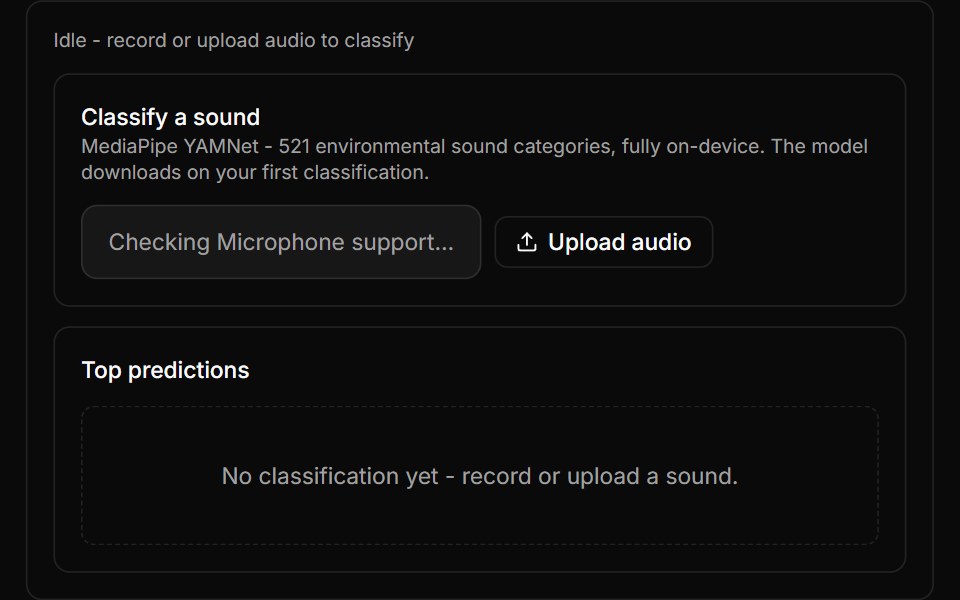 Audio Classifier BlockLocalMode · ReactMediaPipe YAMNet (521 environmental sound categories) top-8 classification of a microphone recording (MediaRecorder…
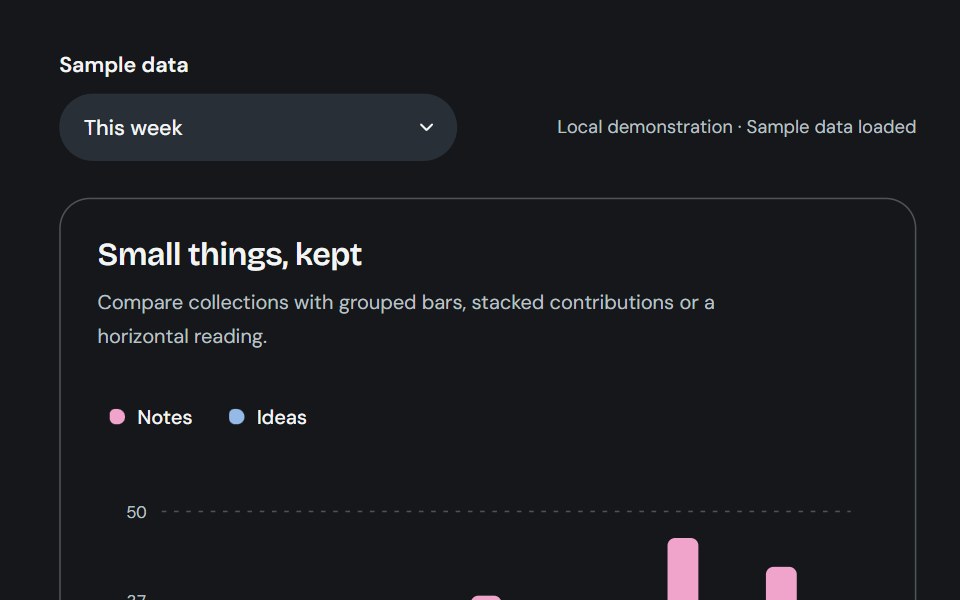 Bar chartCojeev UI · ReactCompare series with grouped, stacked or horizontal bars and a shared interactive tooltip.
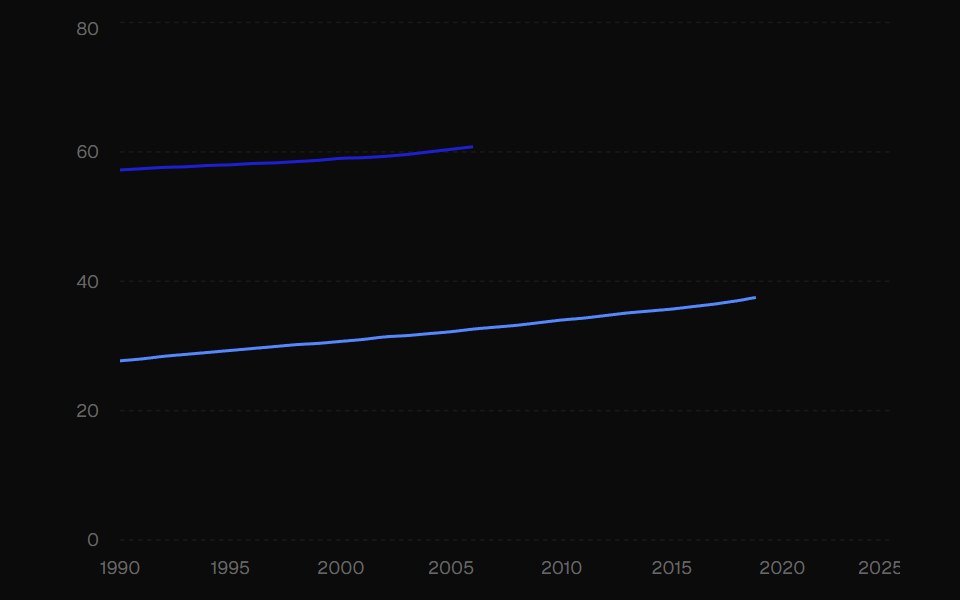 ChartROI UI · ReactComposable chart components for building any type of data visualization with Recharts primitives.
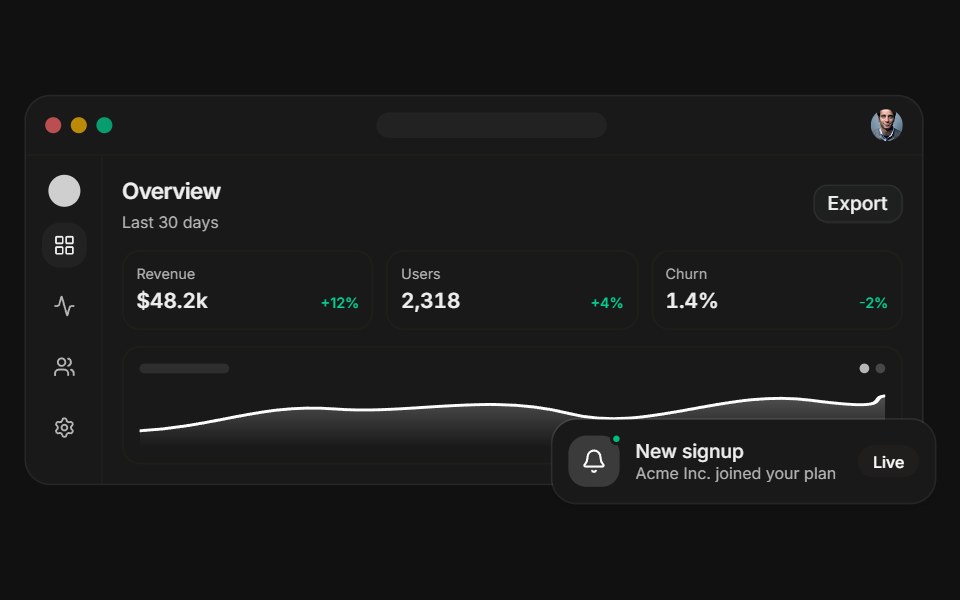 Dashboard previewFLX UI · ReactA layered app dashboard with a floating notification.
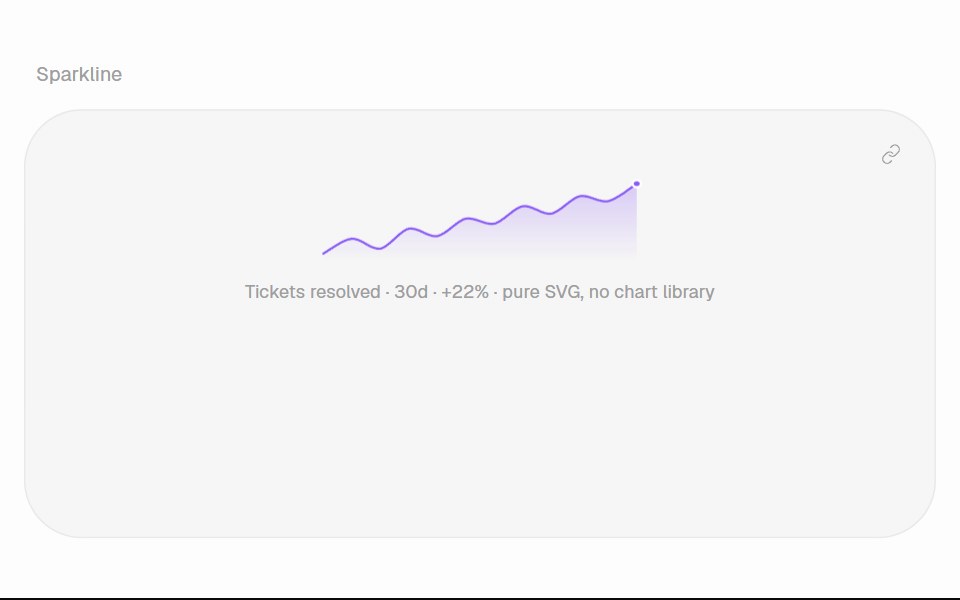 SparklineHalaska UI · React
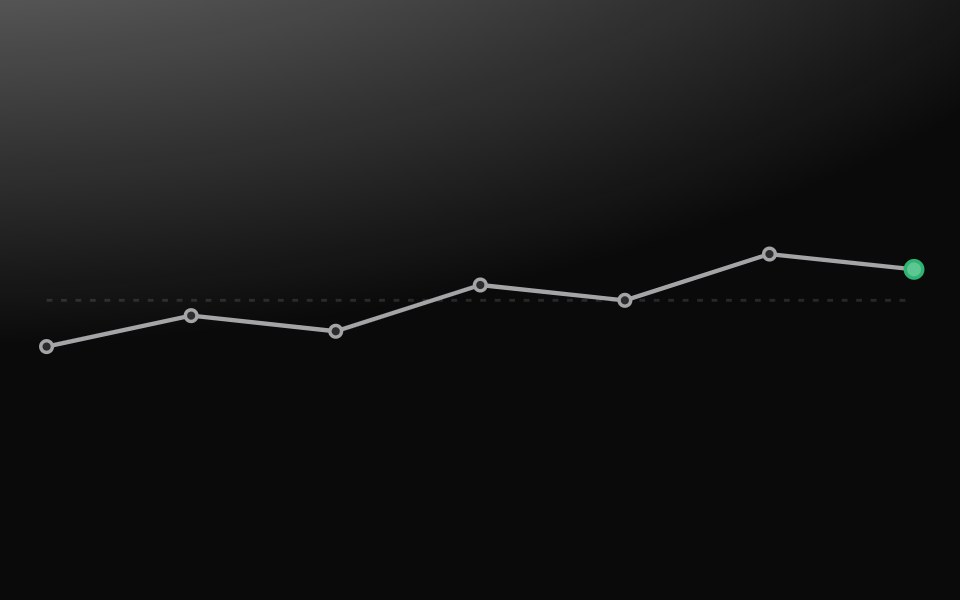 SparklineMetal UI · React + SwiftUIA small series plot: a line with gaps, dots, the last point emphasised, a dashed baseline at the average.
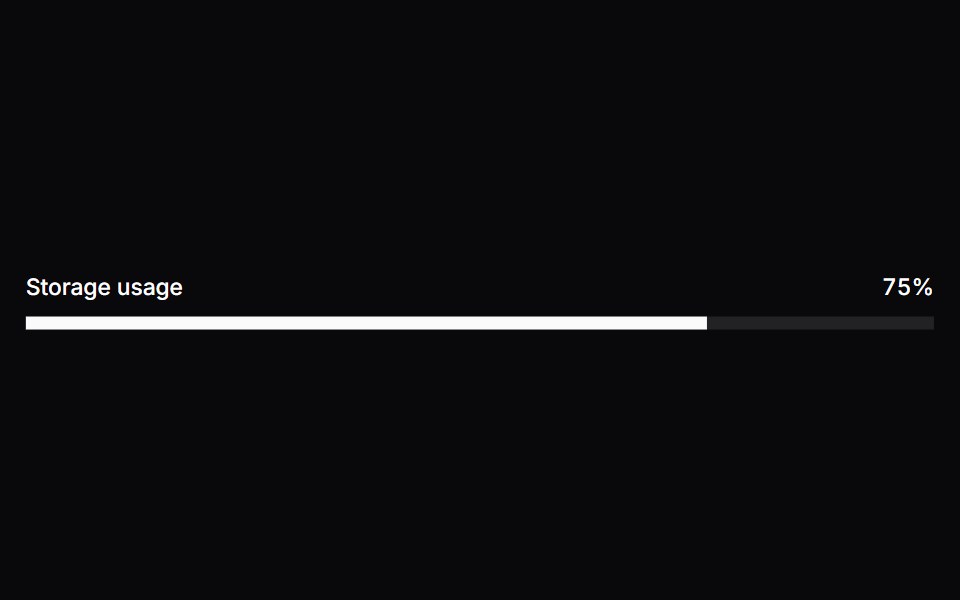 MeterSpaceUI · ReactDisplays a visual gauge bar showing a quantity within a known range, such as battery level, disk capacity, or password…
 Base ChartReScript shadcn · ReScript
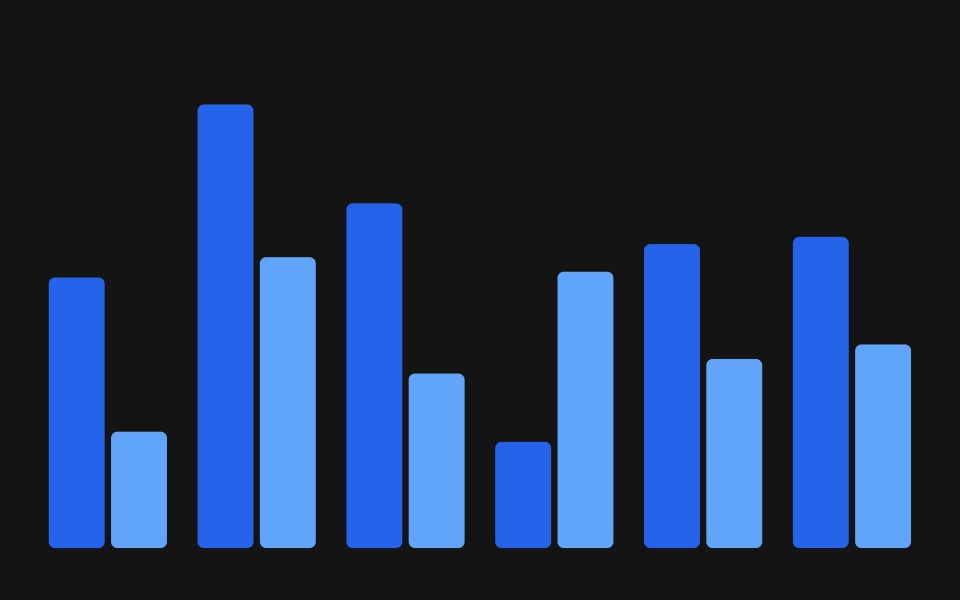 ChartD2Studio UI · ReactBeautiful charts built using Recharts, themed from CSS variables.
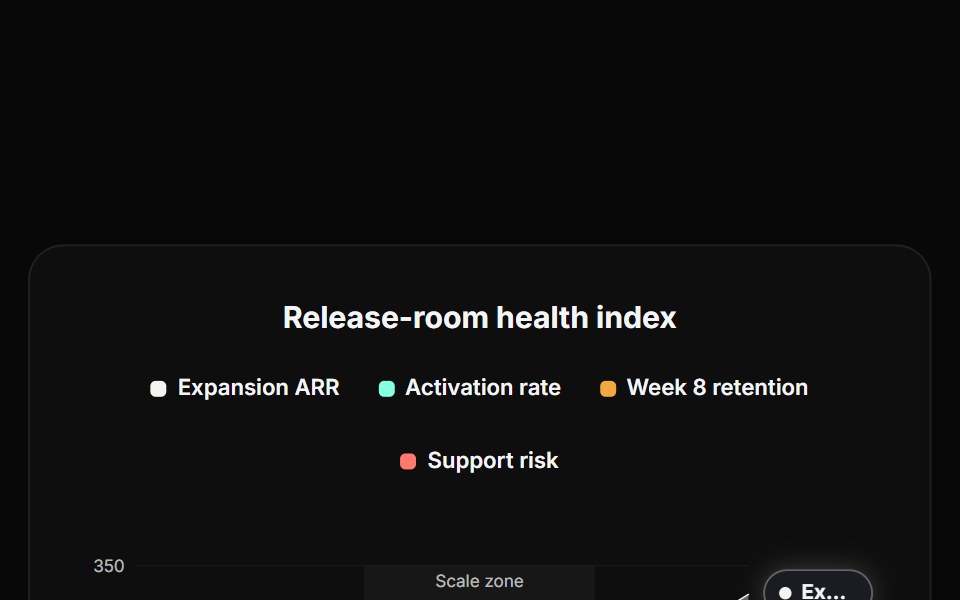 Line ChartReactFrame · ReactA multi-series line/area chart, smooth Catmull-Rom curves, a highlighted zone band, a reference line, endpoint value…
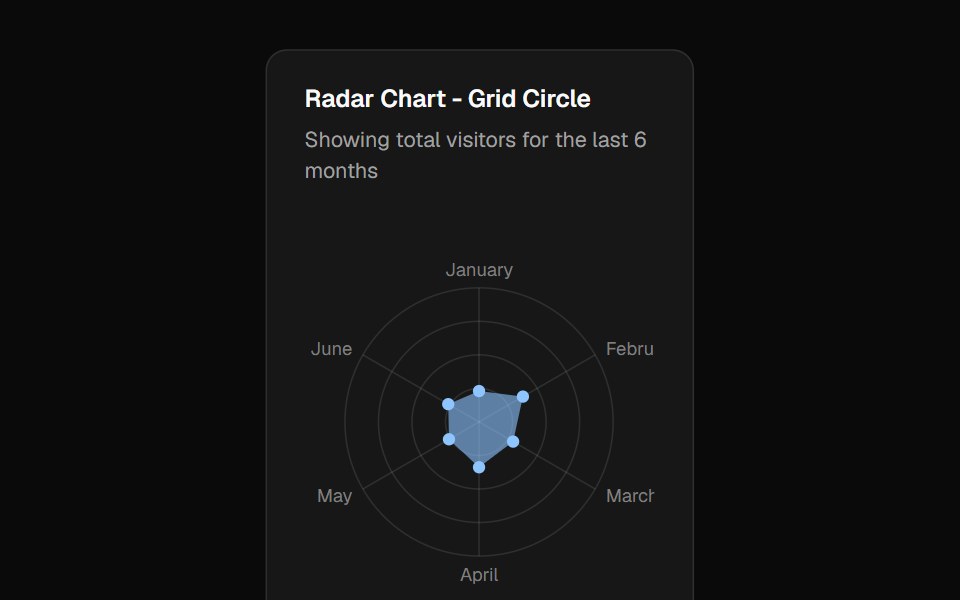 Chart Radar Grid Circleshadcn/ui · ReactRadar chart example with a circular polar grid.
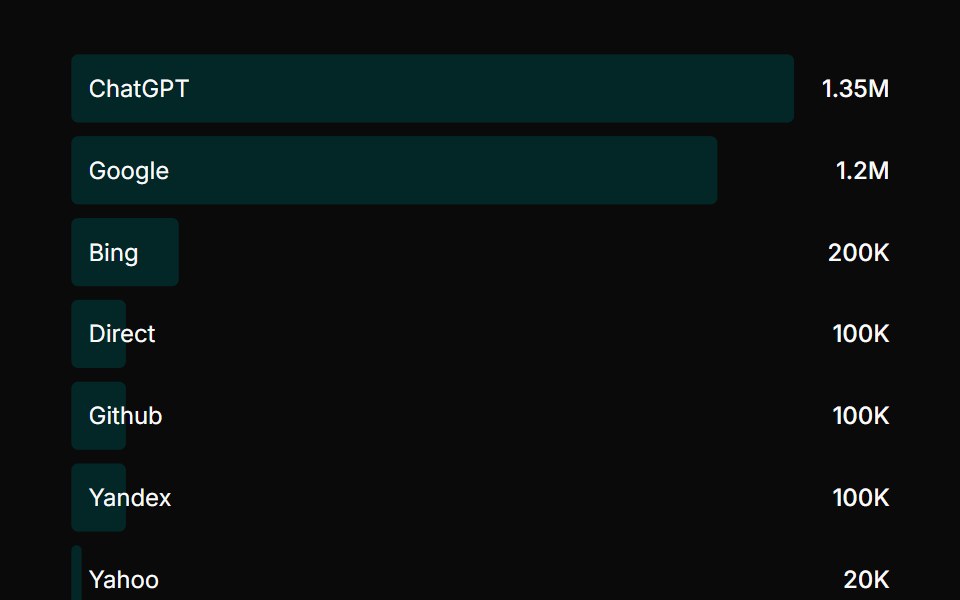 Bar ListChakra UI · ReactUsed to display categorical data with horizontal bars, showing comparisons between different categories or items
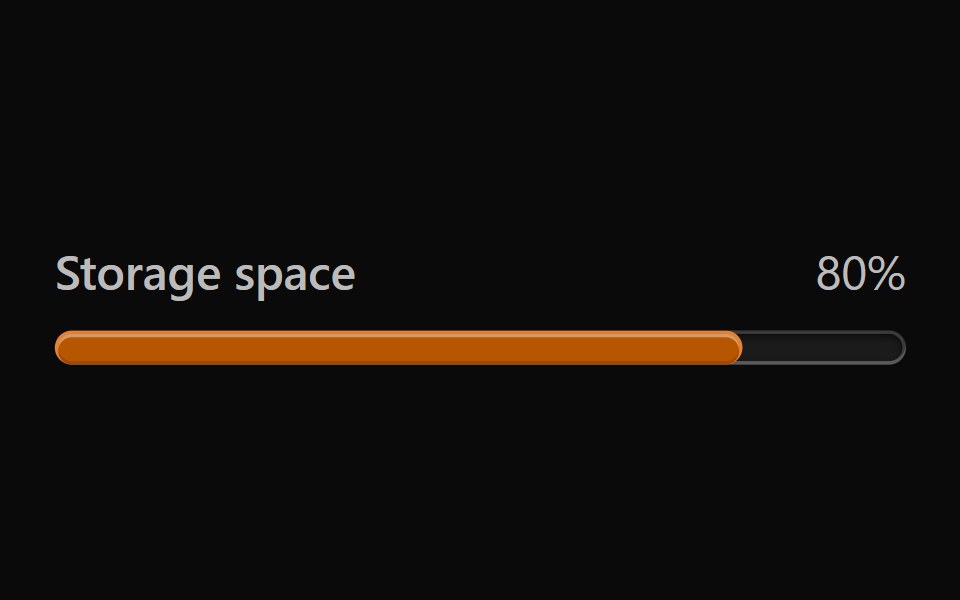 Vanilla MeterReact Spectrum · React
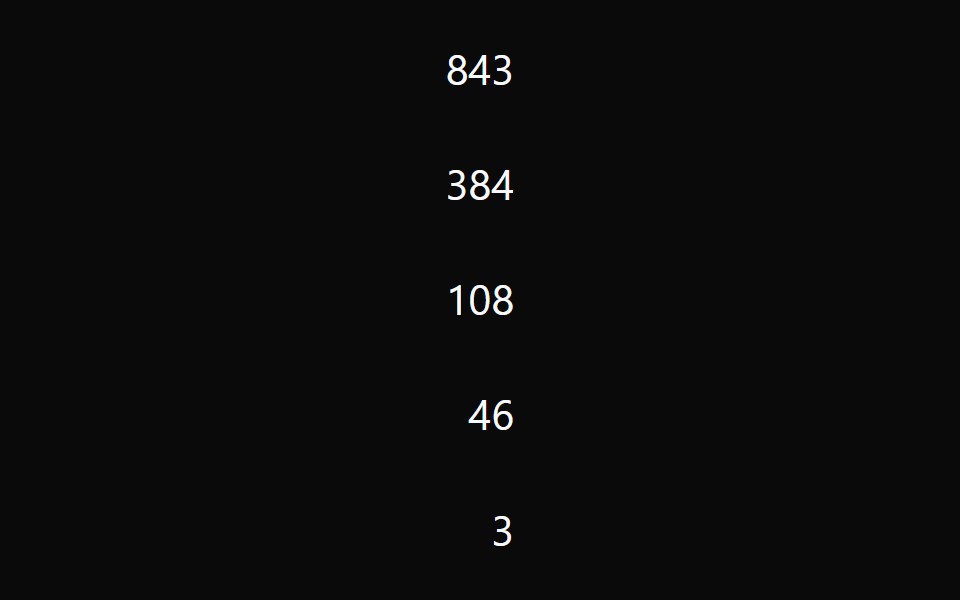 Bar ListTremor · React
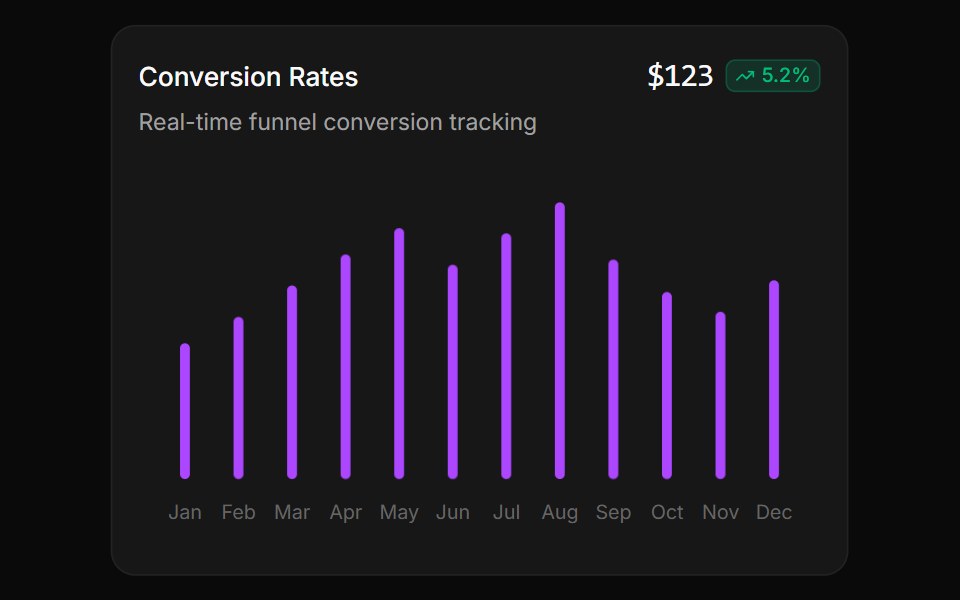 Animated monochrome bar chartReUI · ReactAnimated monochrome bar chart
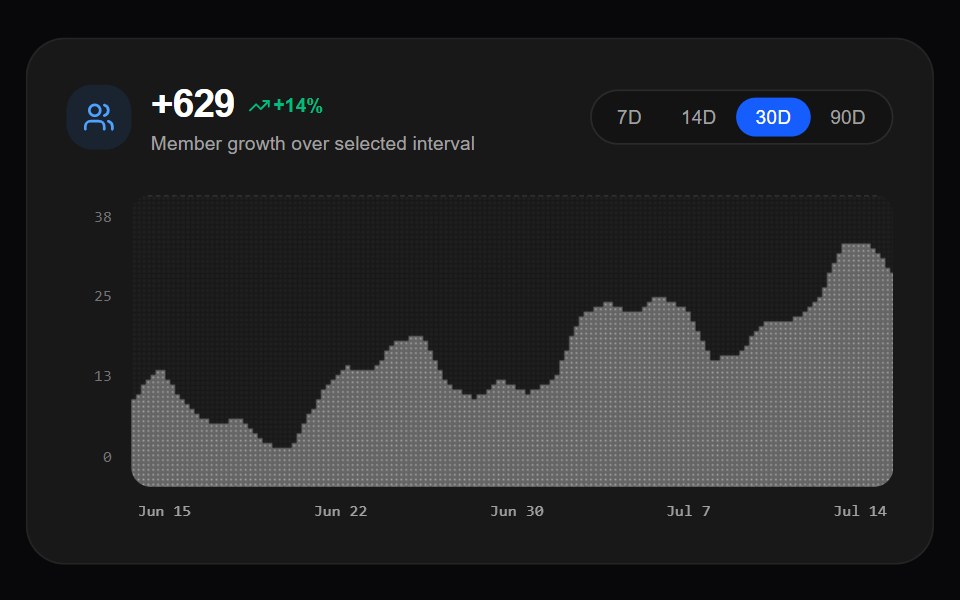 Dither Growth ChartAmicro Micro Transitions · React60fps canvas growth line chart with pixel dither fill matrix.
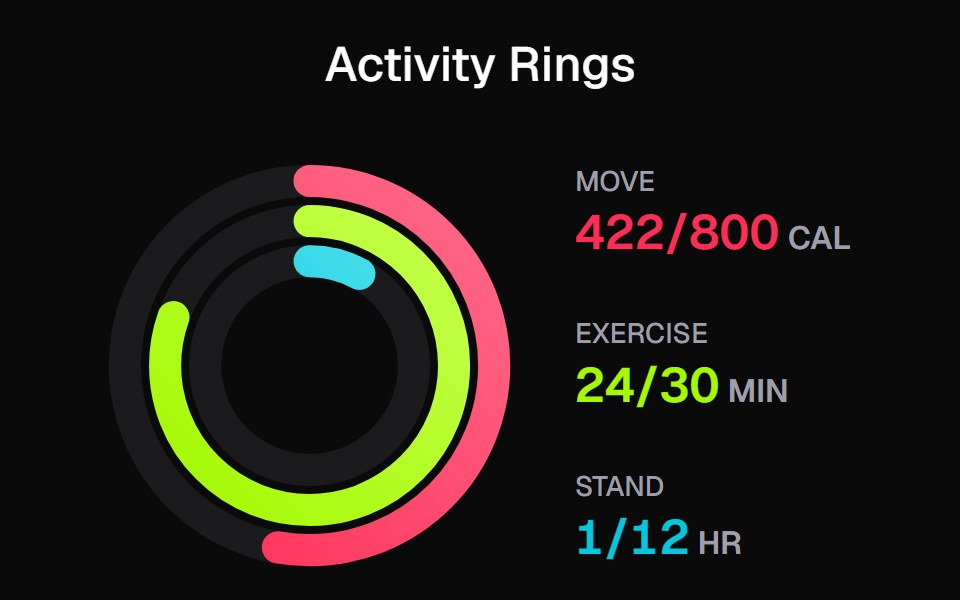 Apple Activity CardKokonut UI · ReactActivity rings that draw with a count-up, lap past 100% with a shadowed end cap and dim to focus, built with React and…
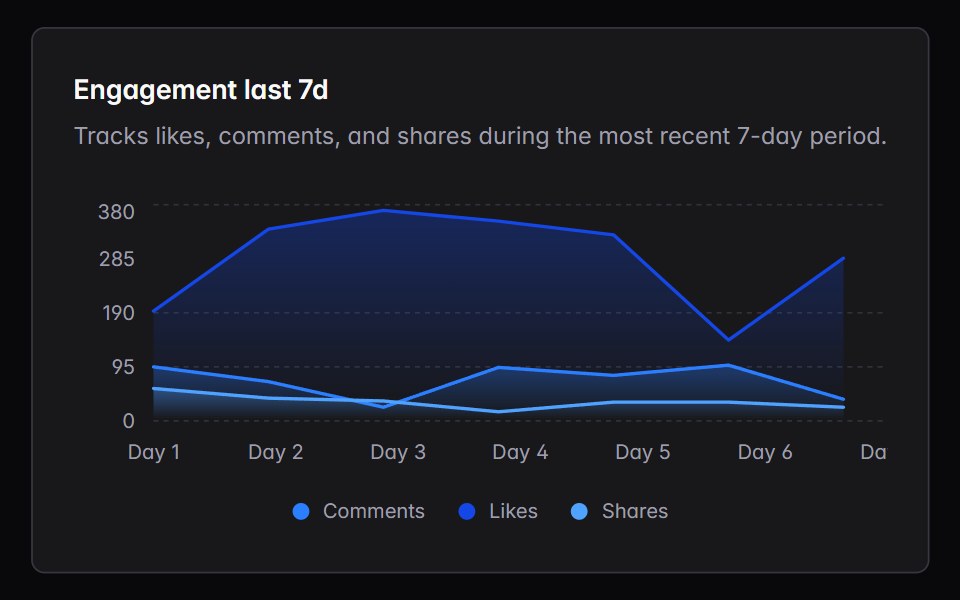 chartIntent UI · Reactchart
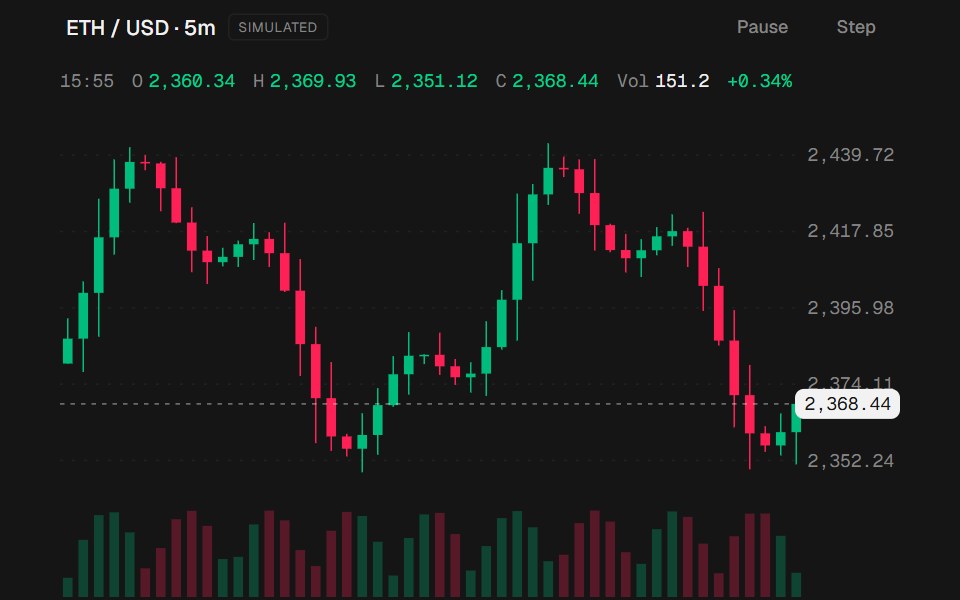 Candlestick ChartbeUI · ReactLive OHLC candles with volume, a last-price line, and a crosshair readout.
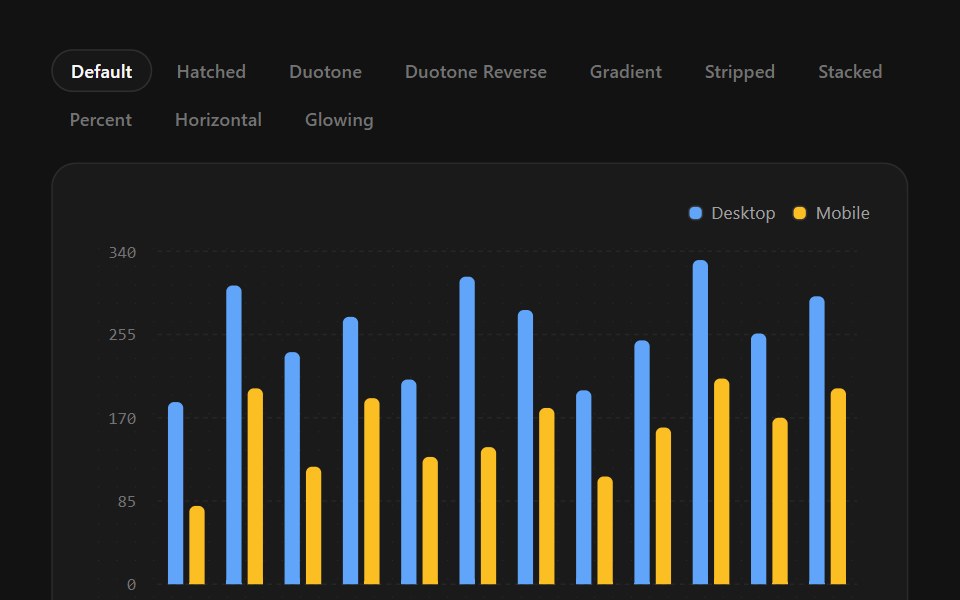 Bar ChartSpectrum UI · ReactVertical and horizontal bars with hatch, duotone, gradient, stripe, stack, and glow fills.
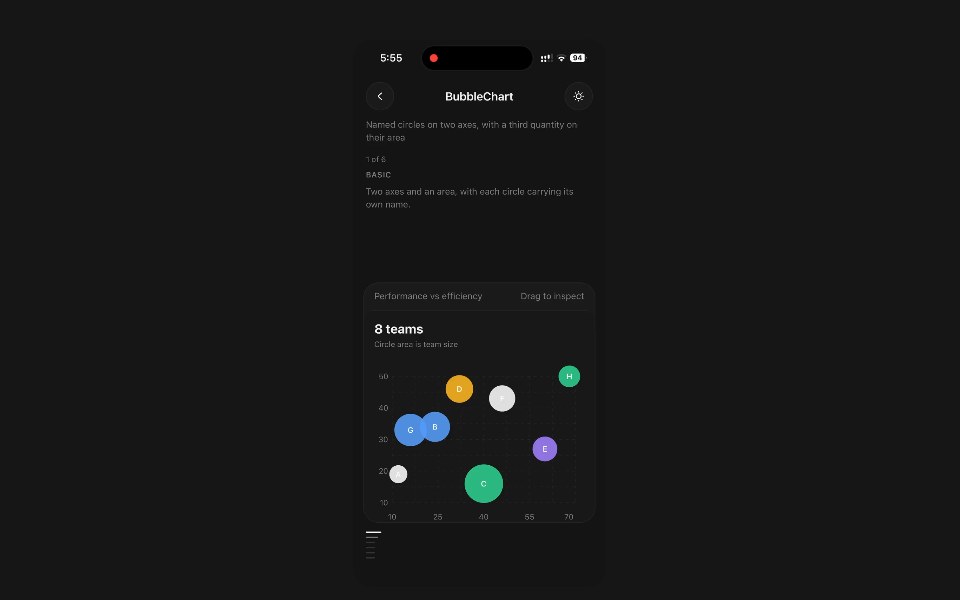 Bubble ChartPanel UI · React NativeNamed circles on two axes, with a third quantity on their area.
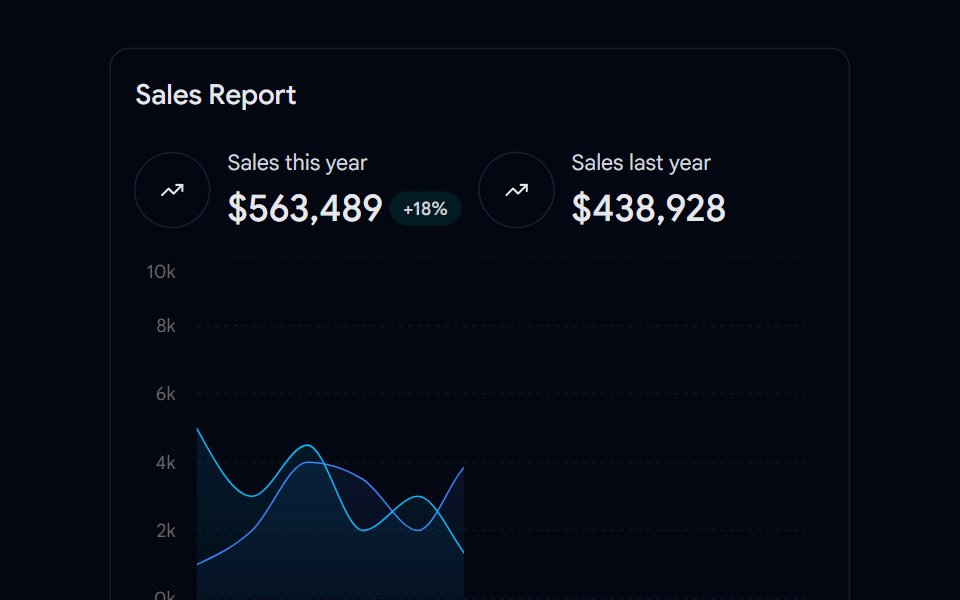 Chart 03 - Yearly Sales ComparisonShadcn Space · ReactA smooth line chart comparing this year versus last year sales with summary stats, ideal for dashboards to visualize…
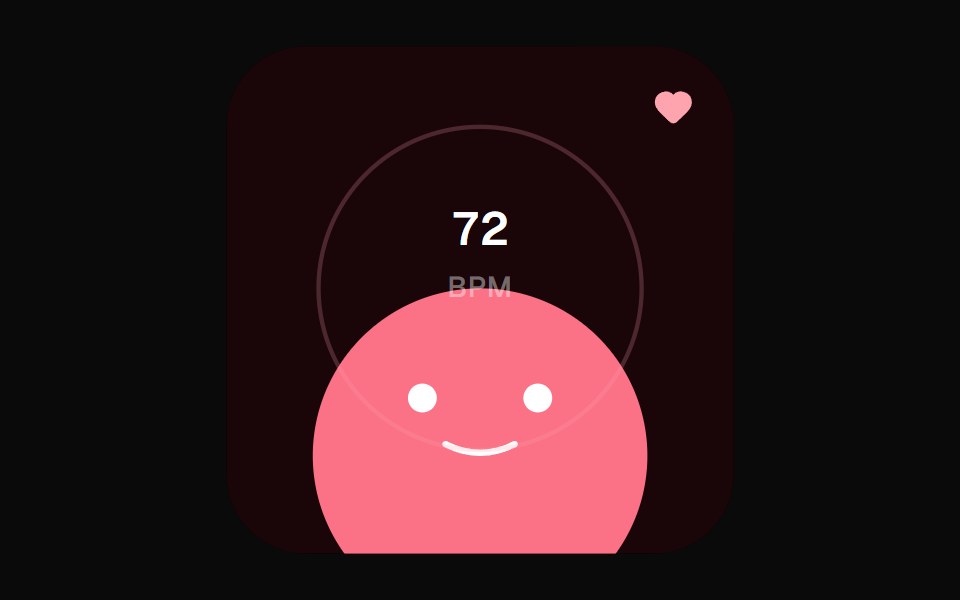 Heart Rate WidgetOpenSourceUI · React
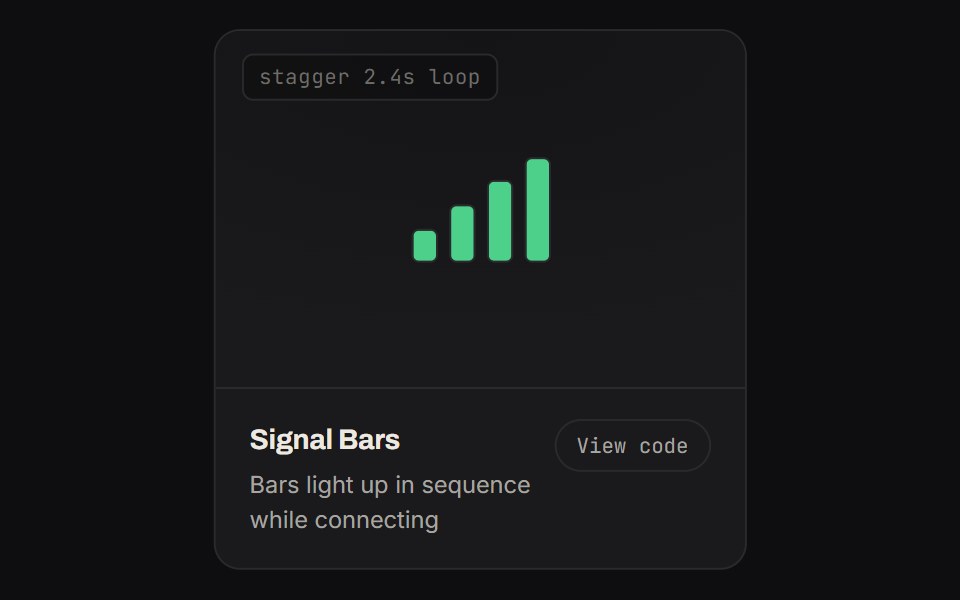 Signal BarsKinetics · HTML/CSSBars light up in sequence while connecting
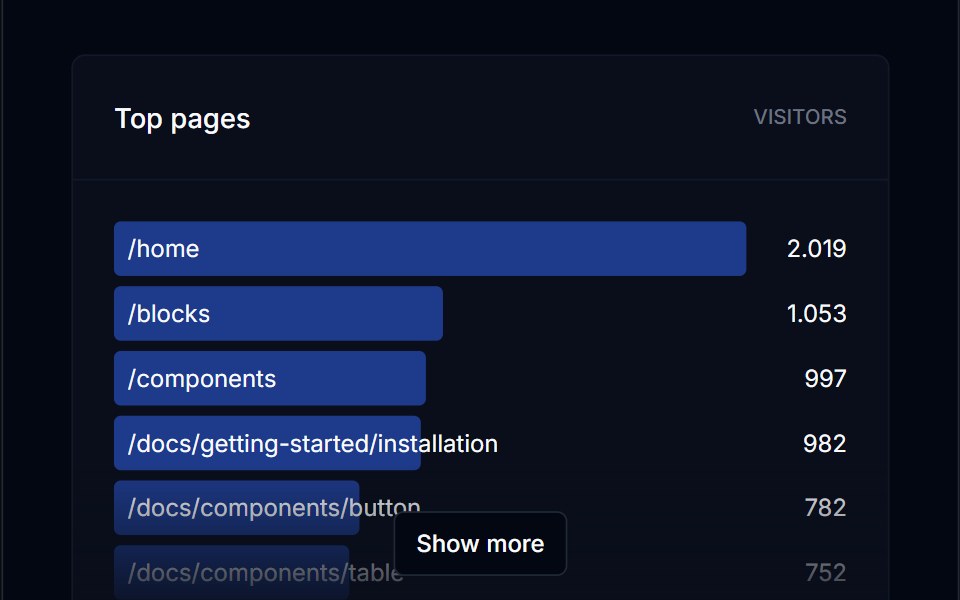 Bar ListTremor Blocks · ReactRanked list of horizontal bars, each with a name and a value, sorted ascending or descending.
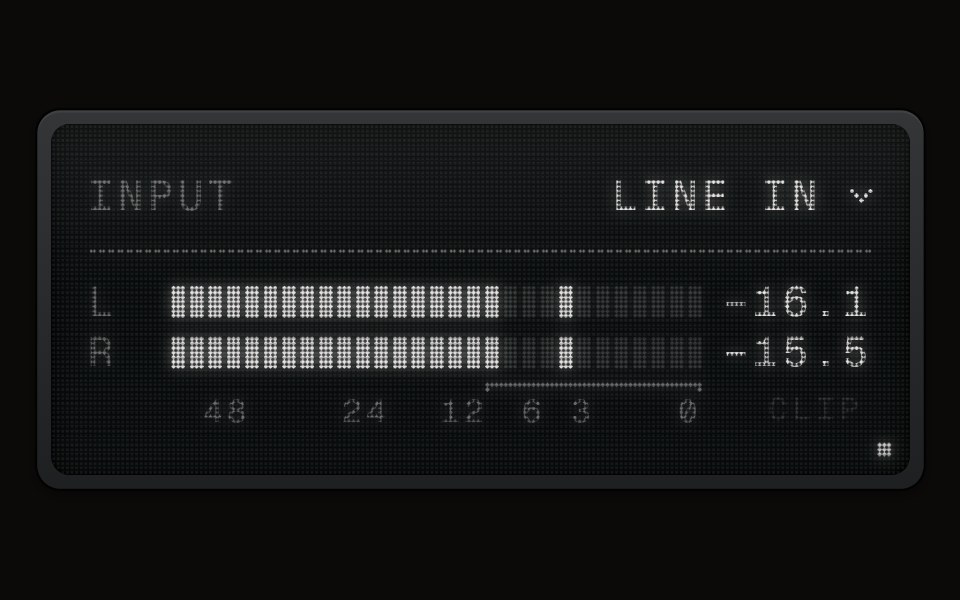 LCD Meteraudiocn · ReactA recorder-style level meter on an LCD Display's screen: block segments in the display's ink that light whole, a held…
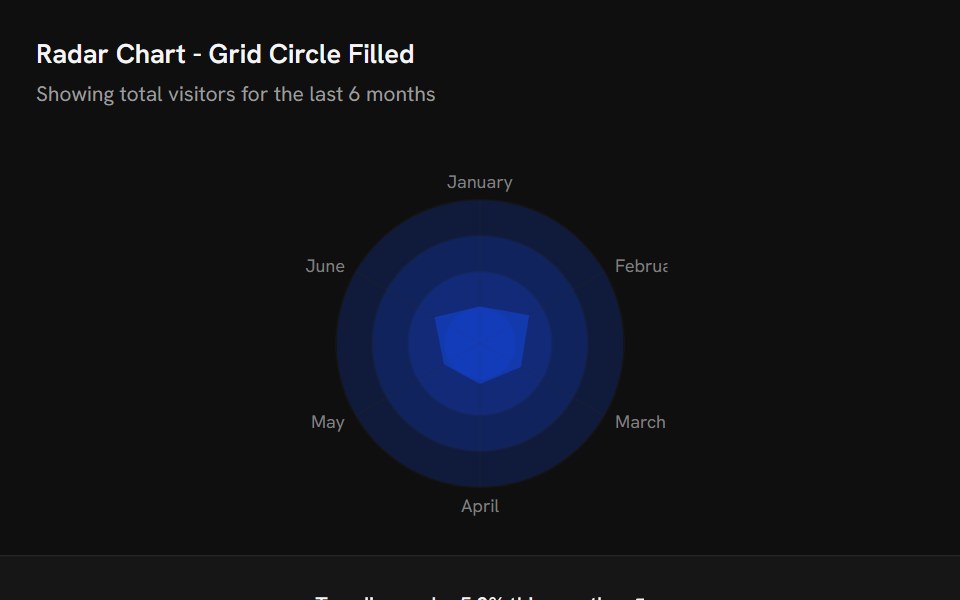 Chart Radar Grid Circle FillShark UI · ReactRadar chart example with a filled circular polar grid.
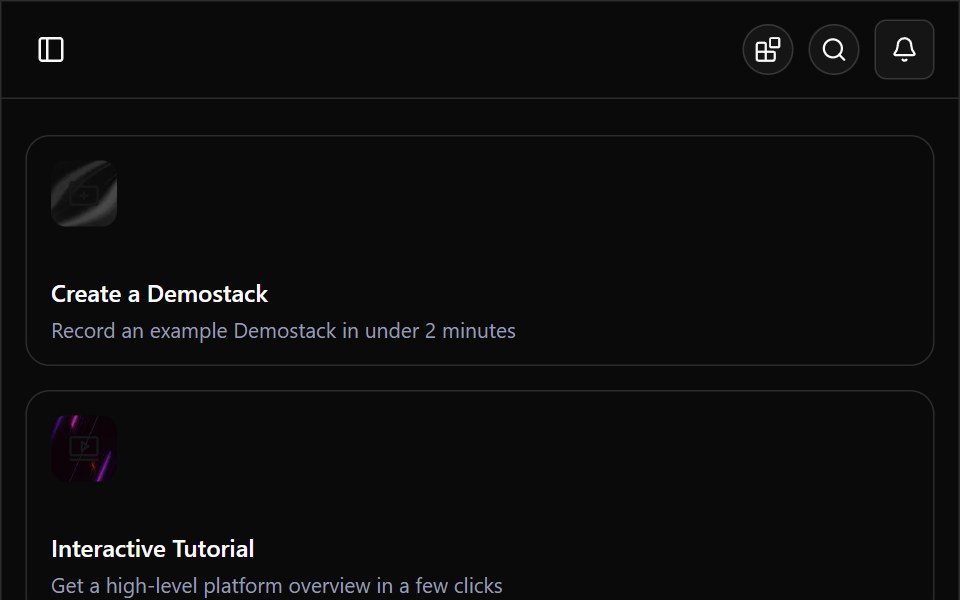 Demostack DashboardWatermelon UI · ReactA responsive product-demo workspace with organization switching, resource discovery, team filtering, and light and…
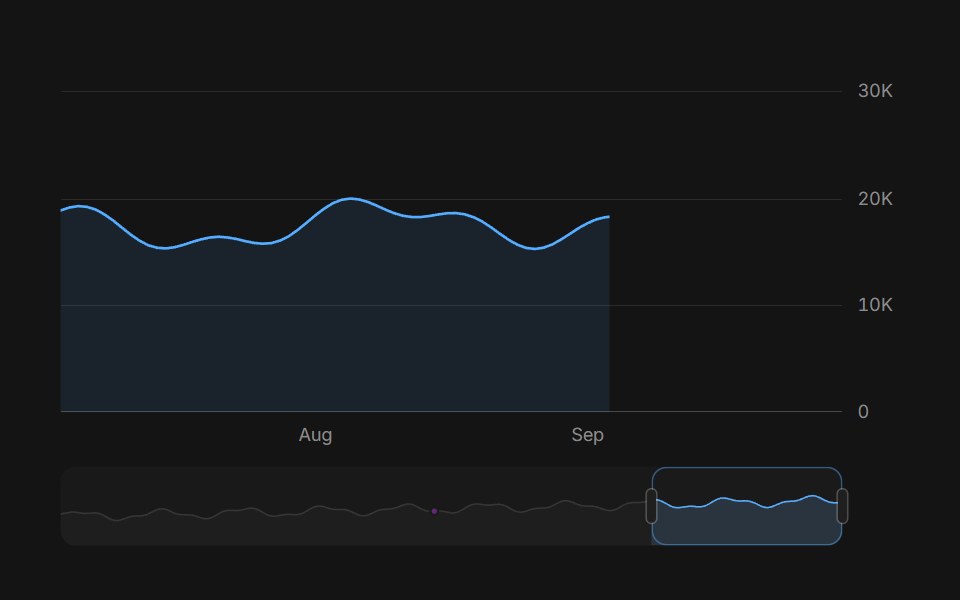 Brush chartArc Library · ReactA dense time series with an overview strip: drag a window to zoom, resize it by its handles, and read events in place.
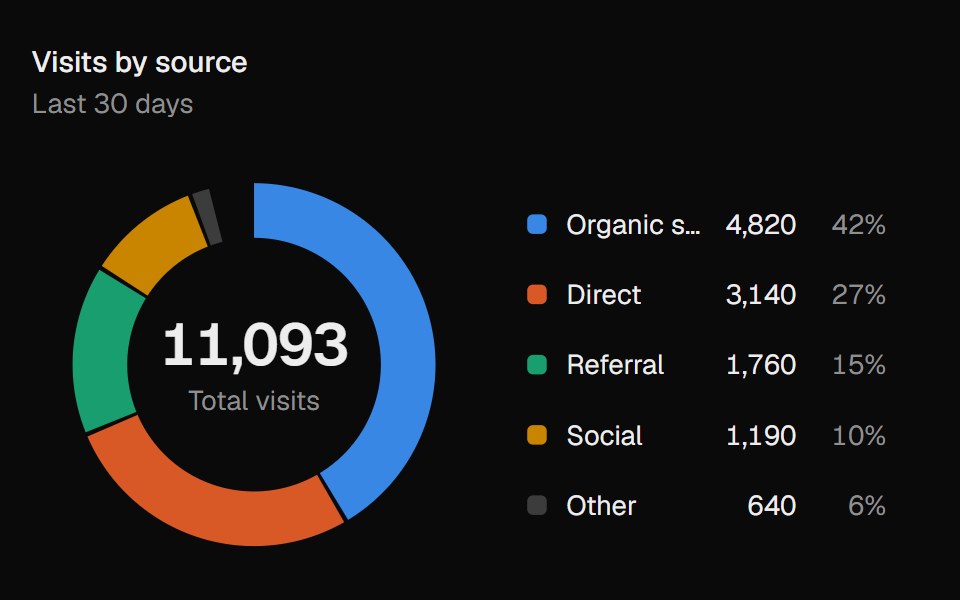 Donut ChartUI Lab · ReactDraws itself in, then lifts whichever slice you point at.
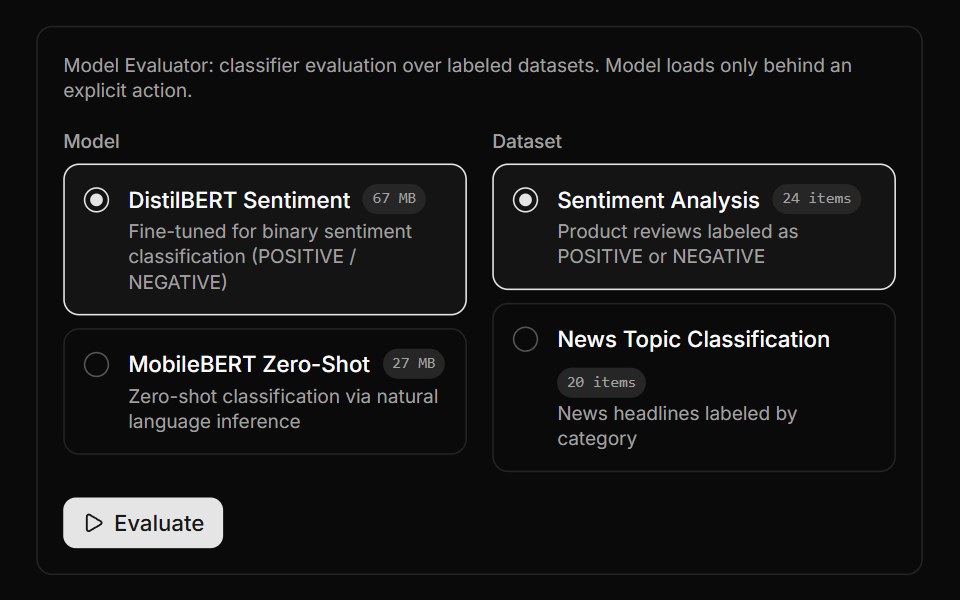 Model Evaluator BlockLocalMode · ReactEvaluate a selected classifier over a selected labeled dataset via useEvaluateModel, reporting accuracy plus macro…
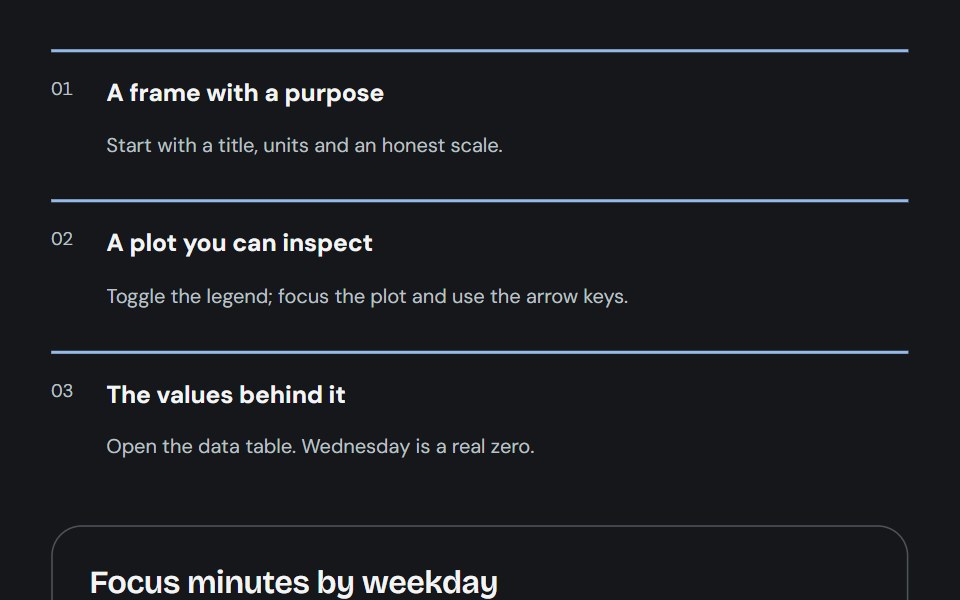 ChartCojeev UI · ReactCompose an understandable chart from a frame, labelled series, inspectable plot and accessible values.
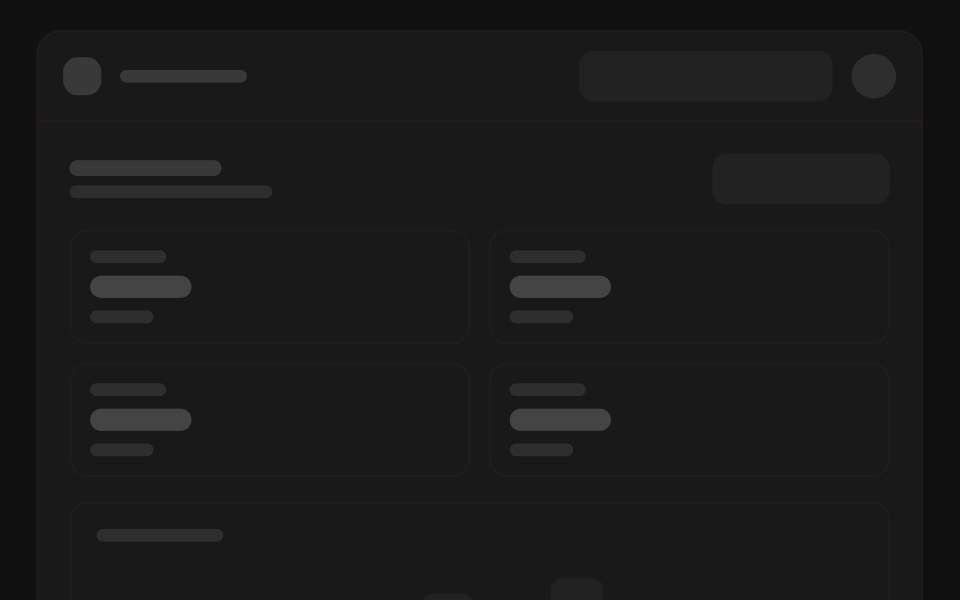 Analytics overviewFLX UI · ReactWireframe: sidebar, stat cards, chart, and a list.
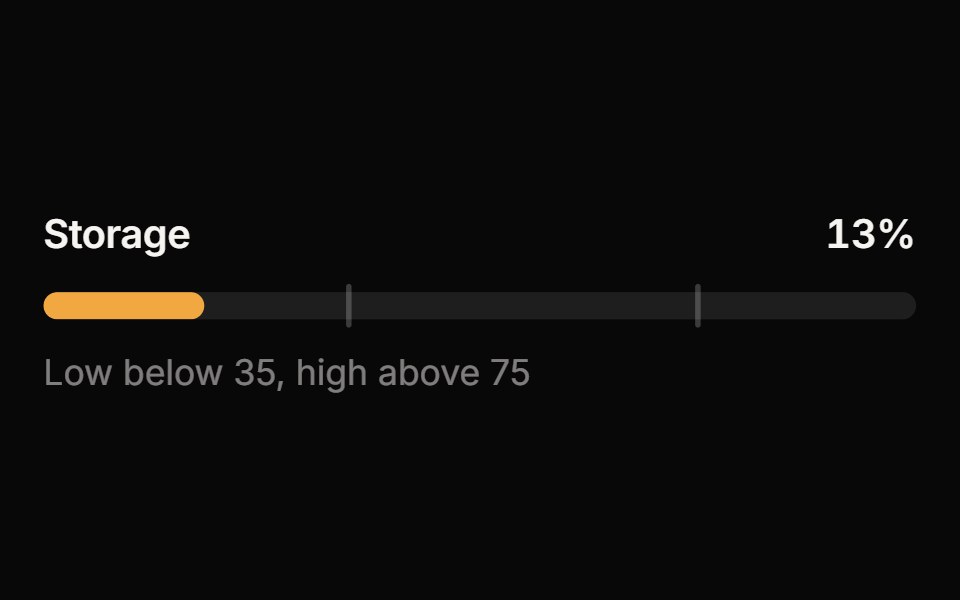 MeterReactFrame · ReactA meter for a value within a known range: bar, semicircle gauge or segmented variants with threshold zones, animated…
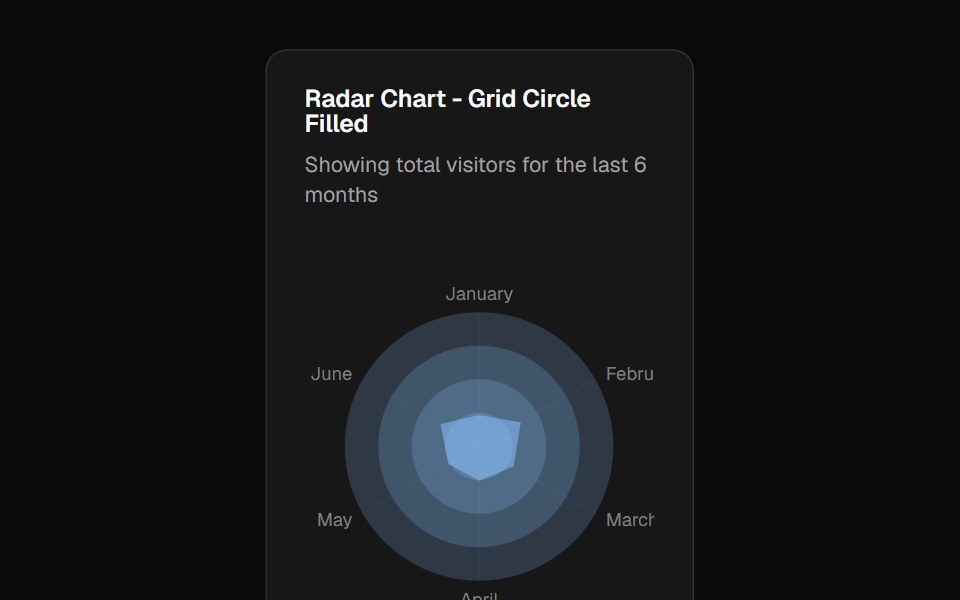 Chart Radar Grid Circle Fillshadcn/ui · ReactRadar chart example with a filled circular polar grid.
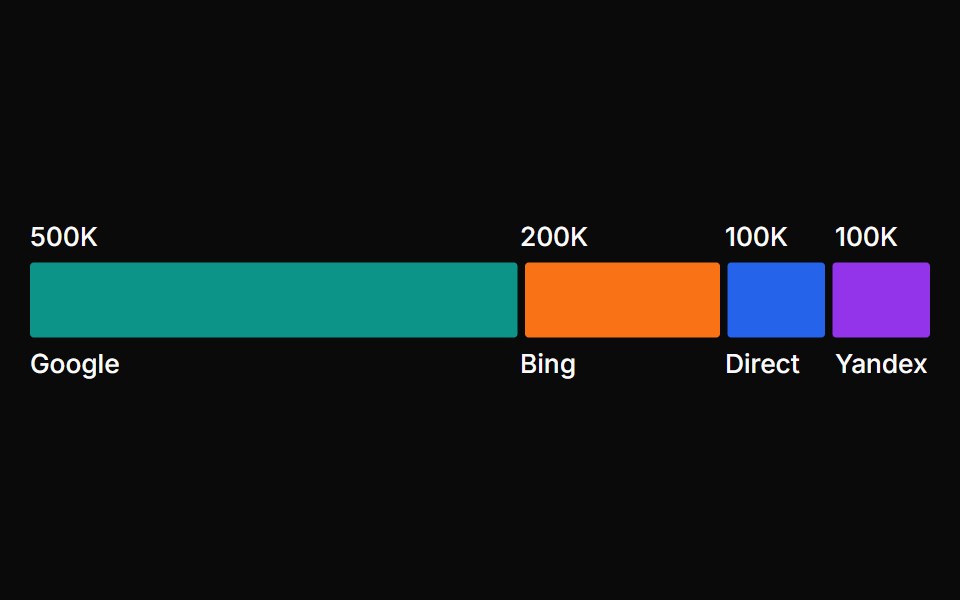 Bar SegmentChakra UI · ReactUsed to display data as segments within a horizontal bar, showing proportions and part-to-whole relationships between…
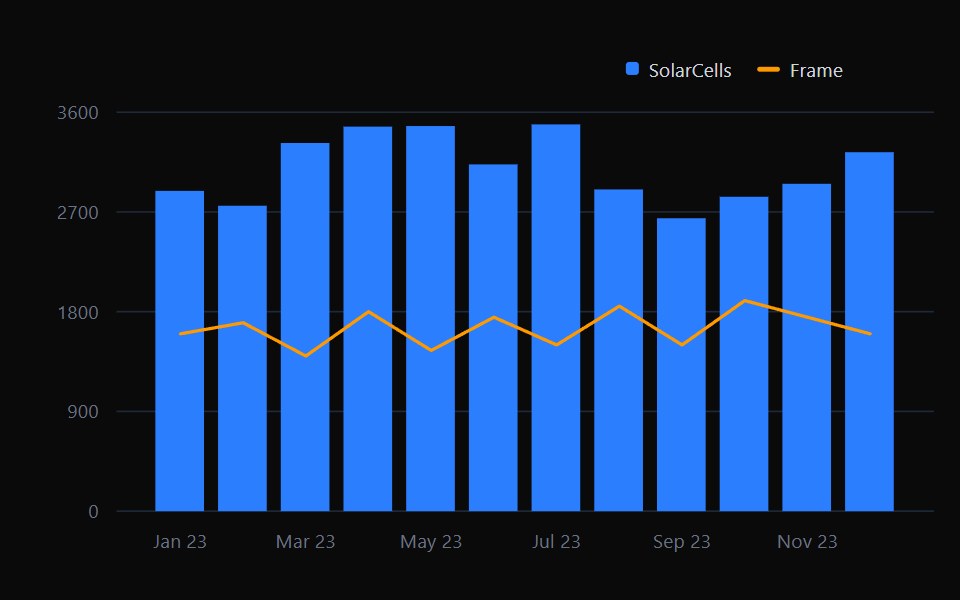 Combo ChartTremor · React
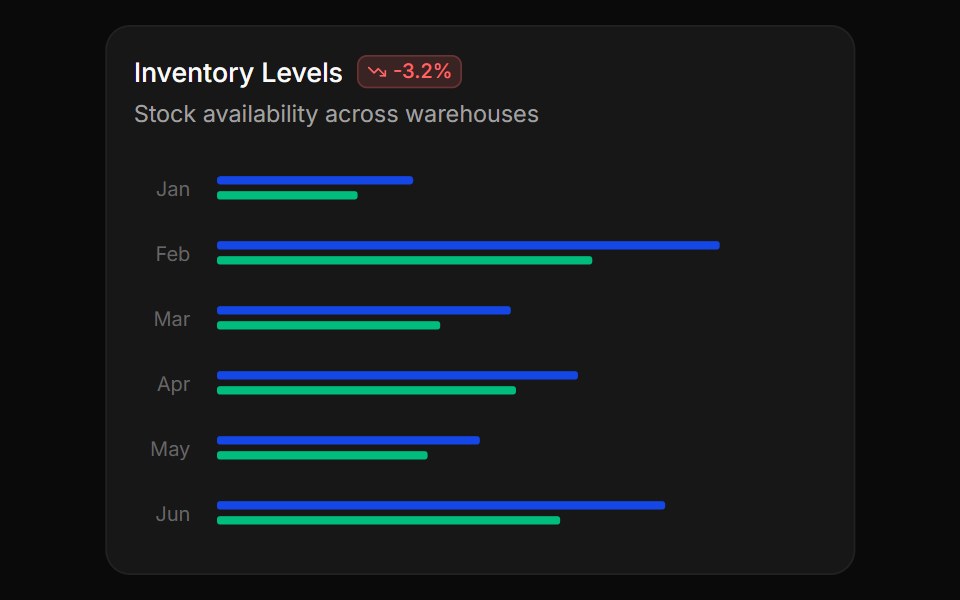 Vertical bar chartReUI · ReactVertical bar chart
 Segmented Arc MeterAmicro Micro Transitions · ReactStepped 4-bar discrete vertical gauge with percentage readout.
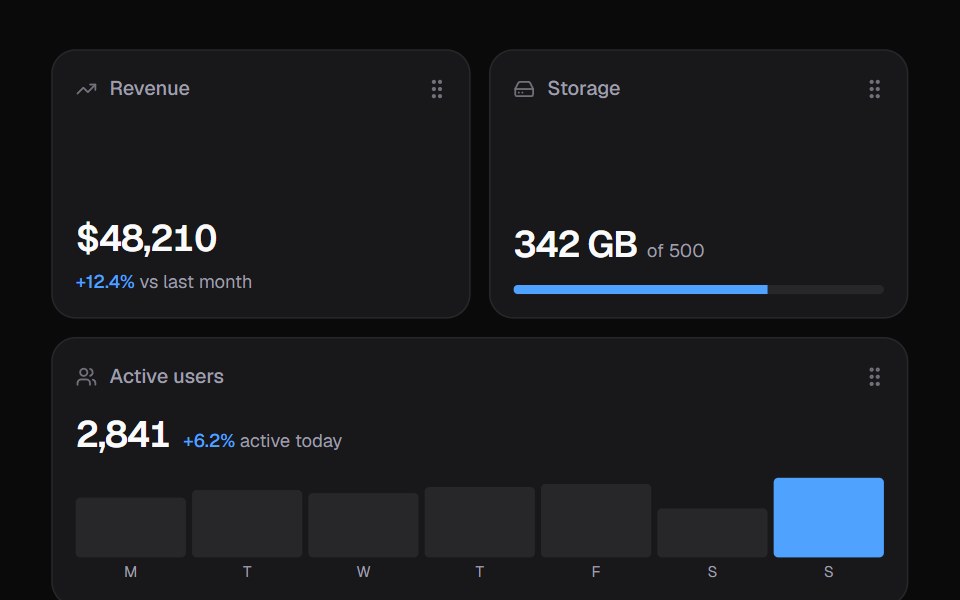 Widget GridKokonut UI · ReactDashboard widgets you lift, drag and resize on a 6-column grid, with spring physics and full keyboard support.
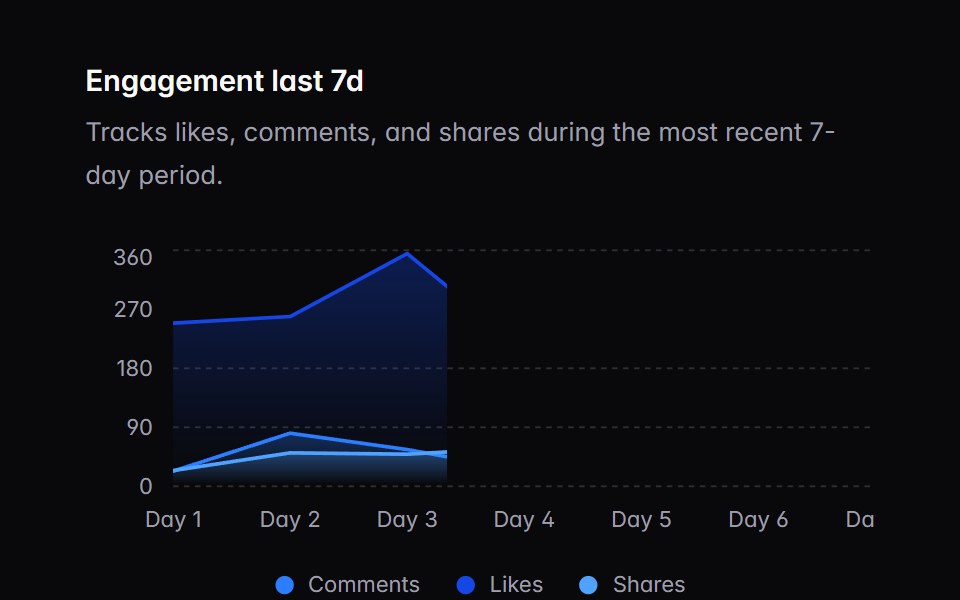 chart-01Intent UI · Reactchart-01
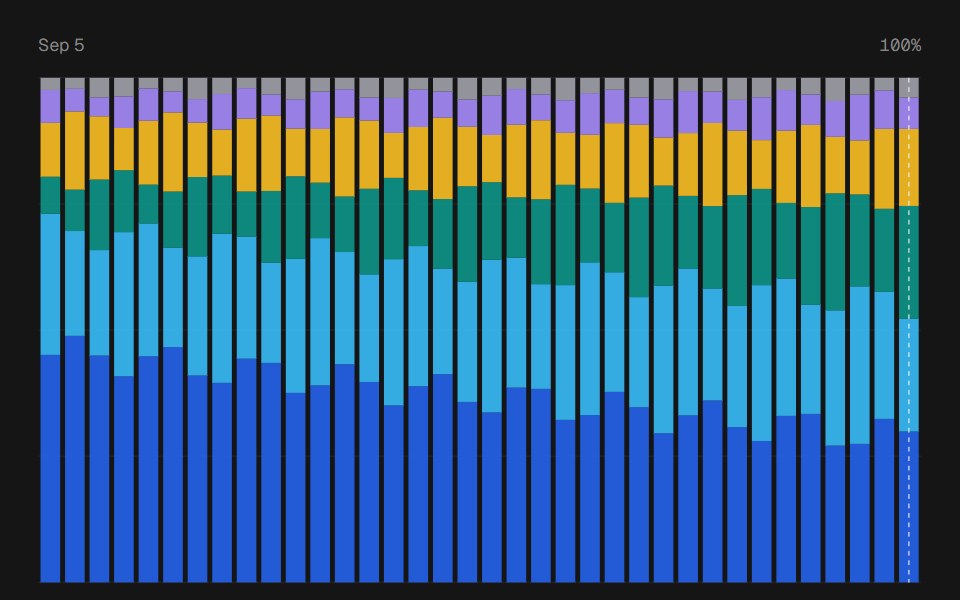 Composition ChartbeUI · ReactStacked bar and area shares with period tooltips and a compact interactive legend.
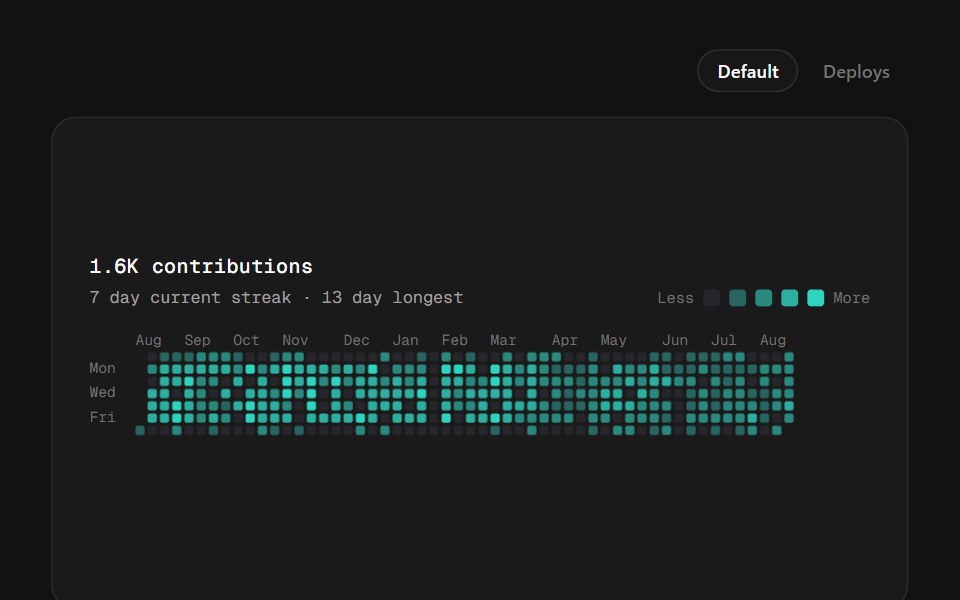 Calendar HeatmapSpectrum UI · ReactA year of daily values as week columns — the contributions grid, with five quantised intensity steps, streak stats…
Libraries with chart components
Related categories
- React Chart Components
- Tailwind CSS Chart Components
- Animated Chart Components
- shadcn/ui Chart Components
- Data Display Components
- Card Components
- Table Components
- Avatar Components
- List Components
- Stat Components
- Calendar Components
- Accordion Components
- Data Table Components
- Carousel Components
- Collapsible Components
- Avatar Group Components
- Stat Card Components
- Bar Chart Components
- Tree View Components
- Card Stack Components