 Dev Design Library
Animated Chart Components
Dev Design Library indexes 177 Animated chart components from 26 open-source UI libraries, with the most coming from Amicro Micro Transitions, Panel UI, Spectrum UI, beUI and Arc Library. Each one links to its page with the source code, a live preview where available, the library license and the install command. These are the chart components tagged as animated: motion on hover, on scroll or on load, usually built with CSS transitions or Framer Motion. Chart components belong to the Data display group.
Showing 120 of 177, a mix from every library. Open a library to see all of its components.
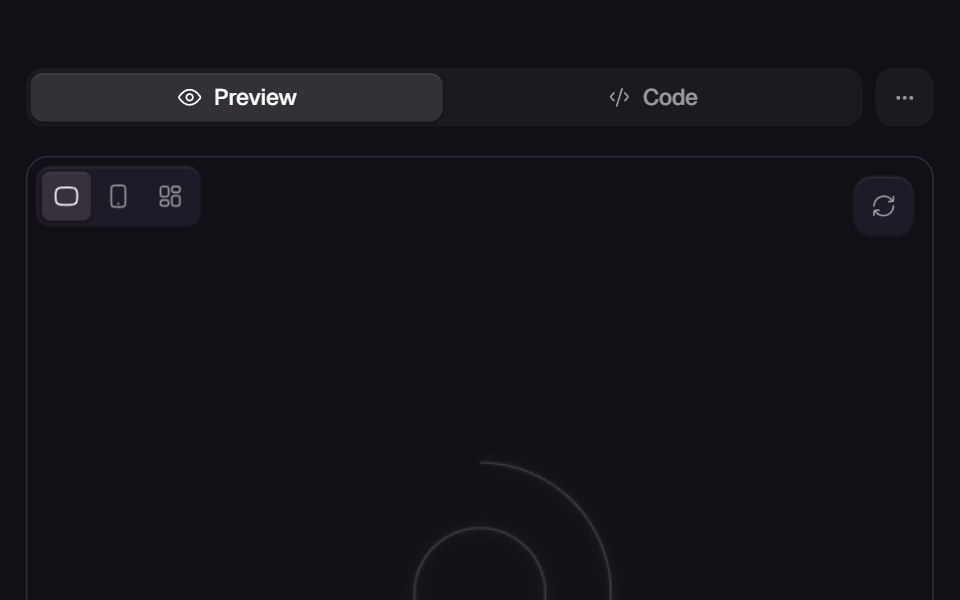 RadarReact Bits · ReactRadar sweep effect with concentric rings, radial spokes, and a rotating beam.
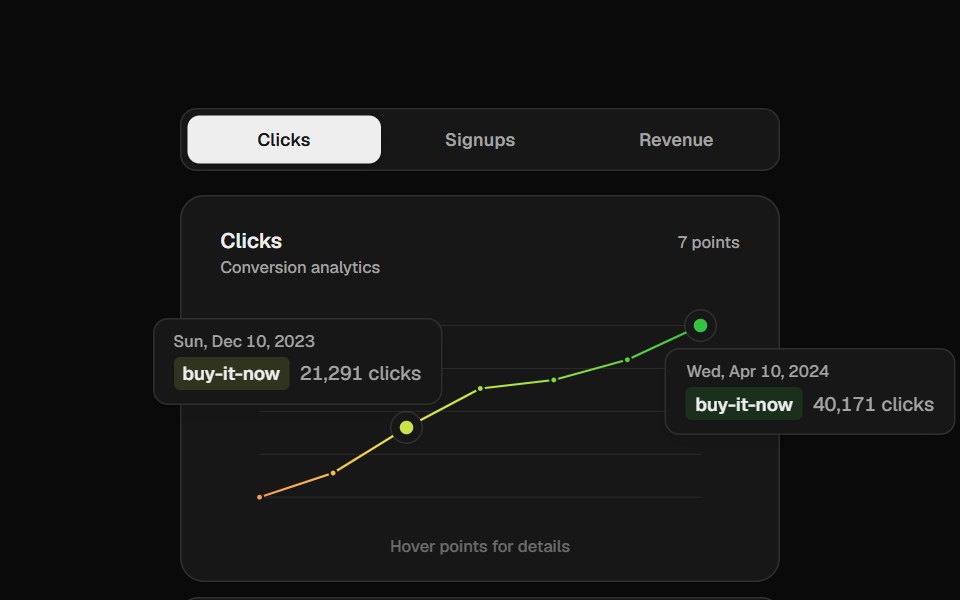 Analytics ChartCult UI · ReactVercel-style gradient line chart with floating tooltip cards
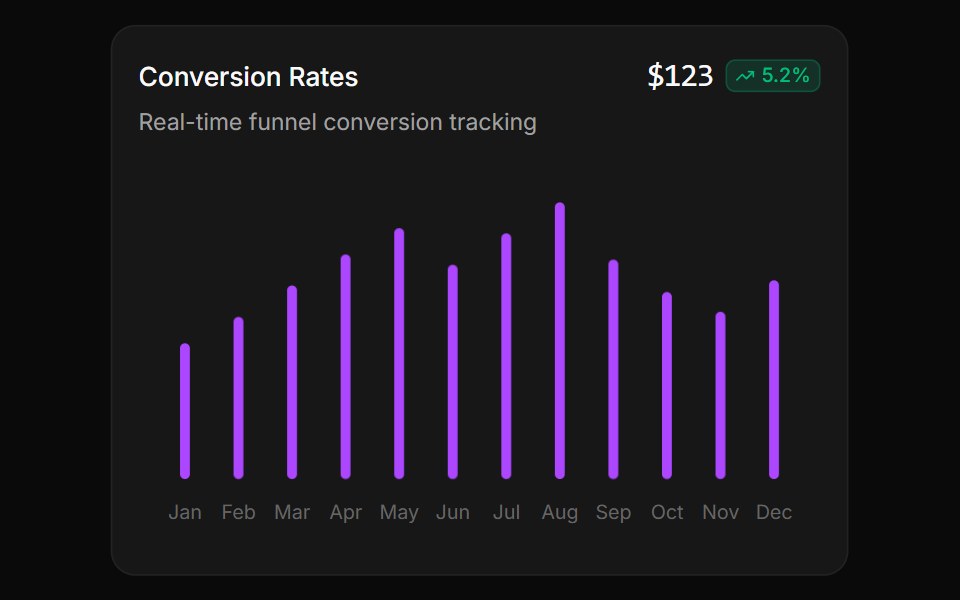 Animated monochrome bar chartReUI · ReactAnimated monochrome bar chart
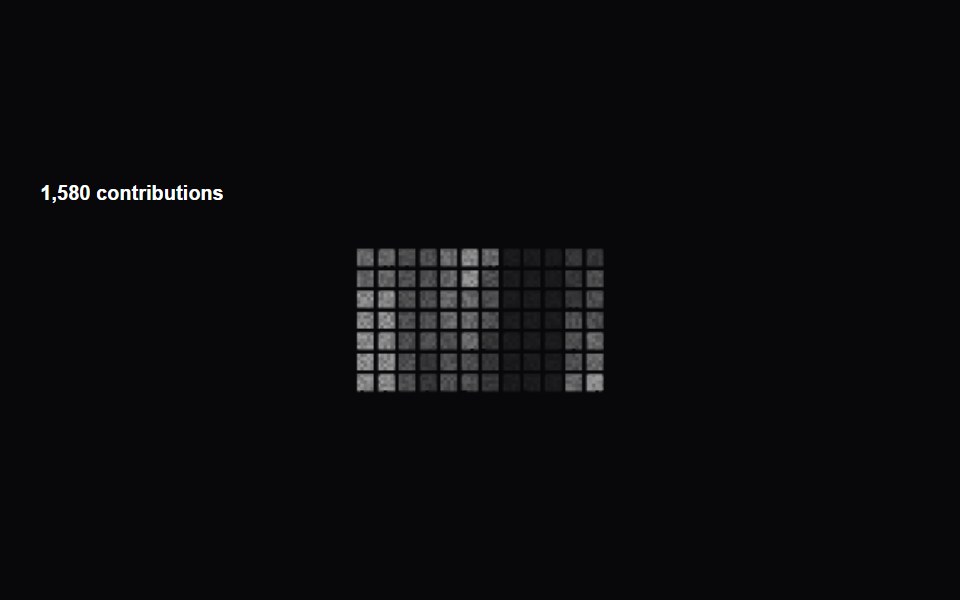 Activity Dither HeatmapAmicro Micro Transitions · ReactGitHub-style activity heatmap with interactive dither dots.
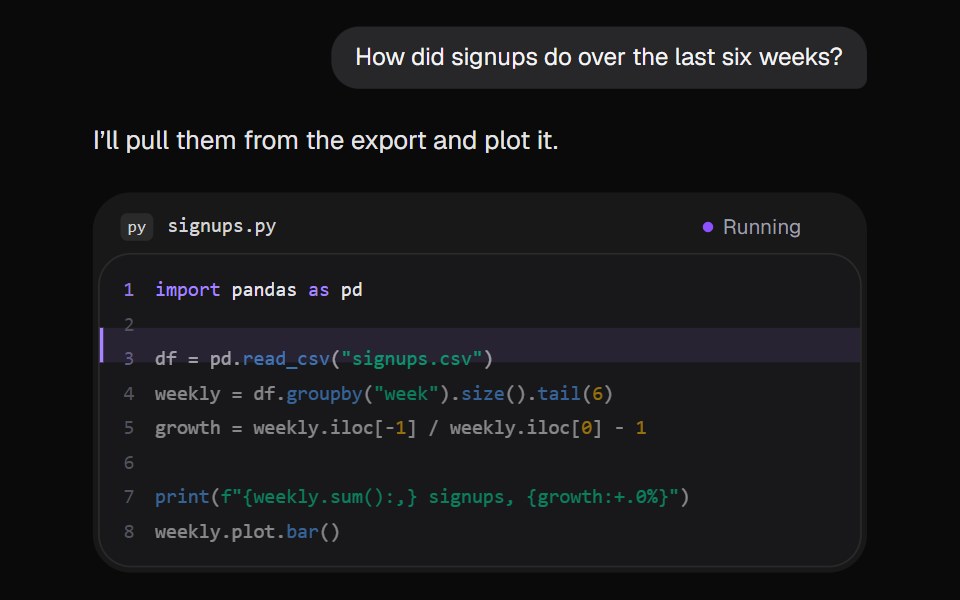 AI Code RunKokonut UI · ReactThe assistant runs a short Python script in the reply. A marker steps down the lines, the output prints, and the chart…
 Horizontal BarsCursify · React
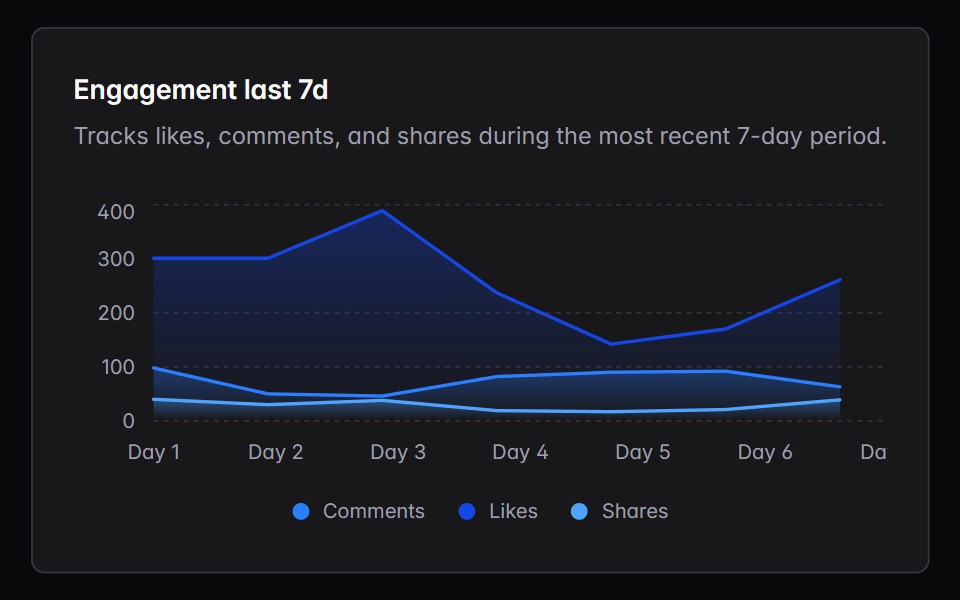 area-chartIntent UI · Reactarea-chart
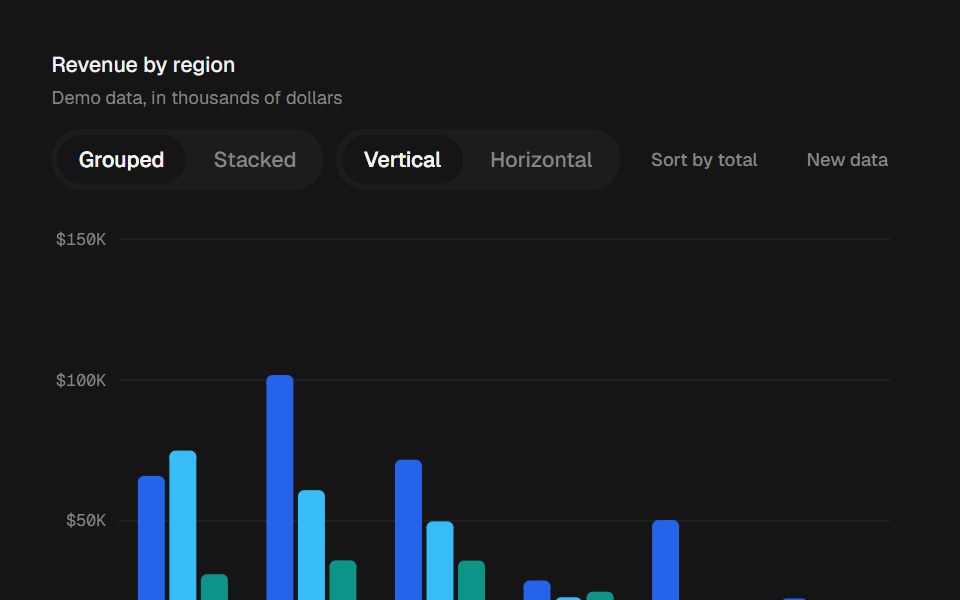 Bar ChartbeUI · ReactGrouped, stacked and horizontal bars that grow in, rescale and reorder with springs.
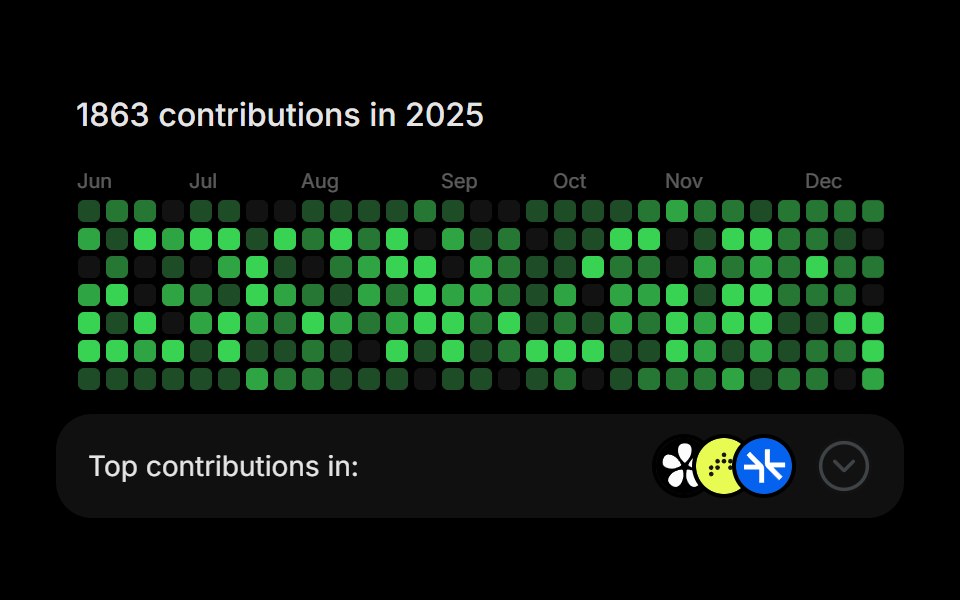 GitHub ActivityRare UI · ReactA contribution heatmap with a footer panel that expands over the grid to rank your top repositories.
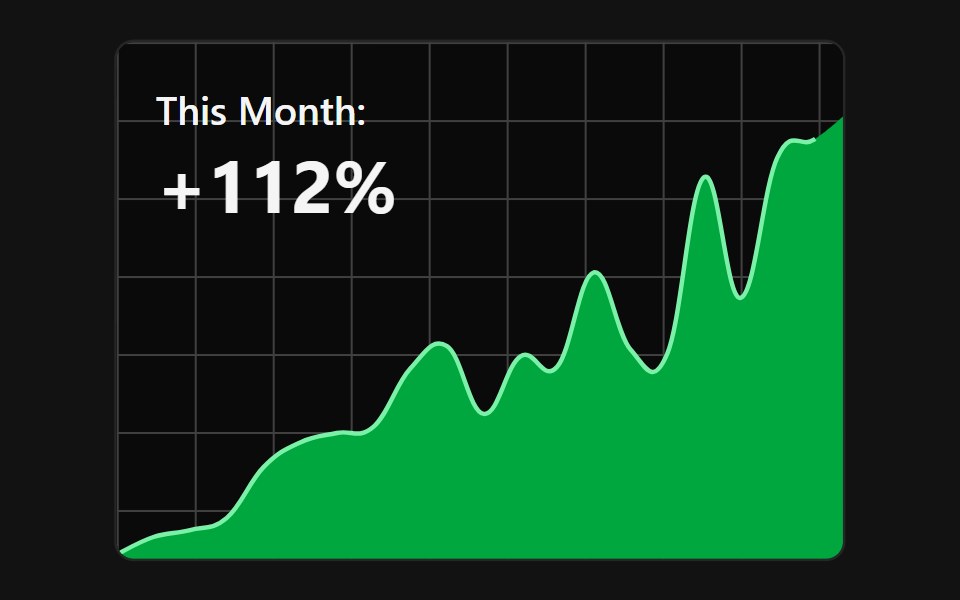 Animated SVG ChartSpectrum UI · Reactcomponent for the Animated SVG Chart
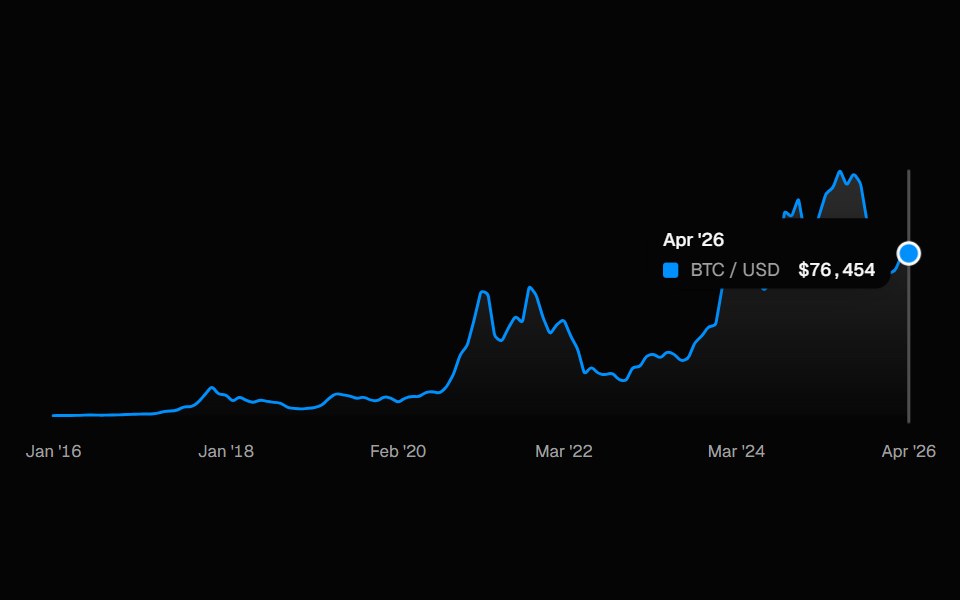 ChartSpell UI · ReactInteractive line chart with a cursor-tracked tooltip card, snap-to-point hover, and built-in X-axis labels.
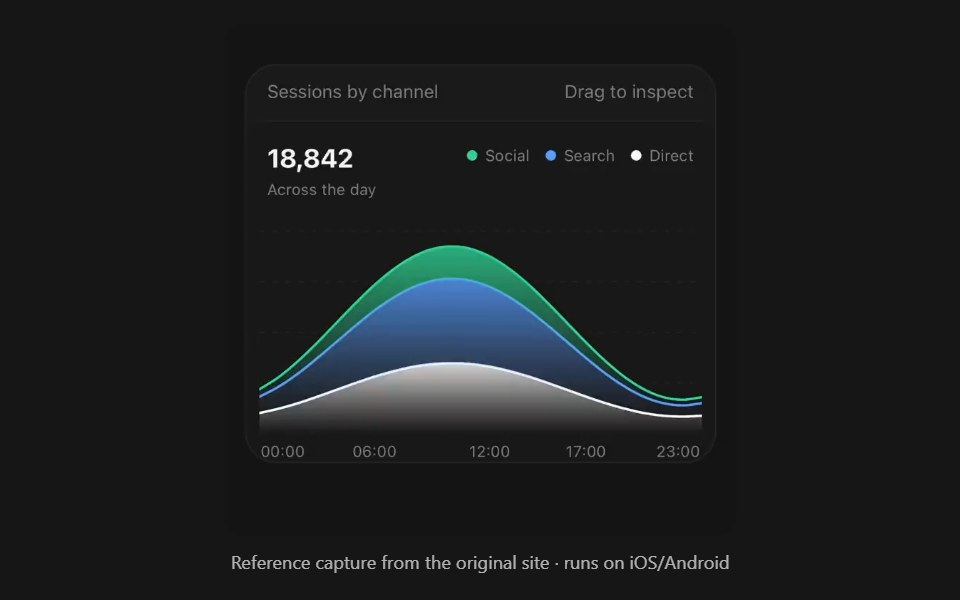 Area ChartPanel UI · React NativeFilled bands over time, stacked or overlaid.
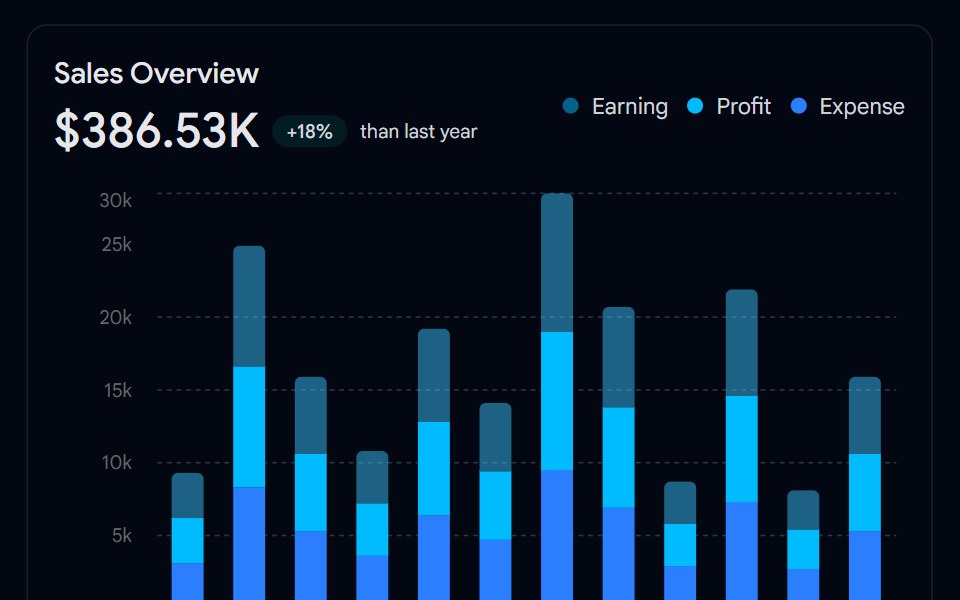 Chart 01 - Sales Performance Bar ChartShadcn Space · ReactAn interactive stacked bar chart displaying monthly earnings, profit, and expenses, ideal for admin dashboards to…
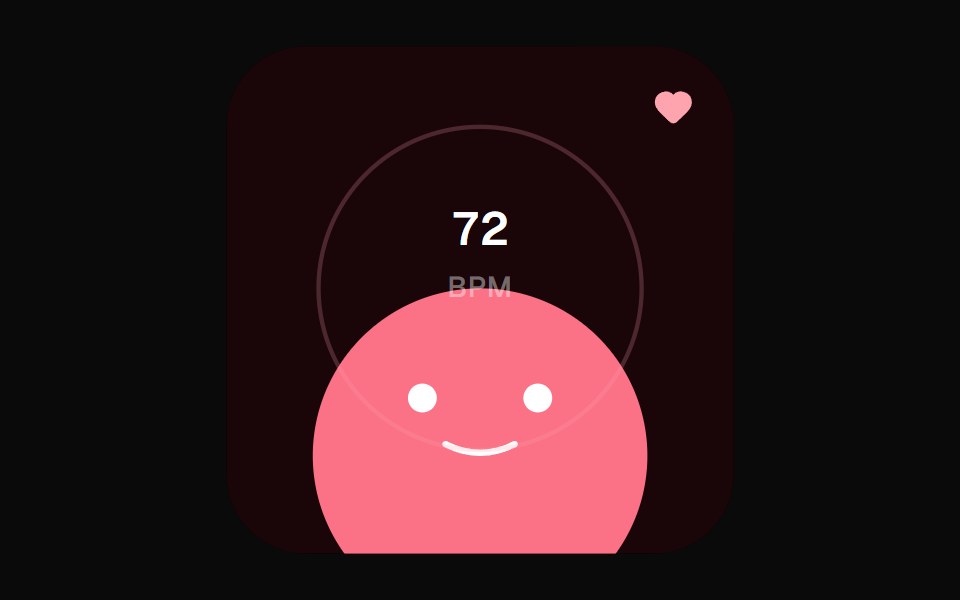 Heart Rate WidgetOpenSourceUI · React
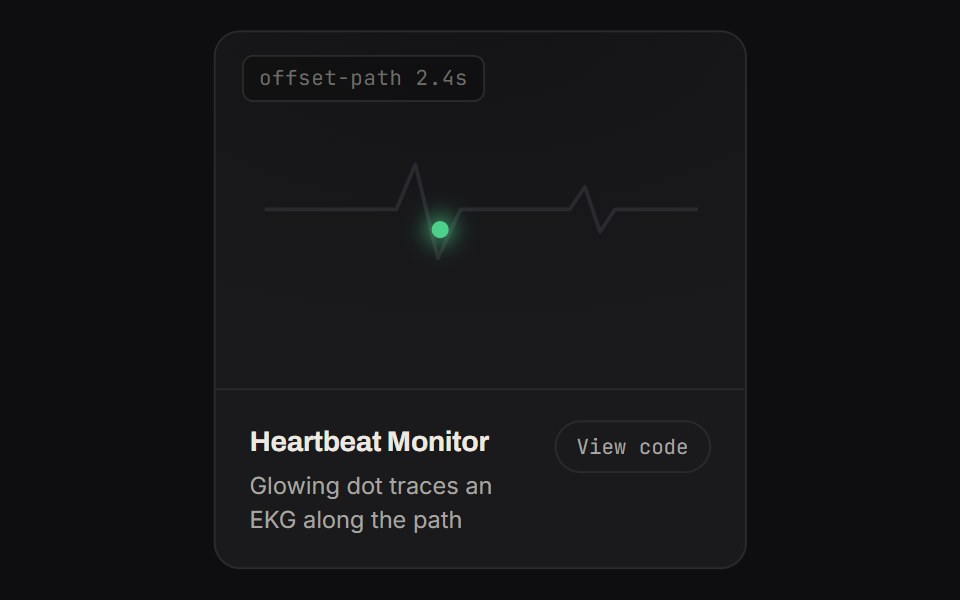 Heartbeat MonitorKinetics · HTML/CSSGlowing dot traces an EKG along the path
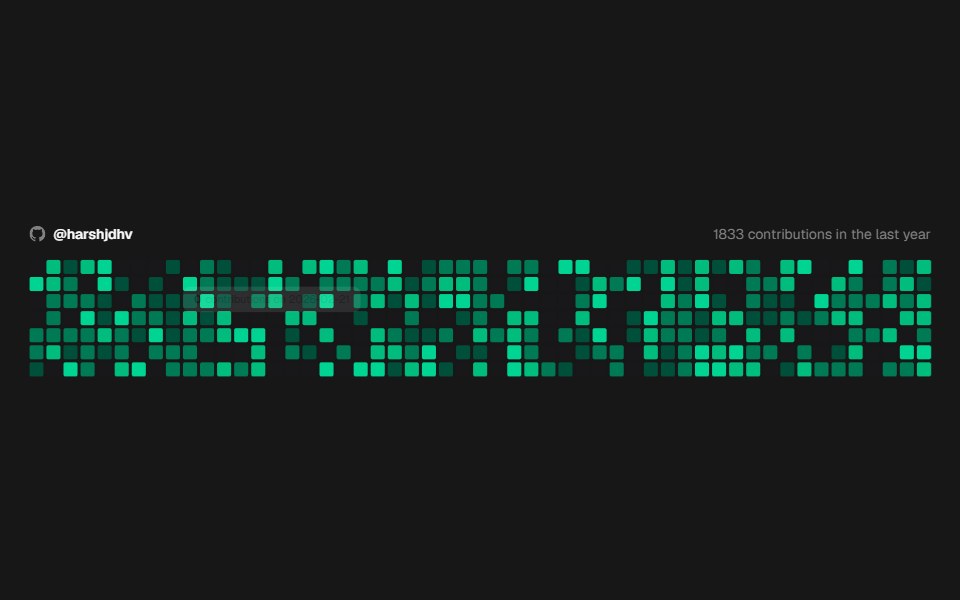 Github CalendarComponentry · ReactGitHub-style contribution calendar heatmap.
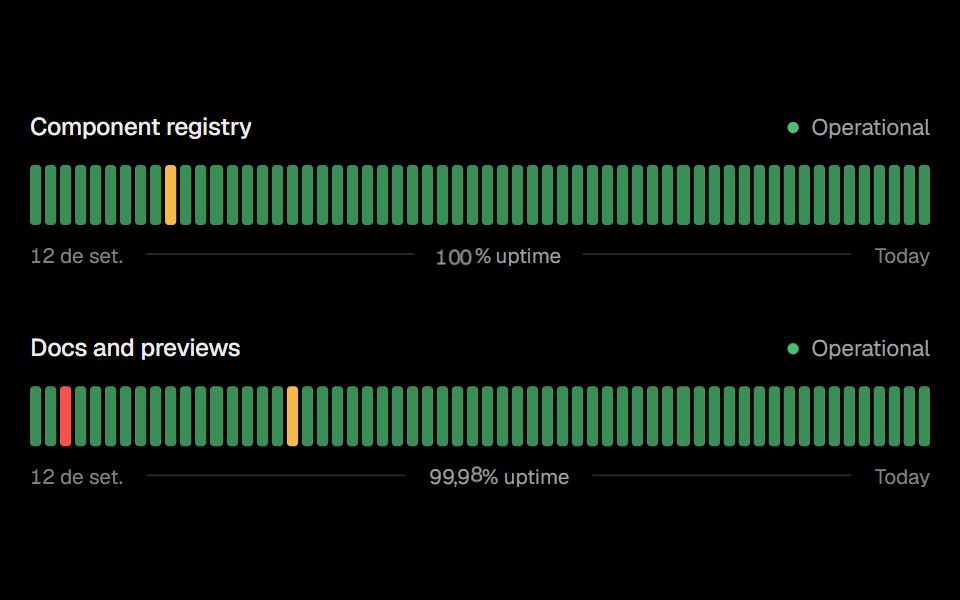 Status BarsObsidianUI · React
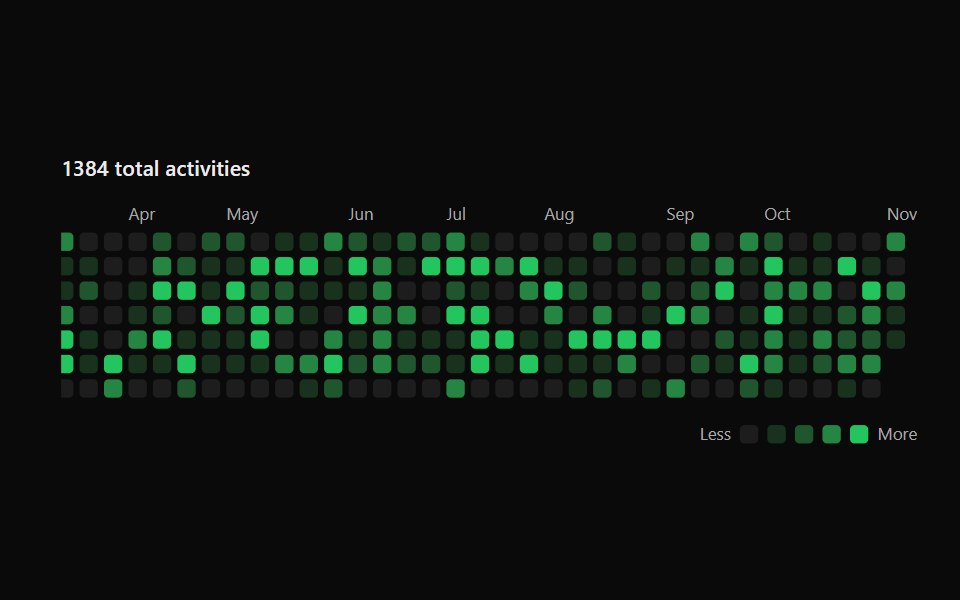 Activity GraphSona UI · ReactA keyboard-accessible calendar heatmap with normalized intensity levels and an interruptible shared focus surface.
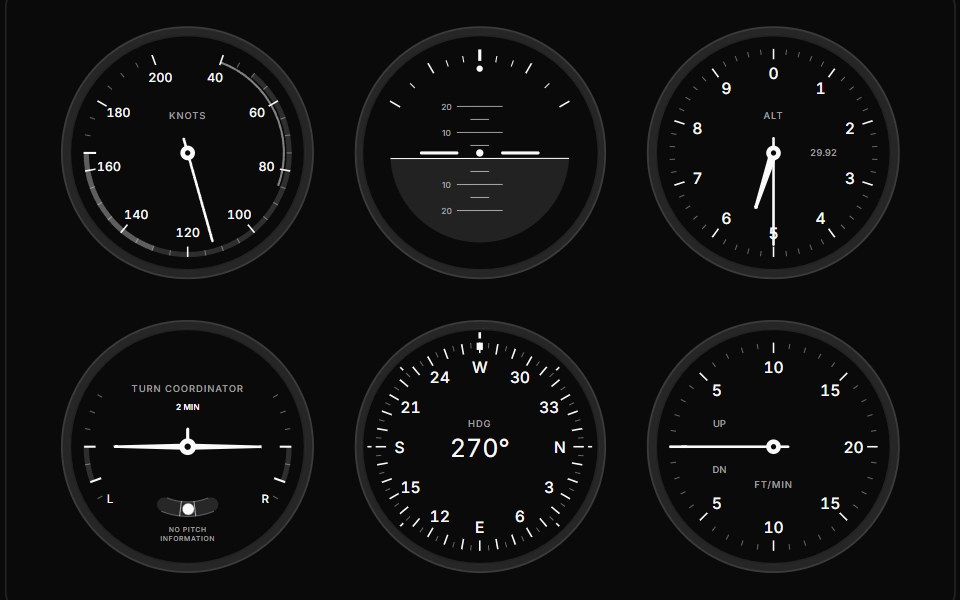 GaugeGauge UI · ReactComposable SVG gauge primitives: track, arc, zones, ticks, tick fills, labels, needle, hub, dot, tooltip and value…
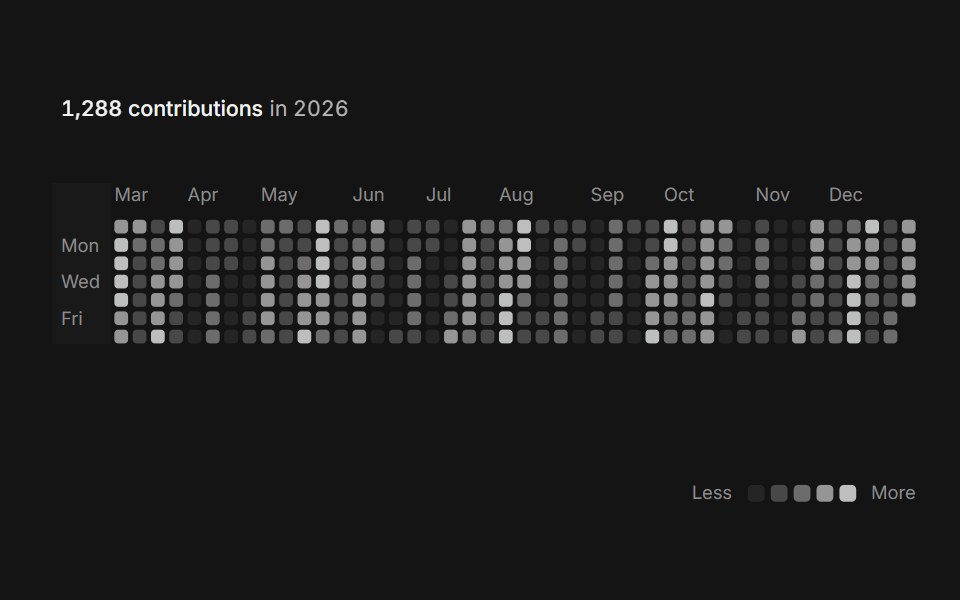 Activity heatmapArc Library · ReactSee a year of activity at a glance, one square per day.
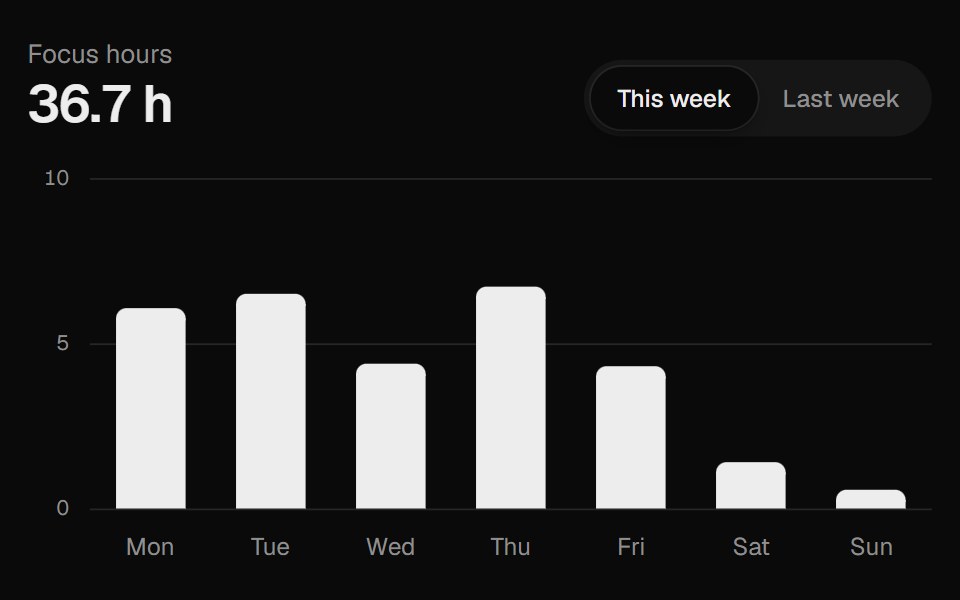 Bar ChartUI Lab · ReactGrows its bars from the baseline and springs them between two weeks.
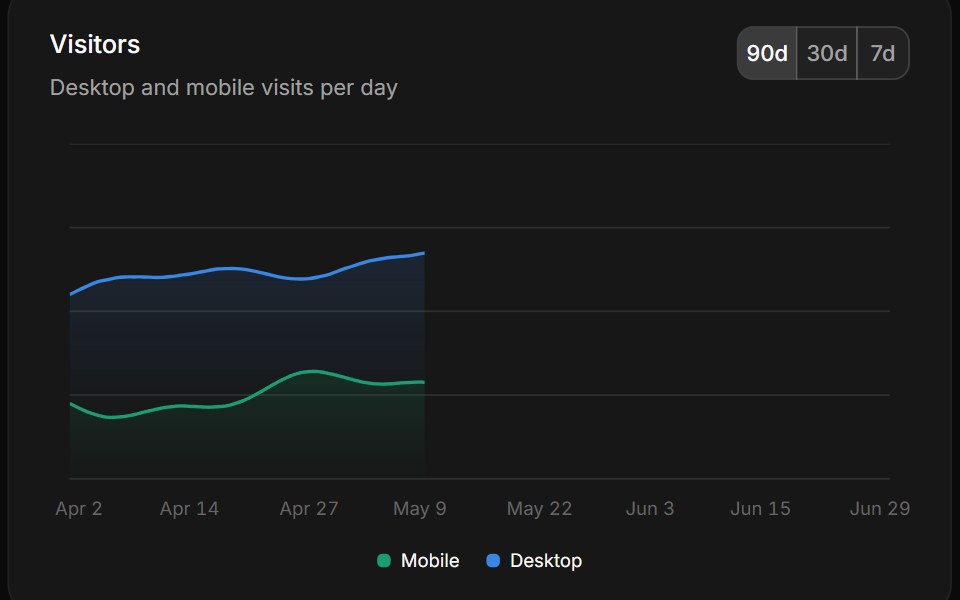 ChartHextaUI · ReactRecharts charts with themed colors, a tooltip and legend that read labels from one config, and keyboard navigation…
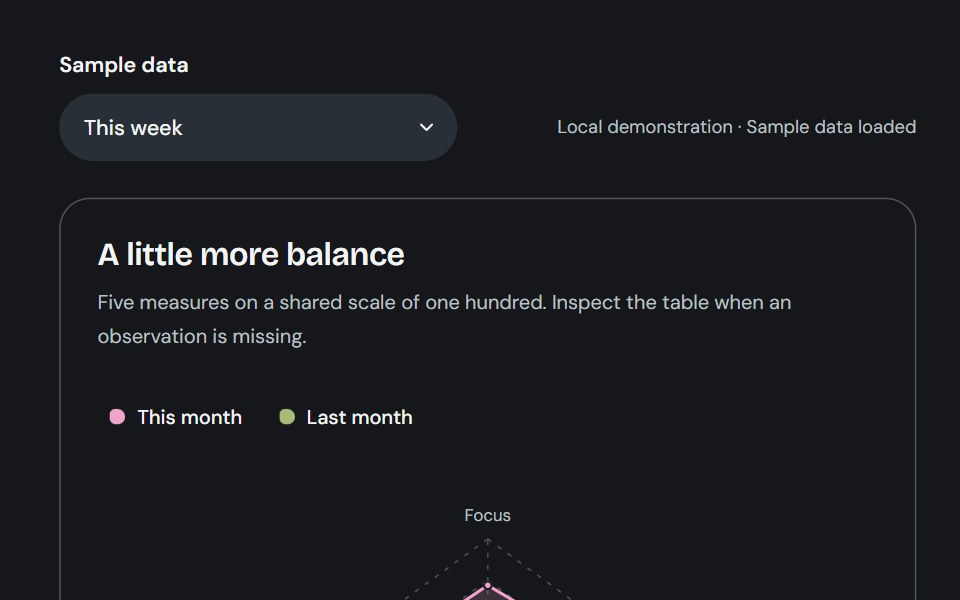 Radar chartCojeev UI · ReactCompare several dimensions with a shared radar scale and contextual series highlighting.
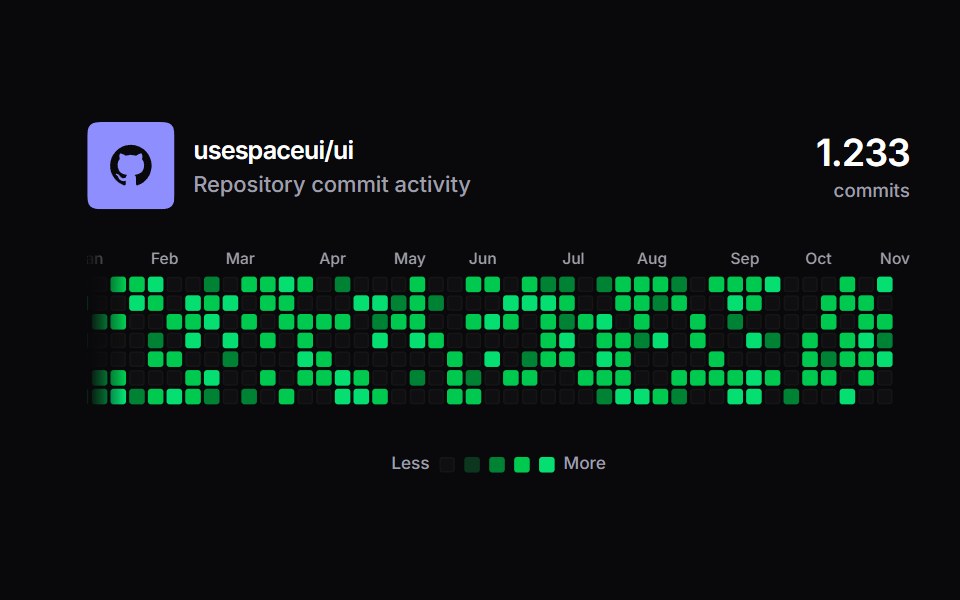 Github ActivitySpaceUI · ReactAn interactive GitHub ecosystem showcase featuring pure 52-week contribution heatmap matrix content with live fetch…
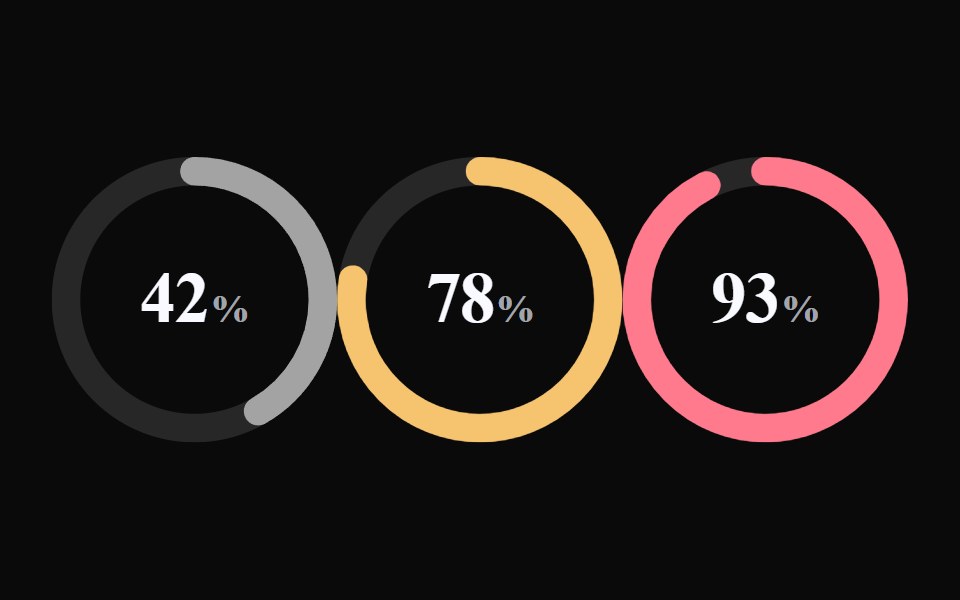 Liquid GaugeLiquefy UI · React
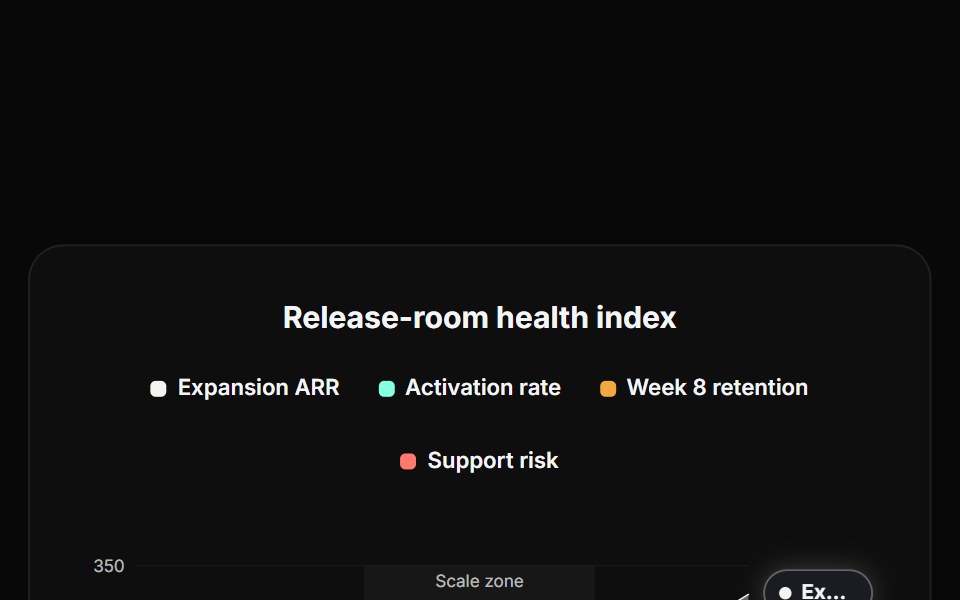 Line ChartReactFrame · ReactA multi-series line/area chart, smooth Catmull-Rom curves, a highlighted zone band, a reference line, endpoint value…
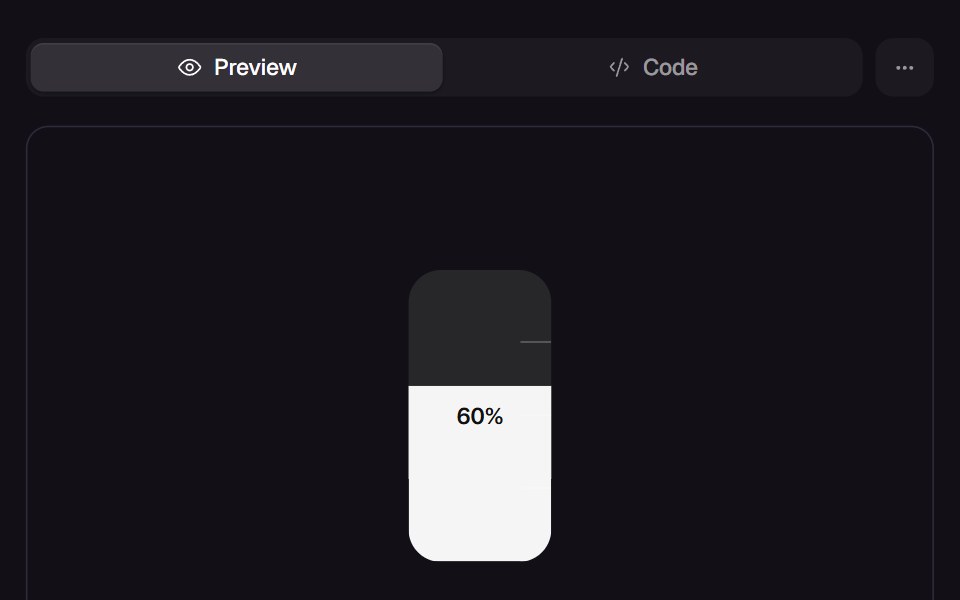 Slosh GaugeReact Bits · ReactTank gauge whose liquid chases the value with mass, tilts with its own speed and splashes against the top when it…
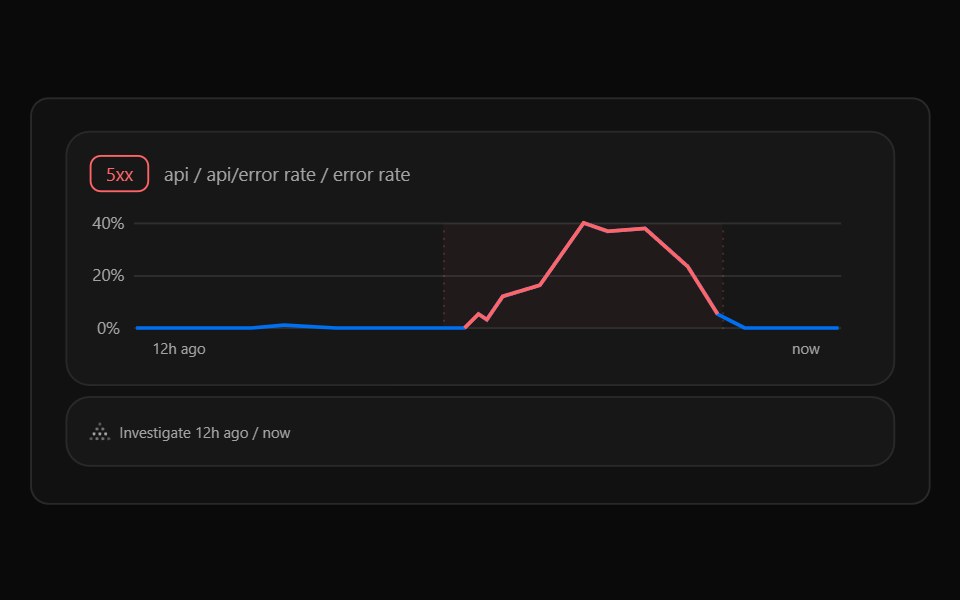 Illustration GraphCult UI · ReactGraph illustration component
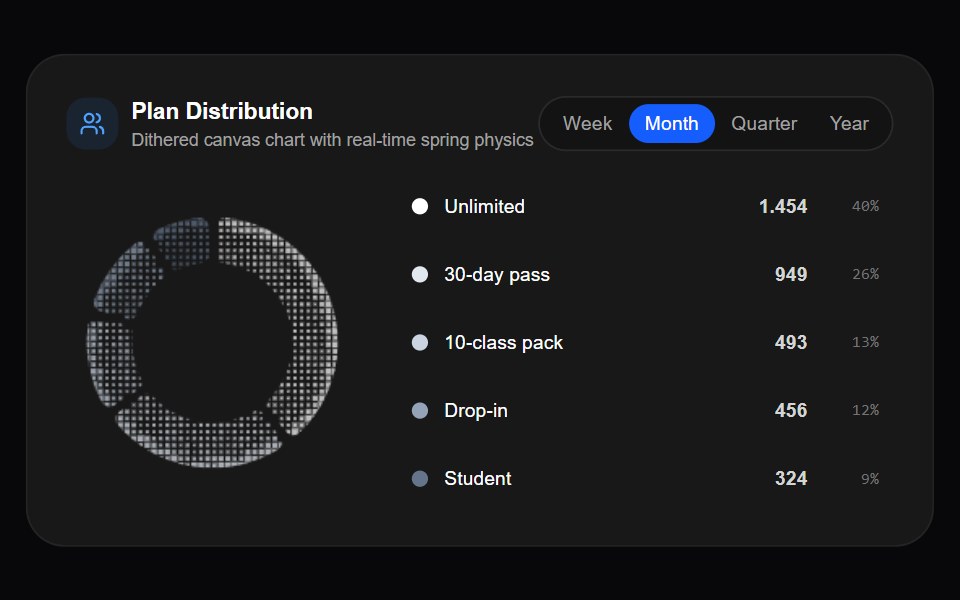 Dither Donut ChartAmicro Micro Transitions · ReactInteractive pixelated dither donut chart with real-time spring physics.
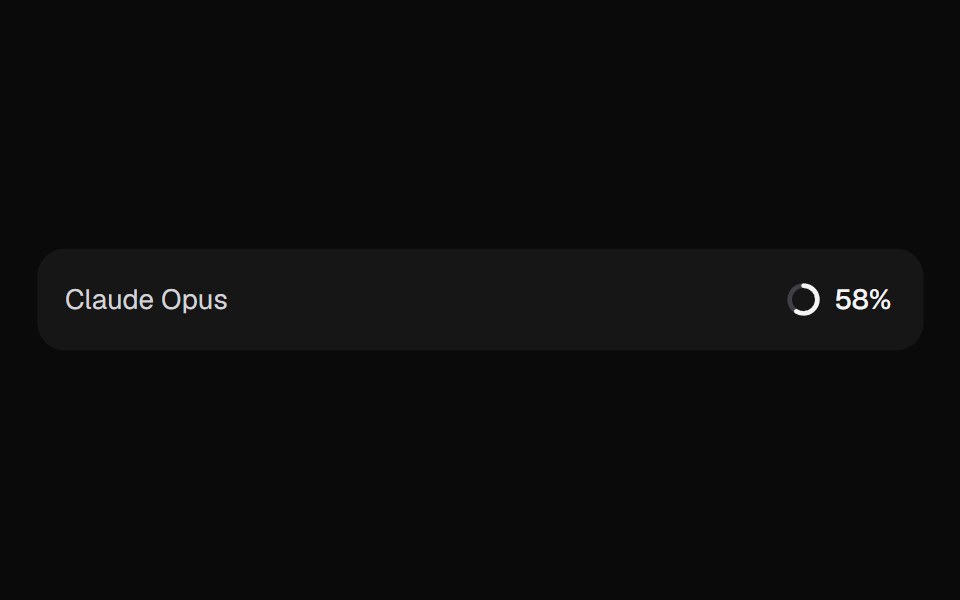 AI Context MeterKokonut UI · ReactHow full the context window is, as a ring in the prompt footer that opens a breakdown by source and compacts when it…
 Verticle BarsCursify · React
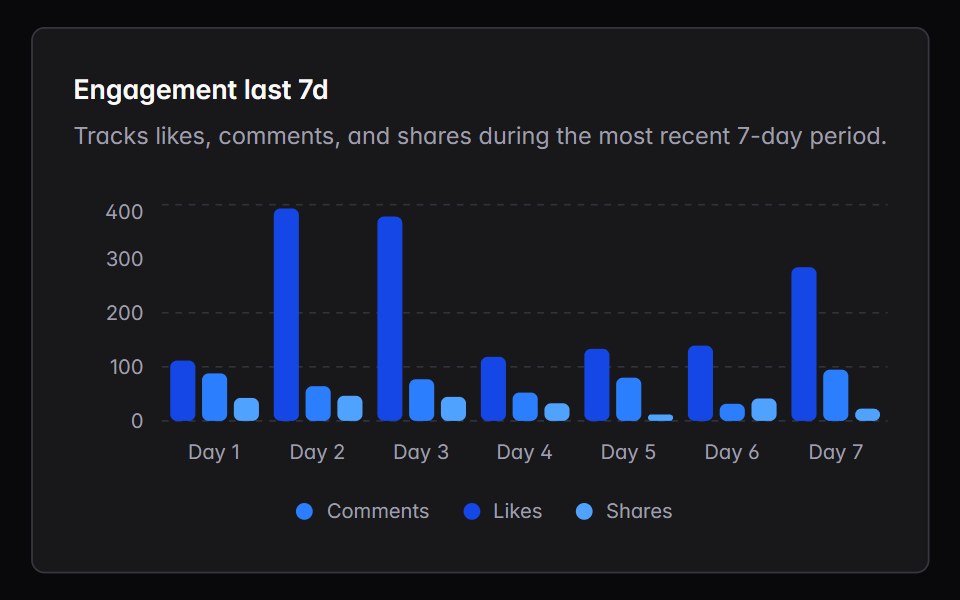 bar-chartIntent UI · Reactbar-chart
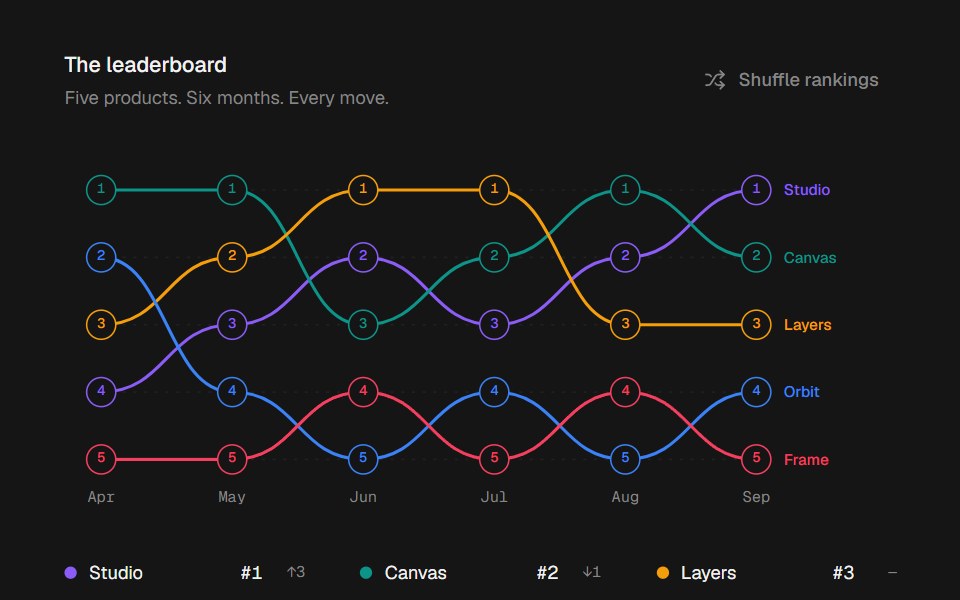 Bump ChartbeUI · ReactAnimated rankings with curved paths, interactive rank dots, and tooltips.
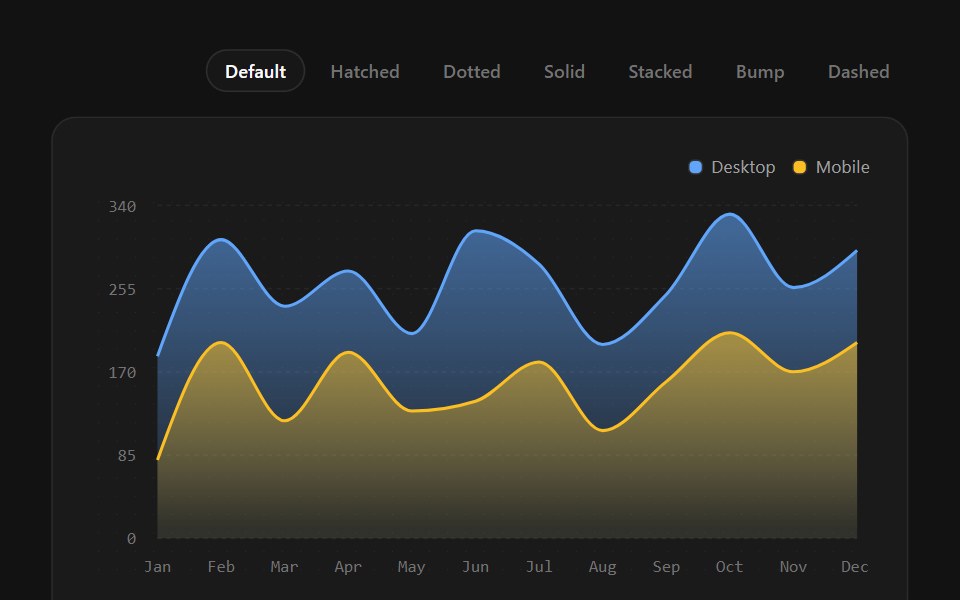 Area ChartSpectrum UI · ReactFilled areas with gradient, hatch, dotted, stacked, and dashed-stroke variants.
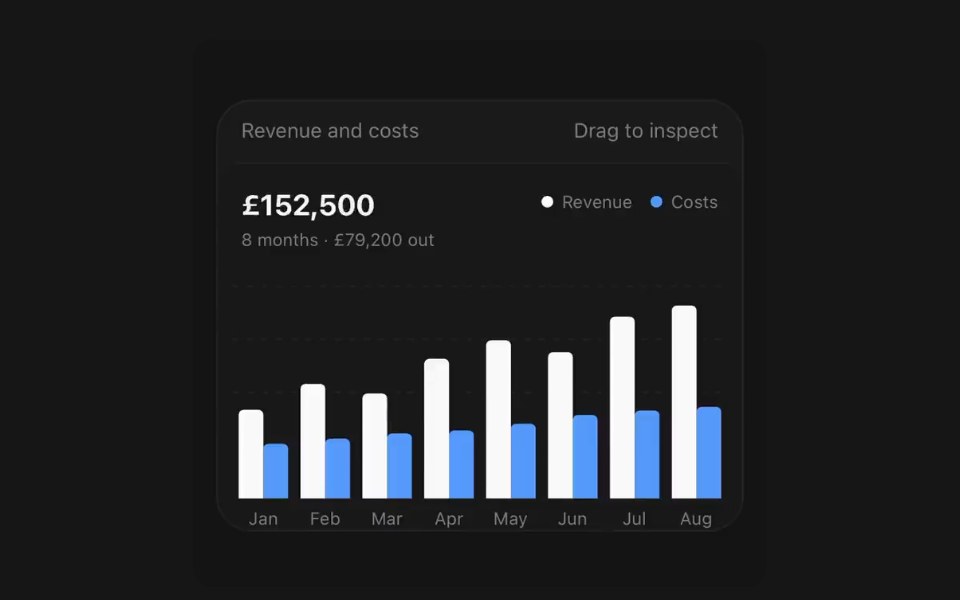 Bar ChartPanel UI · React NativeCategories compared by length, grouped or stacked.
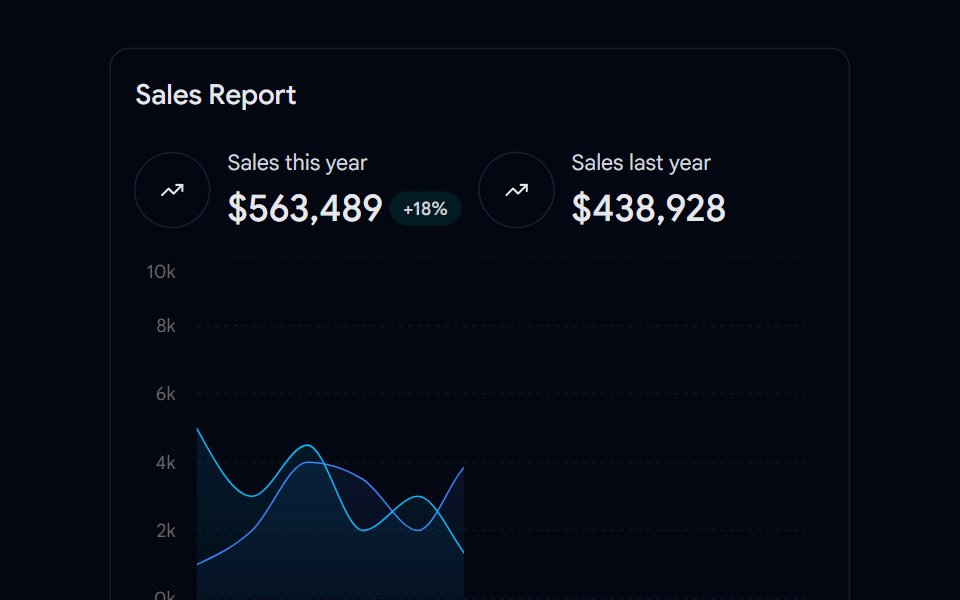 Chart 03 - Yearly Sales ComparisonShadcn Space · ReactA smooth line chart comparing this year versus last year sales with summary stats, ideal for dashboards to visualize…
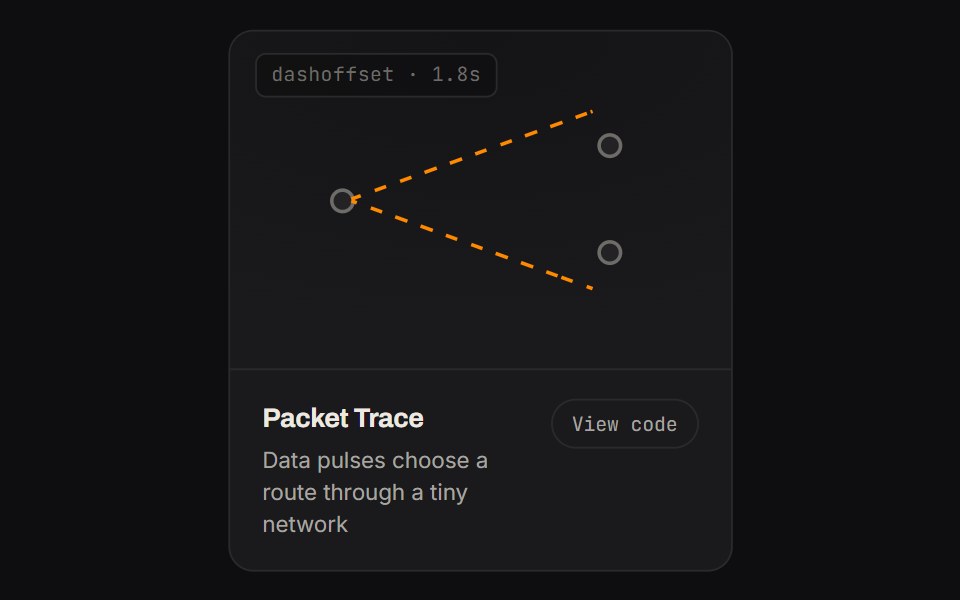 Packet TraceKinetics · HTML/CSSData pulses choose a route through a tiny network
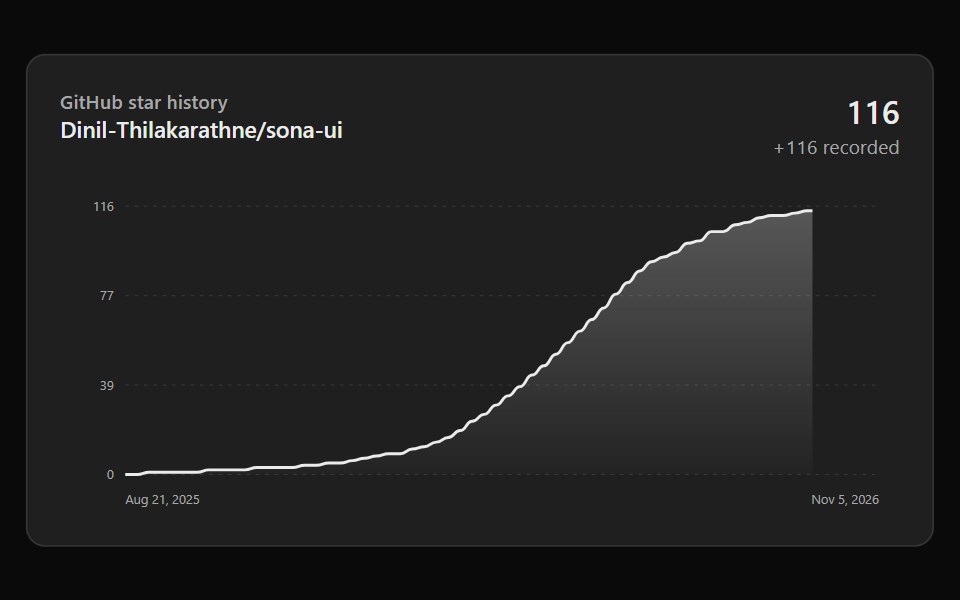 Github Star HistorySona UI · React
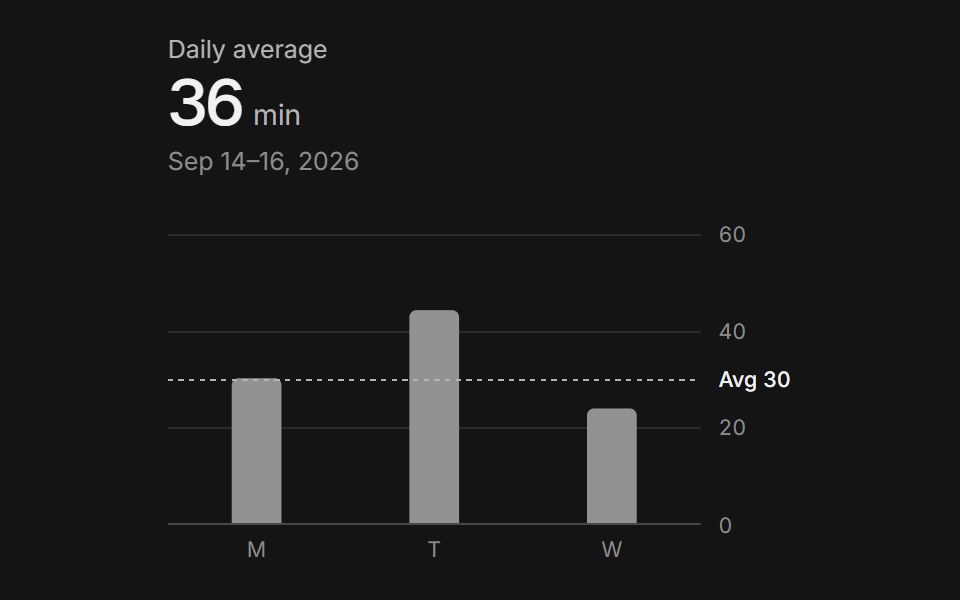 Bar chartArc Library · ReactCompare one measure across days and scrub any bar for its value.
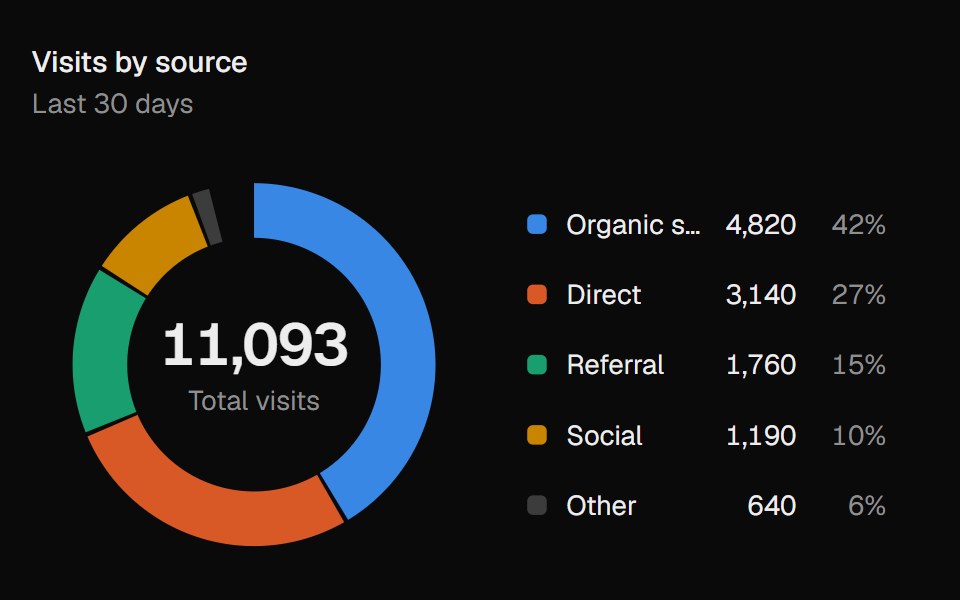 Donut ChartUI Lab · ReactDraws itself in, then lifts whichever slice you point at.
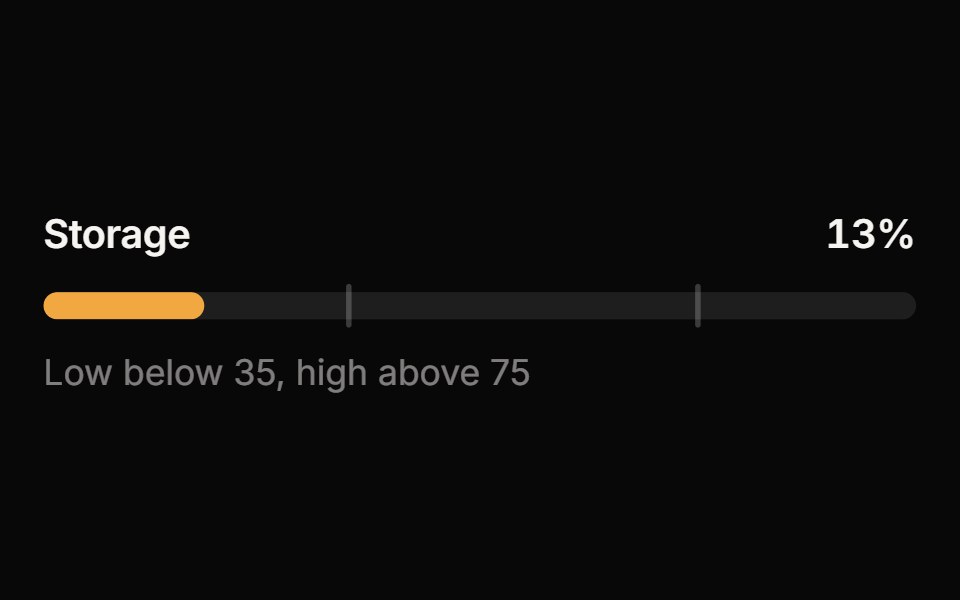 MeterReactFrame · ReactA meter for a value within a known range: bar, semicircle gauge or segmented variants with threshold zones, animated…
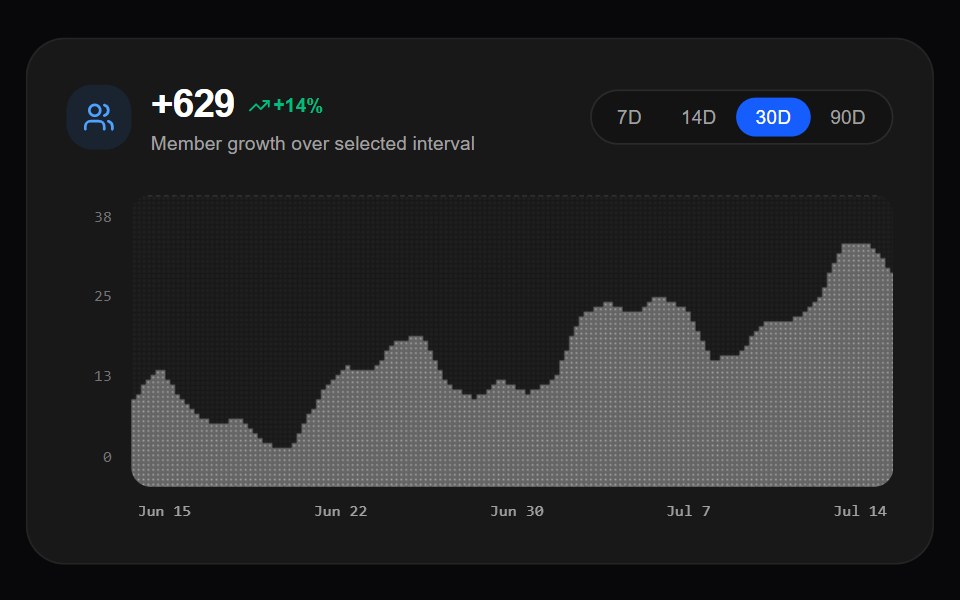 Dither Growth ChartAmicro Micro Transitions · React60fps canvas growth line chart with pixel dither fill matrix.
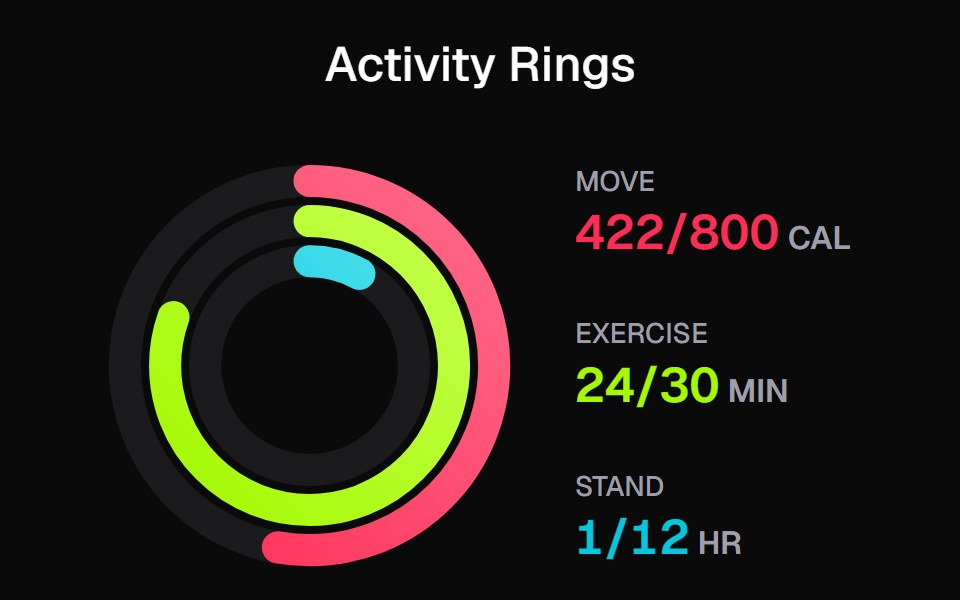 Apple Activity CardKokonut UI · ReactActivity rings that draw with a count-up, lap past 100% with a shadowed end cap and dim to focus, built with React and…
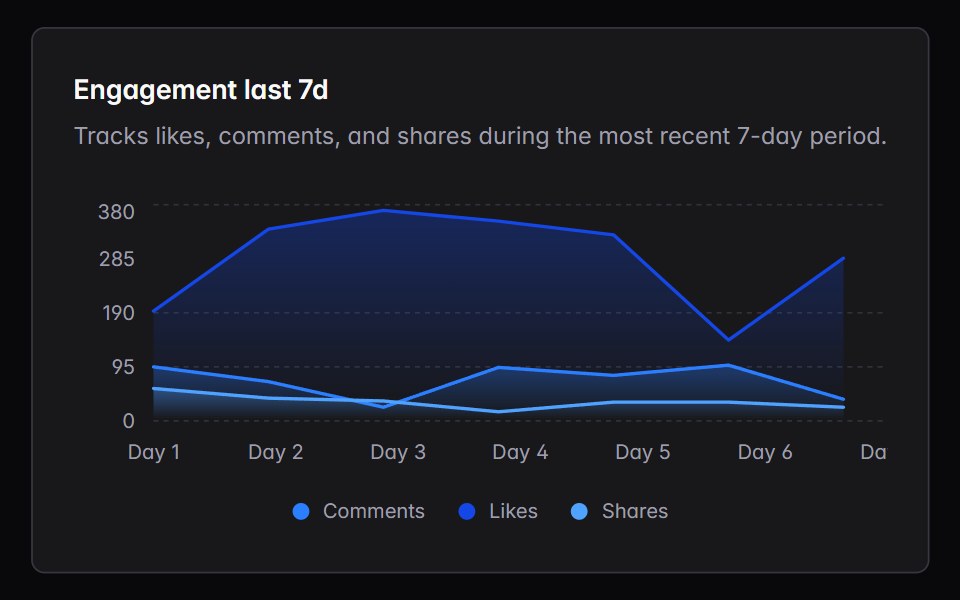 chartIntent UI · Reactchart
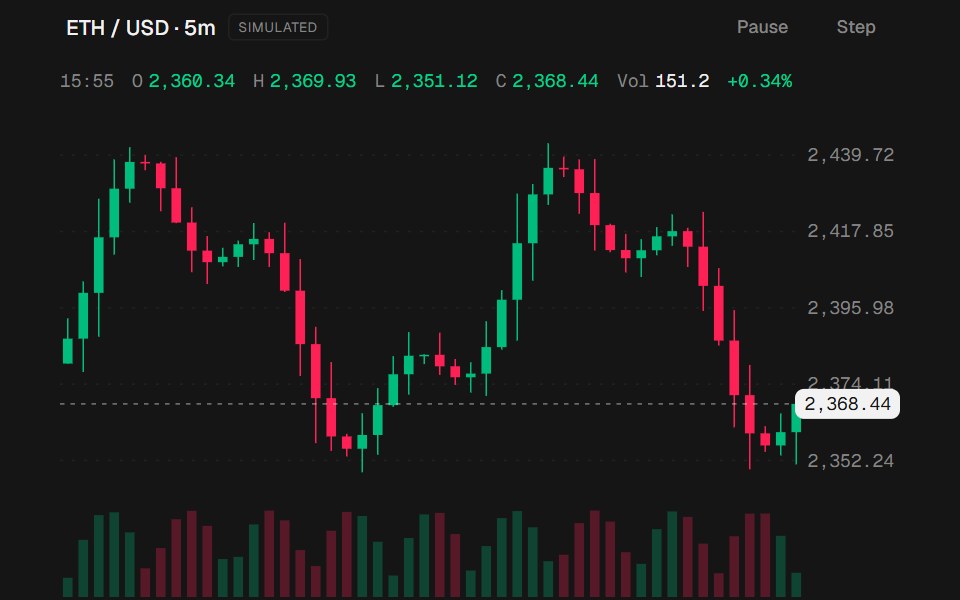 Candlestick ChartbeUI · ReactLive OHLC candles with volume, a last-price line, and a crosshair readout.
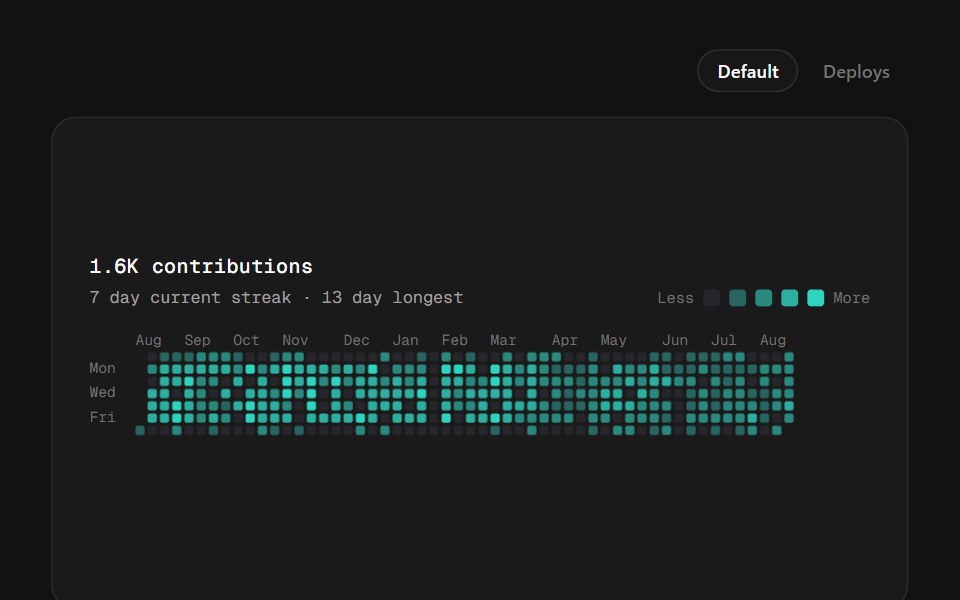 Calendar HeatmapSpectrum UI · ReactA year of daily values as week columns — the contributions grid, with five quantised intensity steps, streak stats…
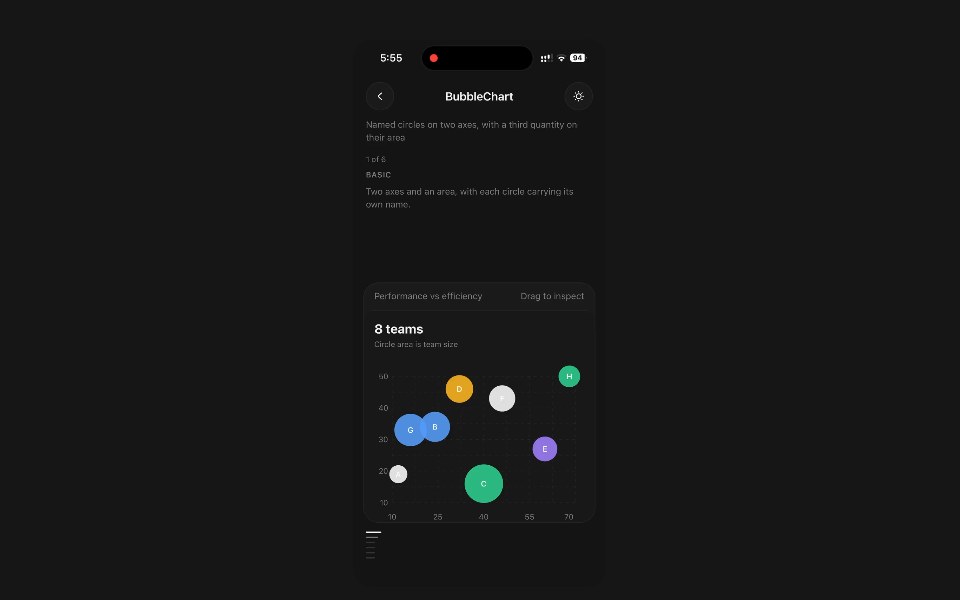 Bubble ChartPanel UI · React NativeNamed circles on two axes, with a third quantity on their area.
 Spinner 06 - BarsShadcn Space · ReactThree vertical bars with staggered grow animation.
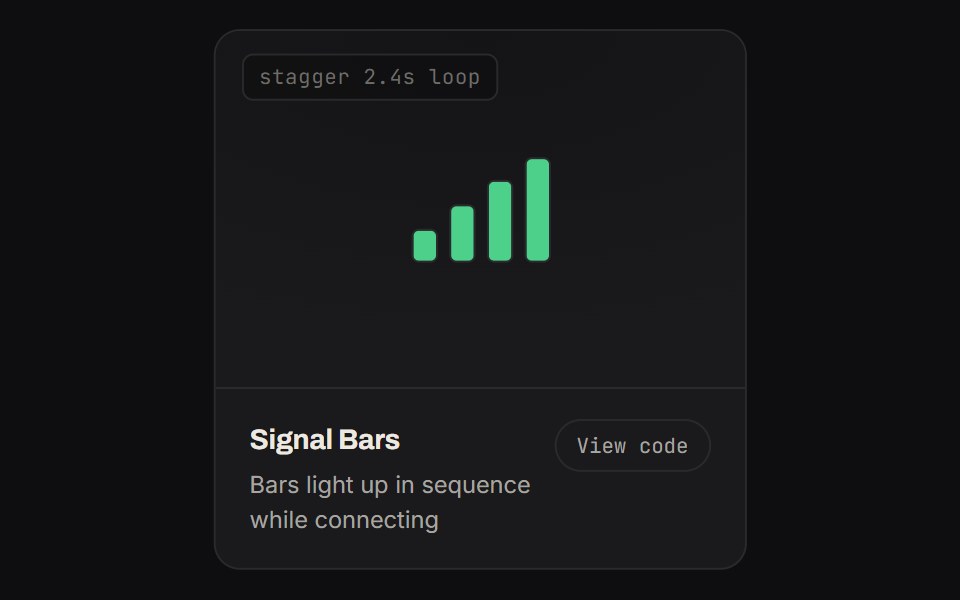 Signal BarsKinetics · HTML/CSSBars light up in sequence while connecting
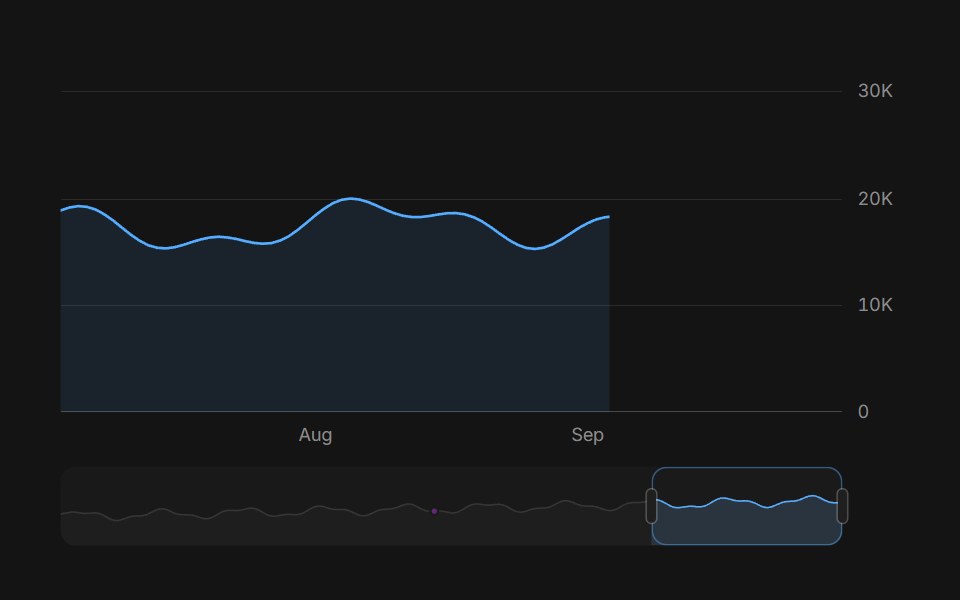 Brush chartArc Library · ReactA dense time series with an overview strip: drag a window to zoom, resize it by its handles, and read events in place.
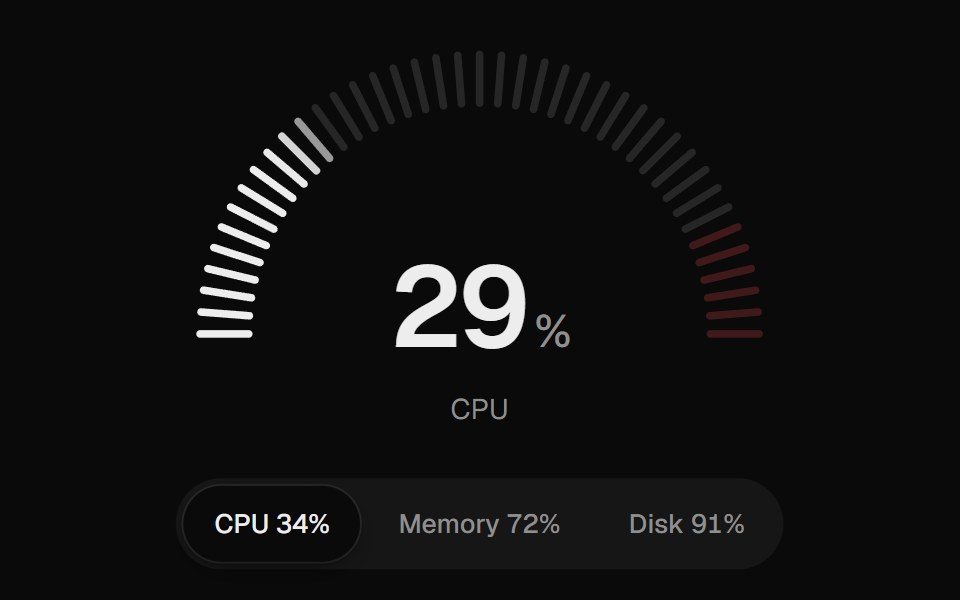 GaugeUI Lab · ReactTicks light up as the value sweeps in, and a peak marker holds where it was before falling.
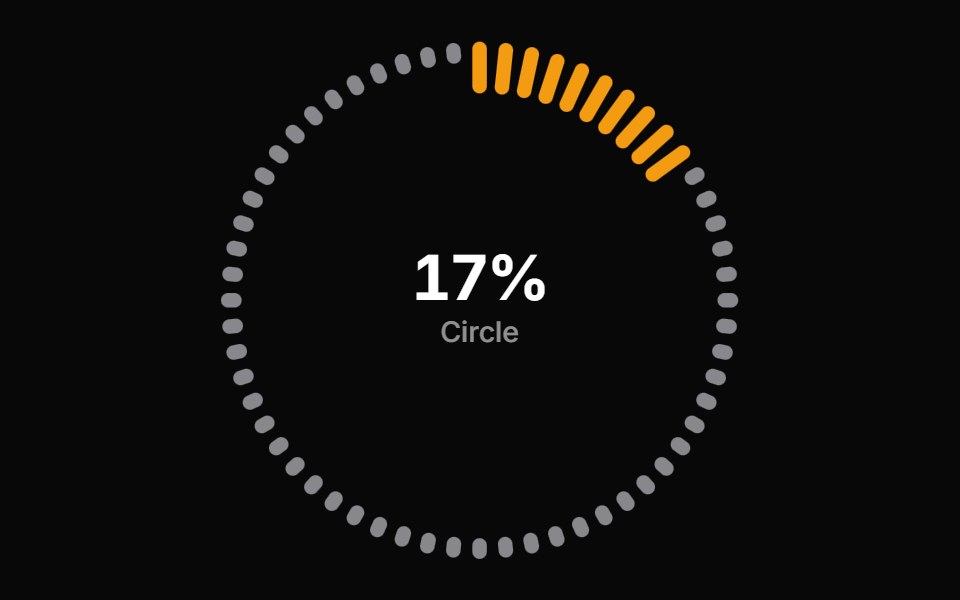 Progress Circle BarsReactFrame · ReactA circular progress indicator with ring, gauge, and dashes arc styles, scroll-triggered count-up animation, color…
 Segmented Arc MeterAmicro Micro Transitions · ReactStepped 4-bar discrete vertical gauge with percentage readout.
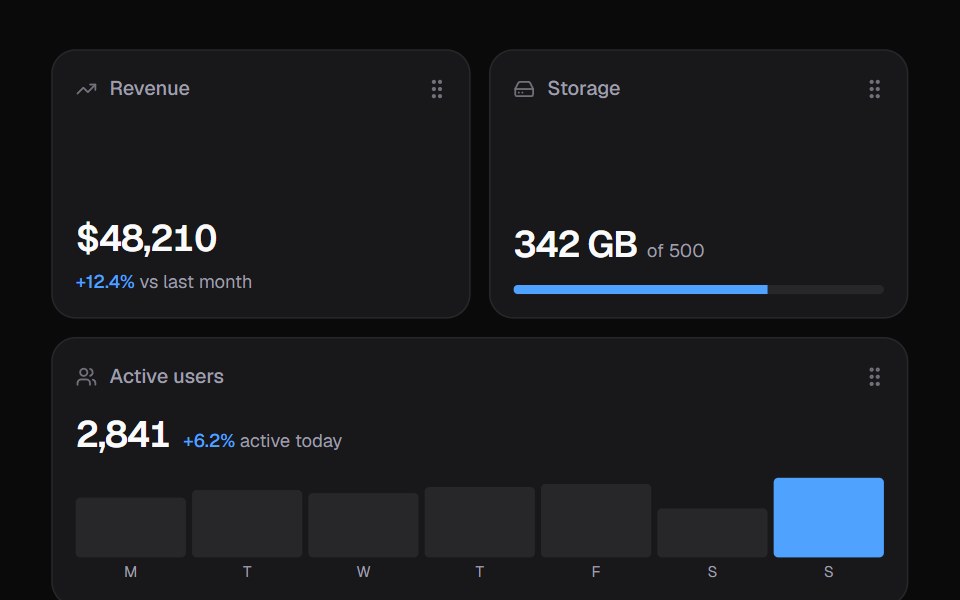 Widget GridKokonut UI · ReactDashboard widgets you lift, drag and resize on a 6-column grid, with spring physics and full keyboard support.
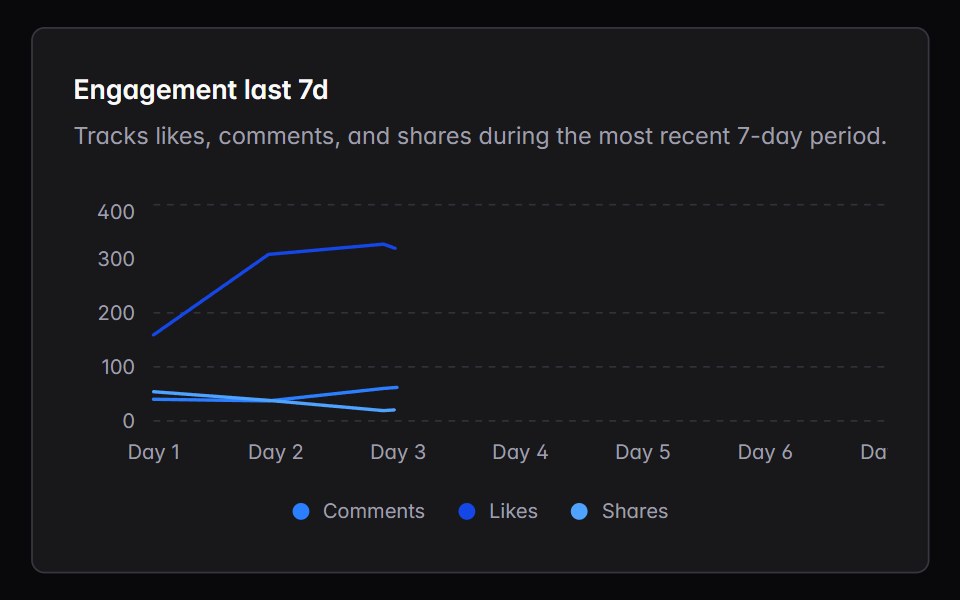 line-chartIntent UI · Reactline-chart
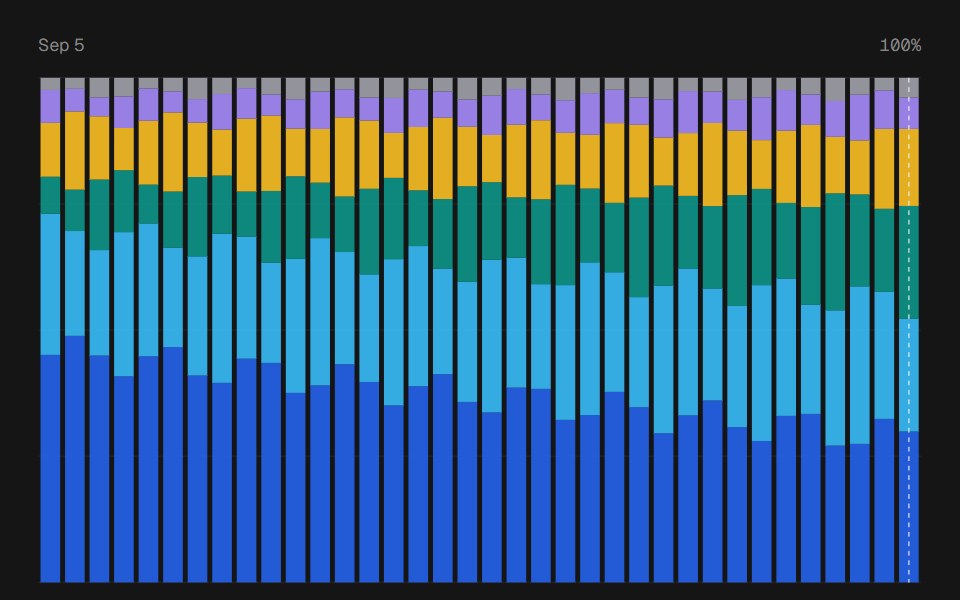 Composition ChartbeUI · ReactStacked bar and area shares with period tooltips and a compact interactive legend.
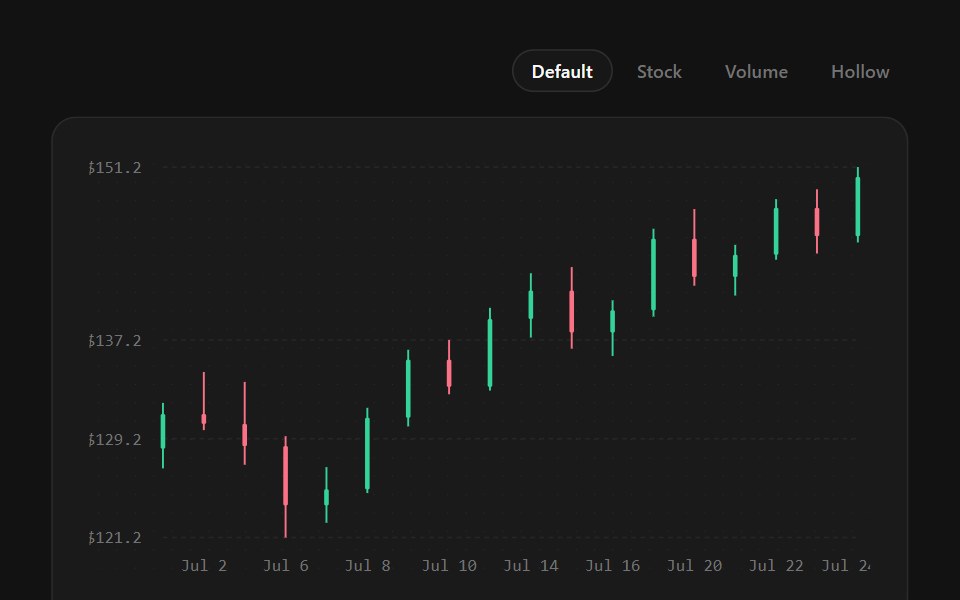 Candlestick ChartSpectrum UI · ReactOHLC candles with optional volume and hollow-up bodies — for stocks, SOL, and any market pair.
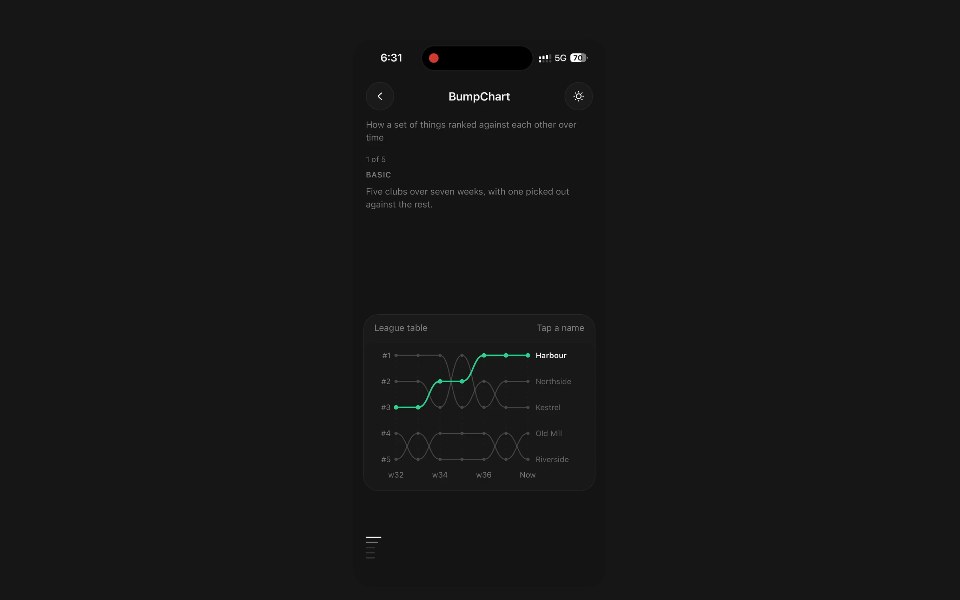 Bump ChartPanel UI · React NativeHow a set of things ranked against each other over time.
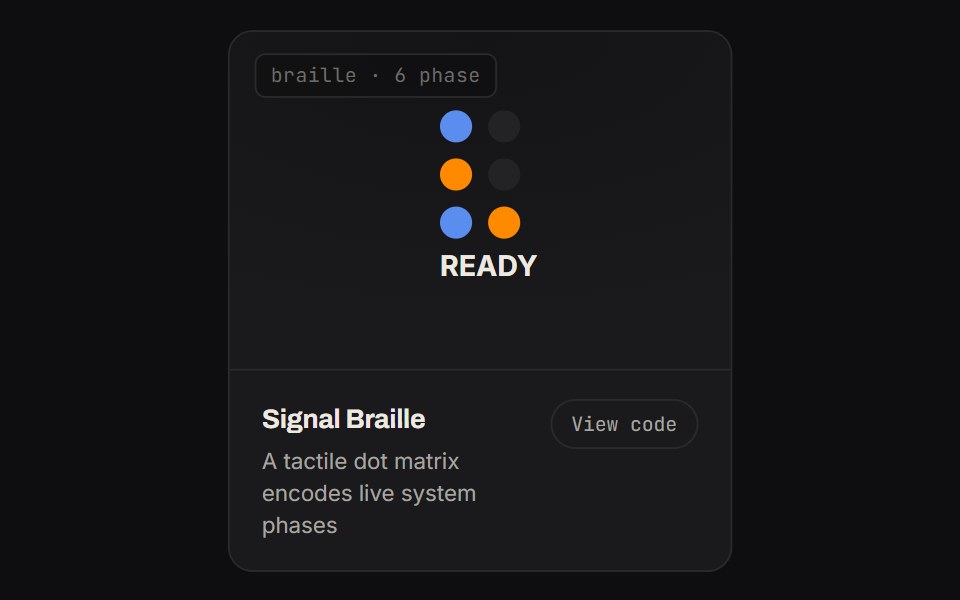 Signal BrailleKinetics · HTML/CSSA tactile dot matrix encodes live system phases
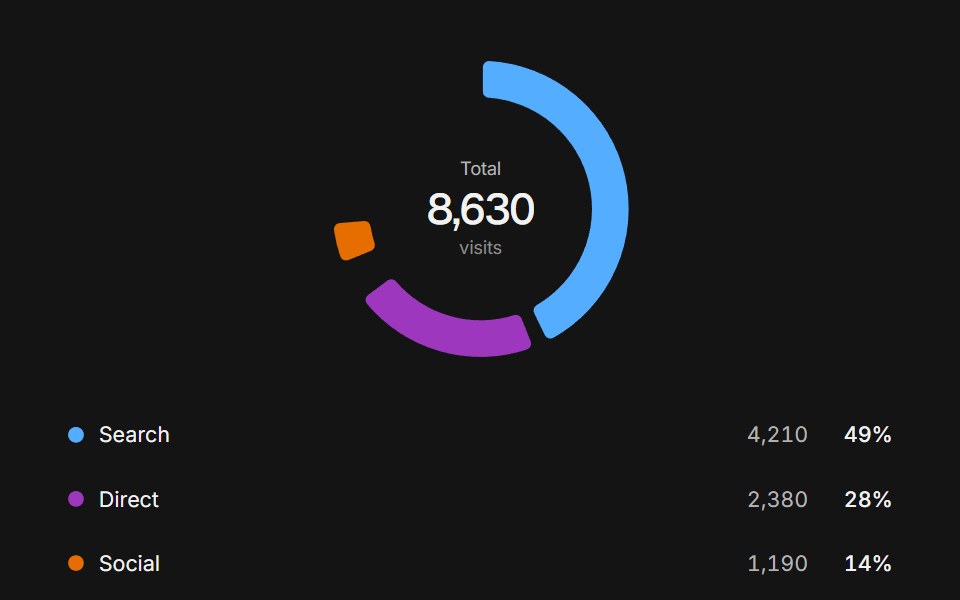 Donut chartArc Library · ReactA donut whose arcs morph between datasets, with the active value rolling into the center.
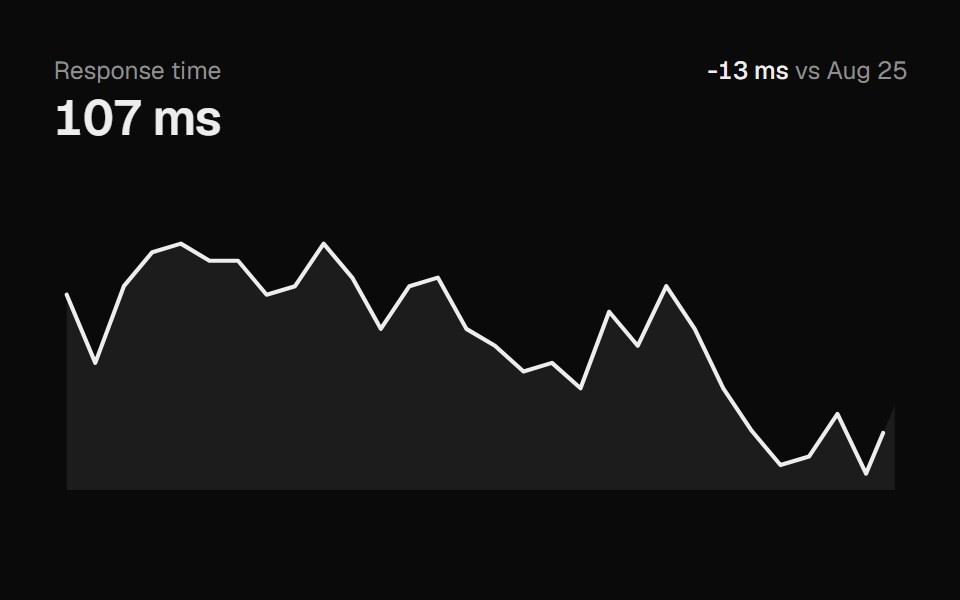 SparklineUI Lab · ReactDraws itself in, then scrubs to the nearest point under your cursor.
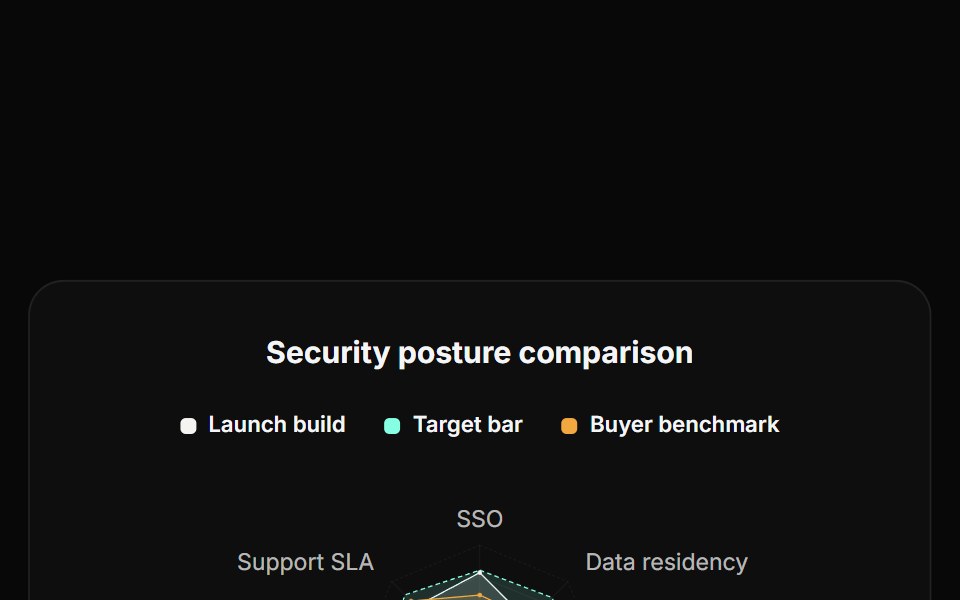 Radar ChartReactFrame · ReactA multi-series radar/spider chart with ring gridlines, per-series solid or dashed strokes, optional point markers, and…
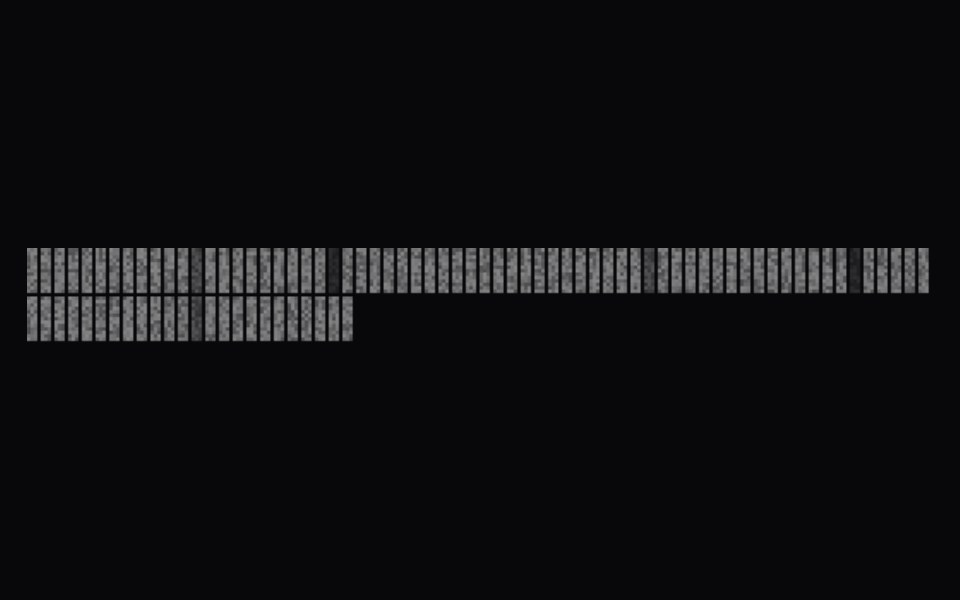 Uptime Dither Bar ChartAmicro Micro Transitions · ReactContinuous uptime bar chart with dithered matrix animation.
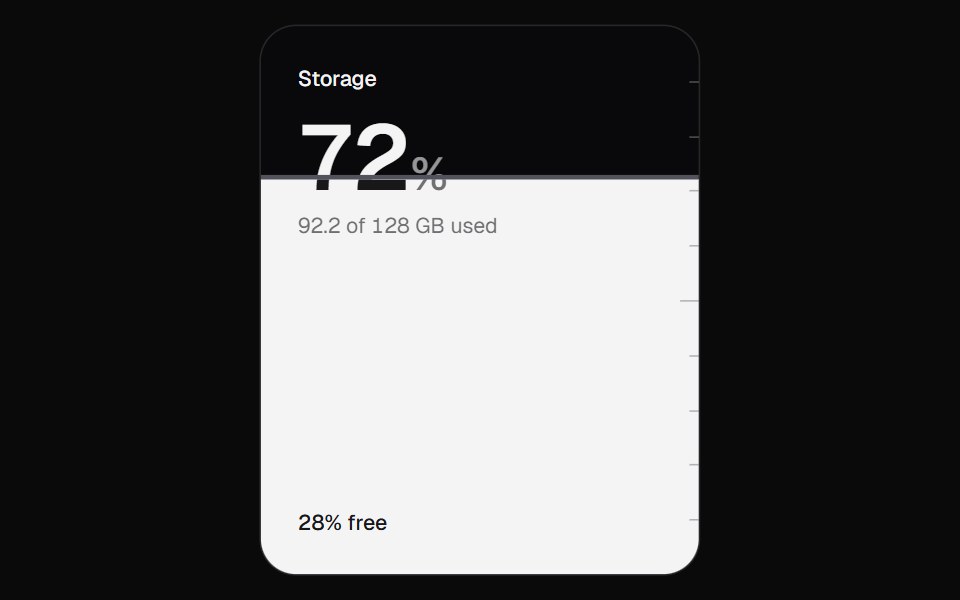 Liquid GaugeKokonut UI · ReactA usage meter filled with liquid that sloshes, ripples and bubbles, built with React and a wave simulation.
 pie-chartIntent UI · Reactpie-chart
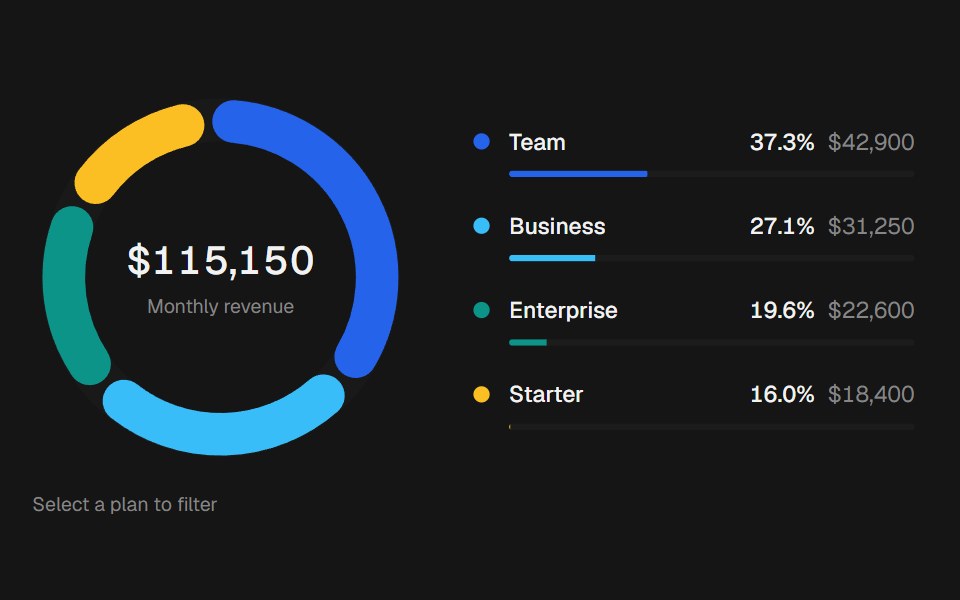 Donut ChartbeUI · ReactRounded share segments with a linked center readout and legend.
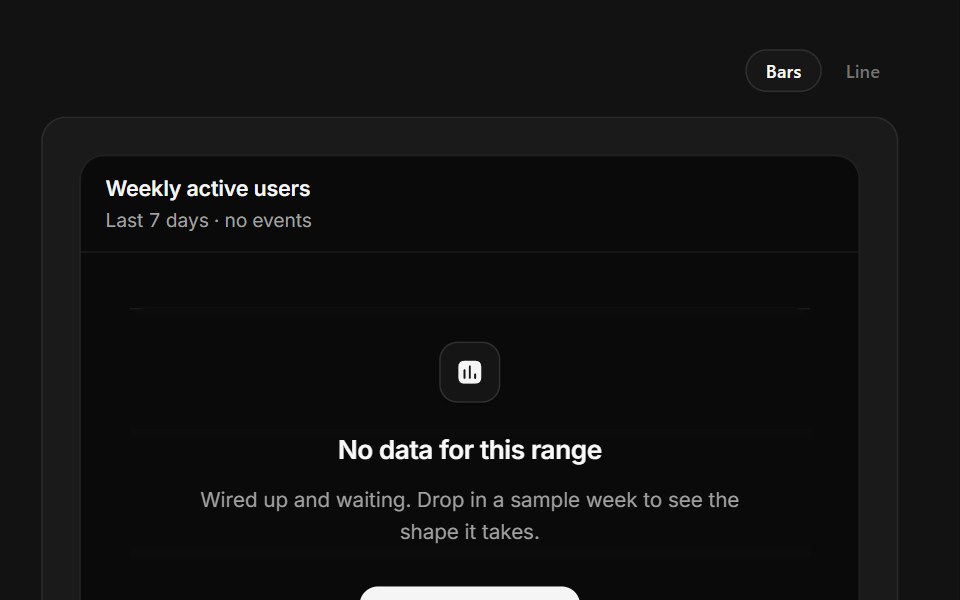 No Chart DataSpectrum UI · ReactGhost axes with a sample series that springs up on request.
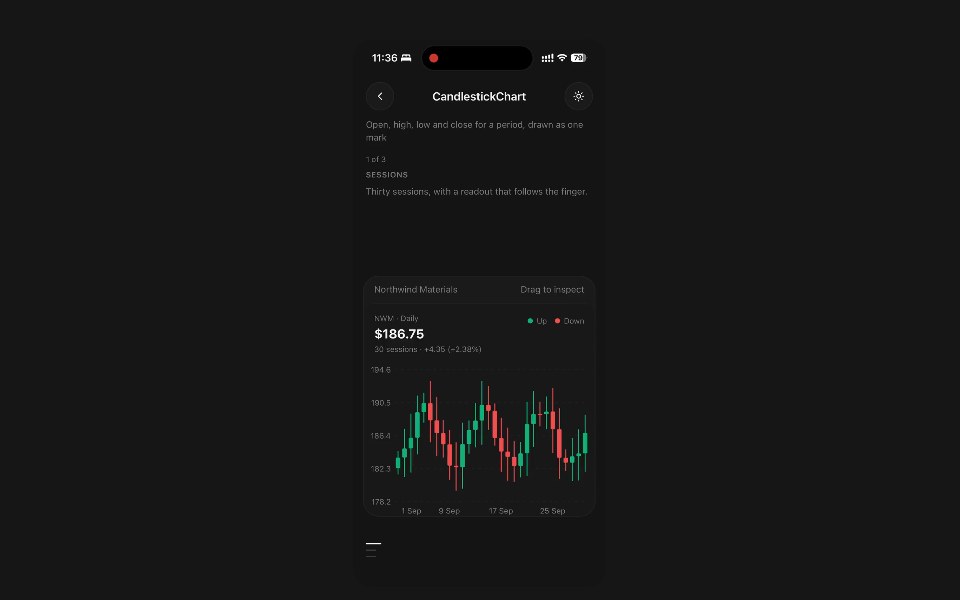 Candlestick ChartPanel UI · React NativeOpen, high, low and close for a period, drawn as one mark.
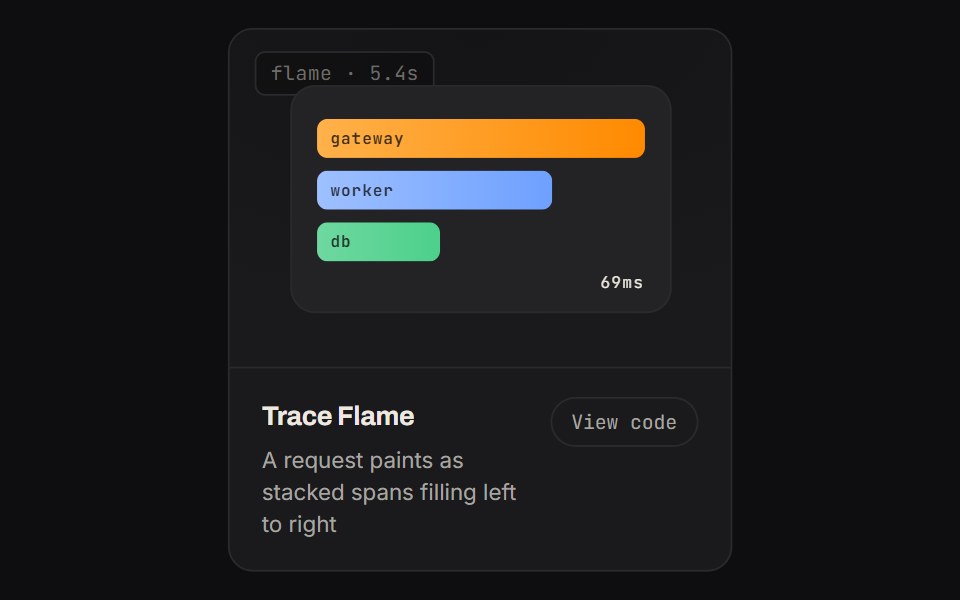 Trace FlameKinetics · HTML/CSSA request paints as stacked spans filling left to right
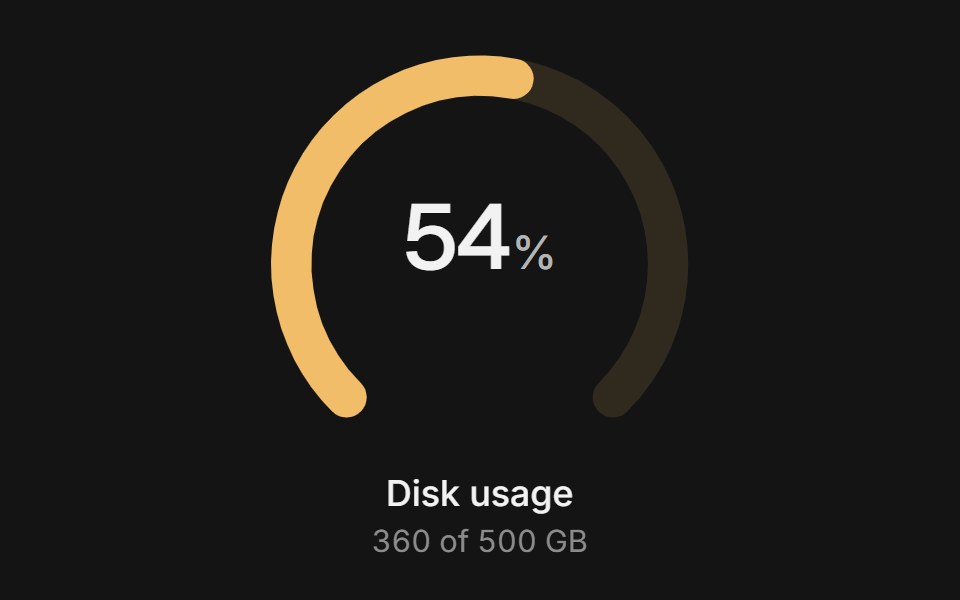 GaugeArc Library · ReactShow a value against a known range.
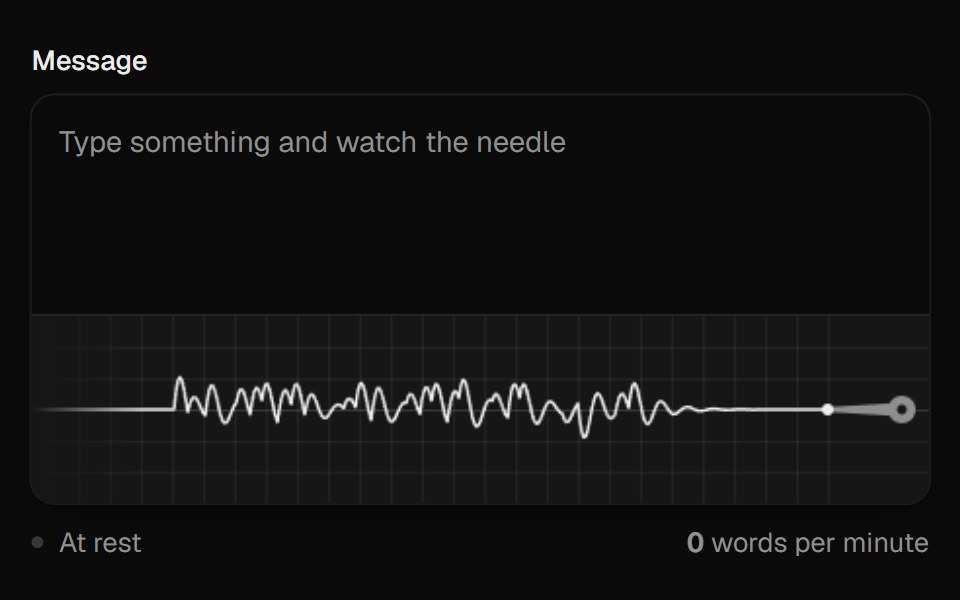 Typing SeismographUI Lab · ReactRecords the rhythm of your typing on a scrolling seismograph.
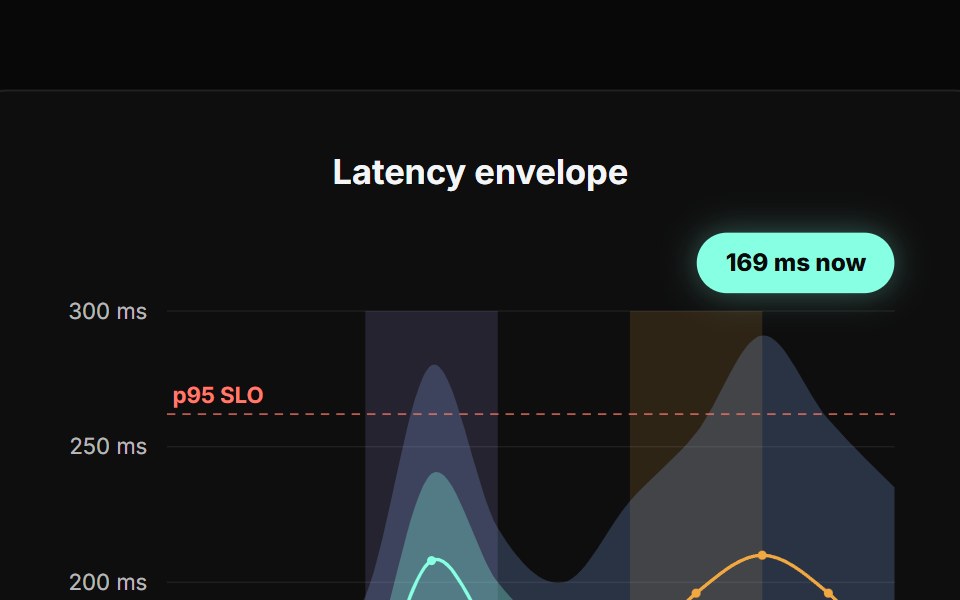 Range Area ChartReactFrame · ReactA min/max envelope chart with a nested core-range band, an actual-to-forecast line split, annotated risk zones, a…
 Device Usage ChartAmicro Micro Transitions · React
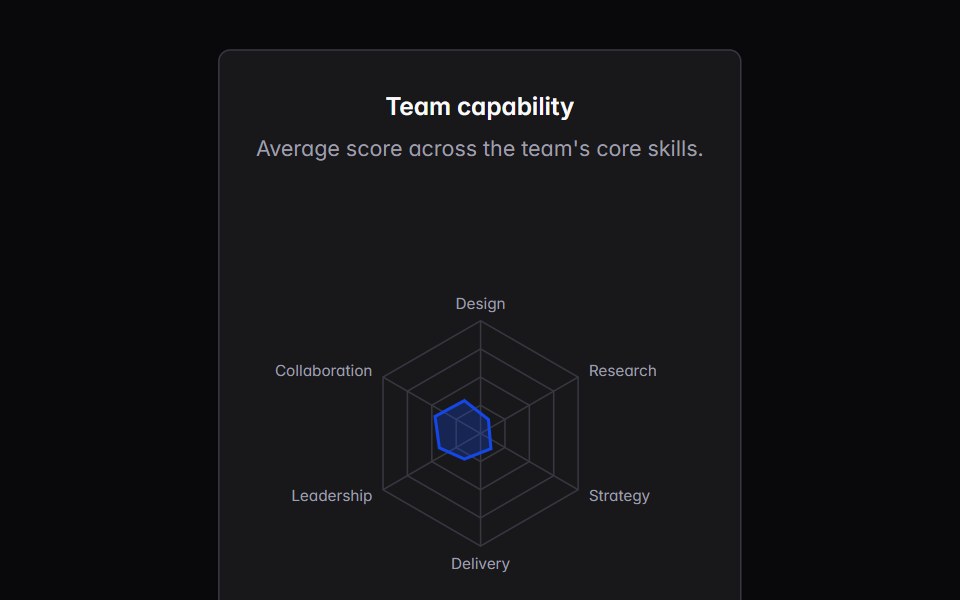 radar-chartIntent UI · Reactradar-chart
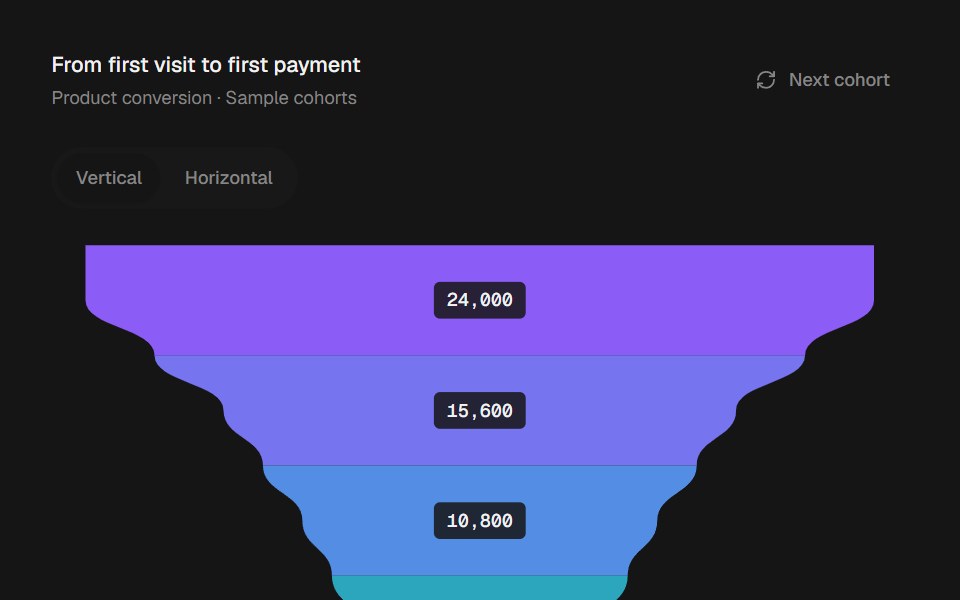 Funnel ChartbeUI · ReactVertical and horizontal funnels with curved stages and animated number tooltips.
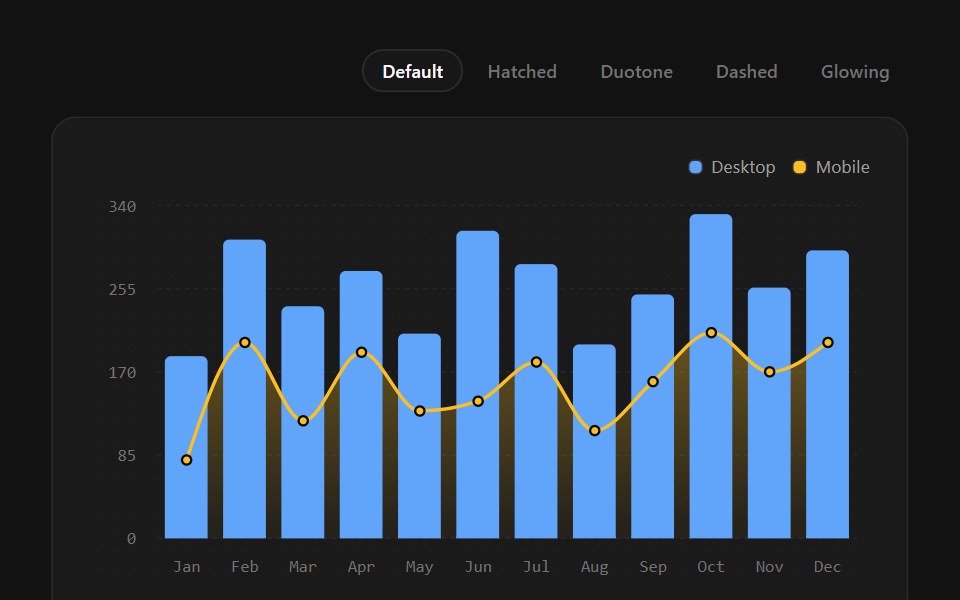 Composed ChartSpectrum UI · ReactBars, lines, and areas on one plot — mix fills, dashes, and glow per series.
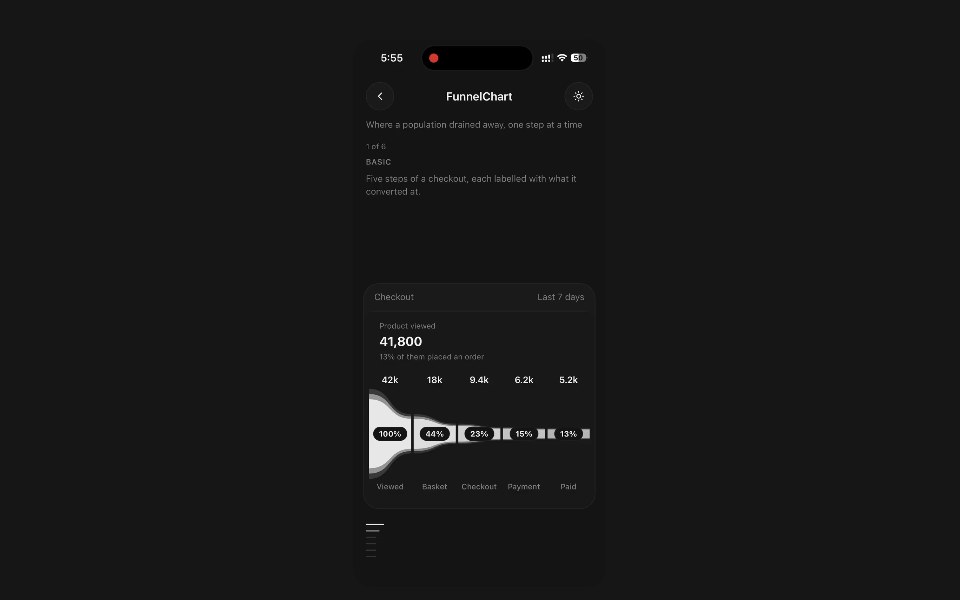 Funnel ChartPanel UI · React NativeWhere a population drained away, one step at a time.
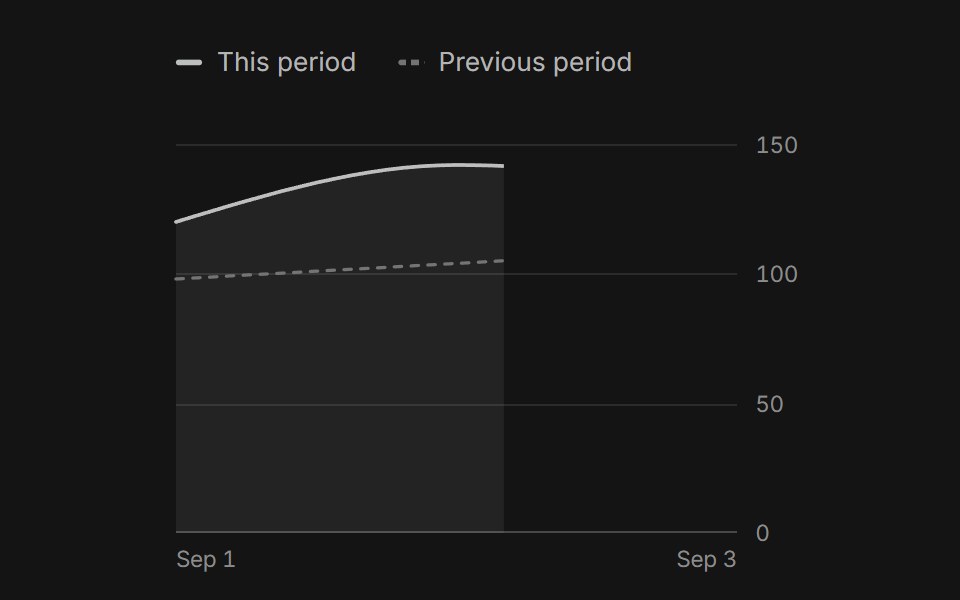 Line chartArc Library · ReactA multi-series line chart with a gliding crosshair, legend toggles, and paths that morph between ranges.
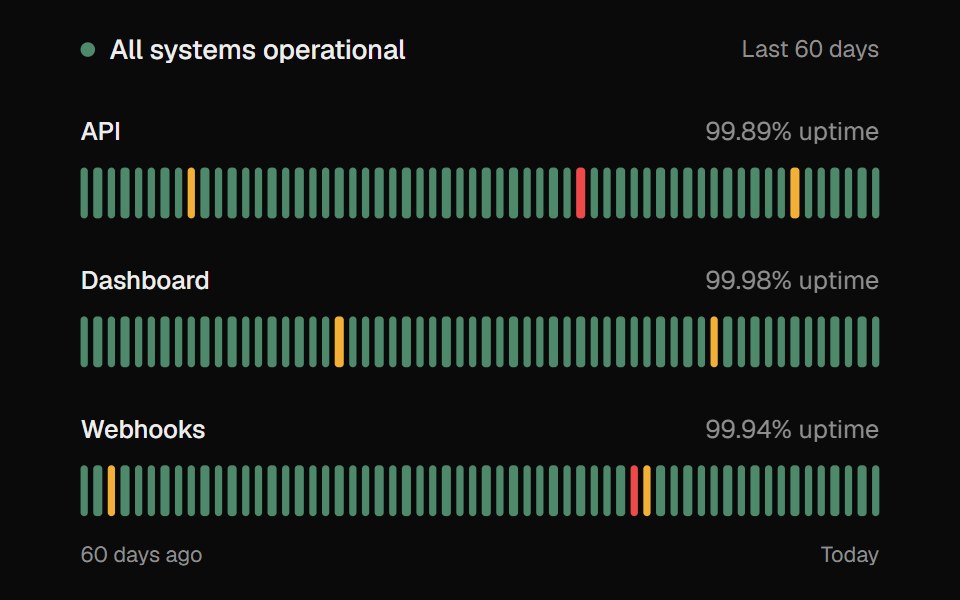 Uptime BarUI Lab · ReactPoint at any day and the row's own caption tells you what happened.
 Dither Funnel ChartAmicro Micro Transitions · React
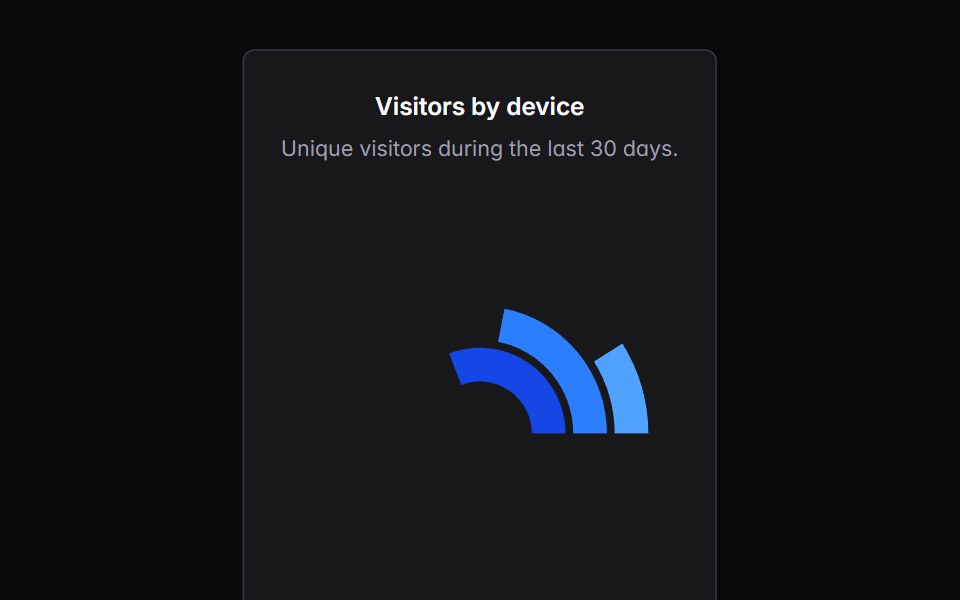 radial-bar-chartIntent UI · Reactradial-bar-chart
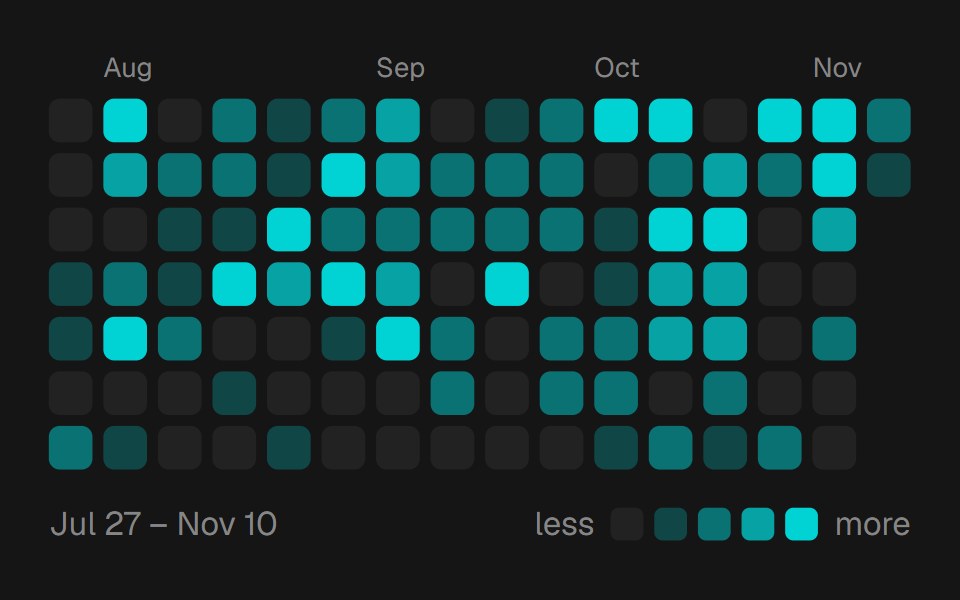 Heat CalendarbeUI · ReactCompose Grid, Tooltip and Legend, or omit children for the complete chart.
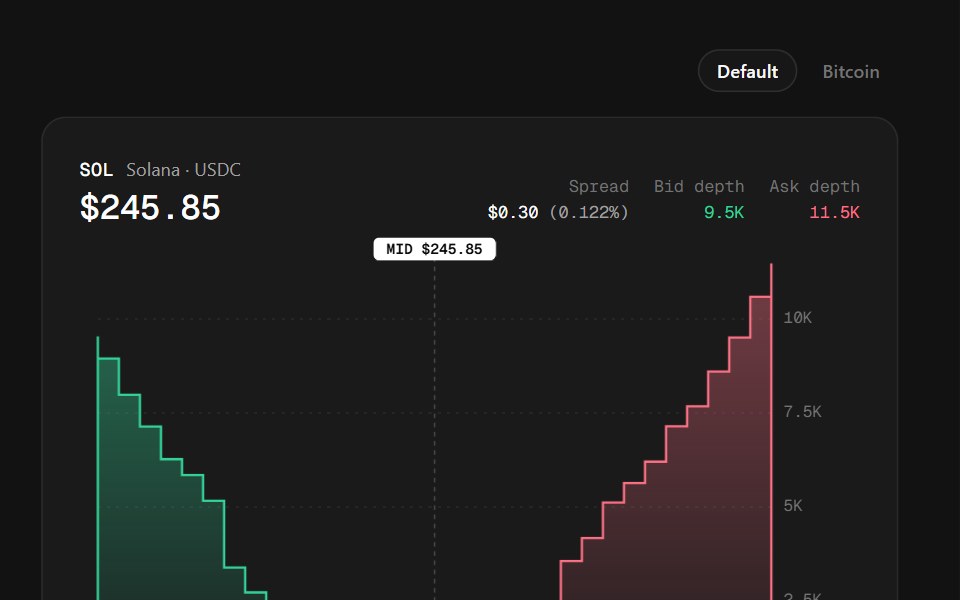 Depth ChartSpectrum UI · ReactCumulative bid and ask liquidity either side of the mid, with a crosshair that reports the size resting up to any price.
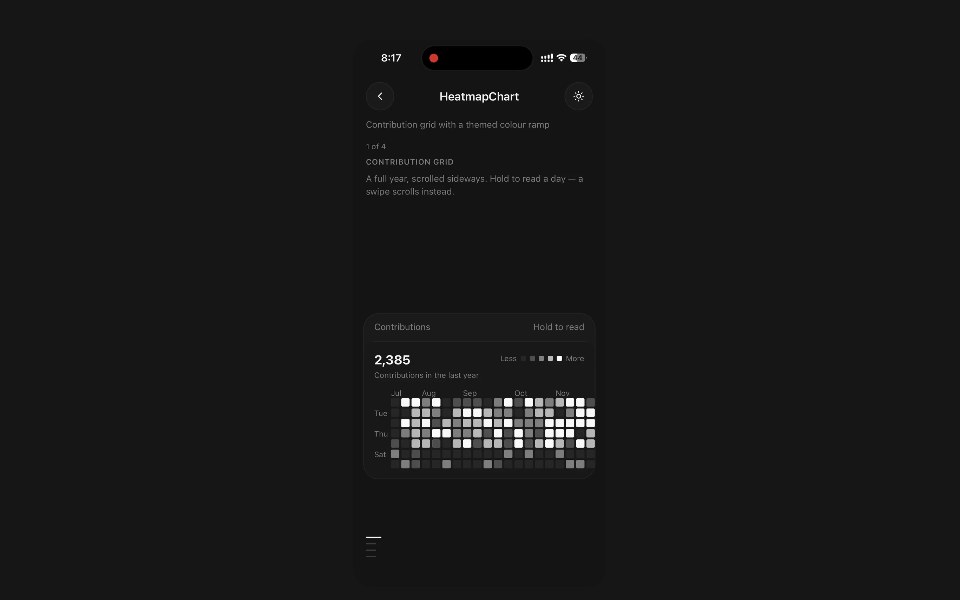 Heatmap ChartPanel UI · React NativeContribution grid with a themed colour ramp and a readout.
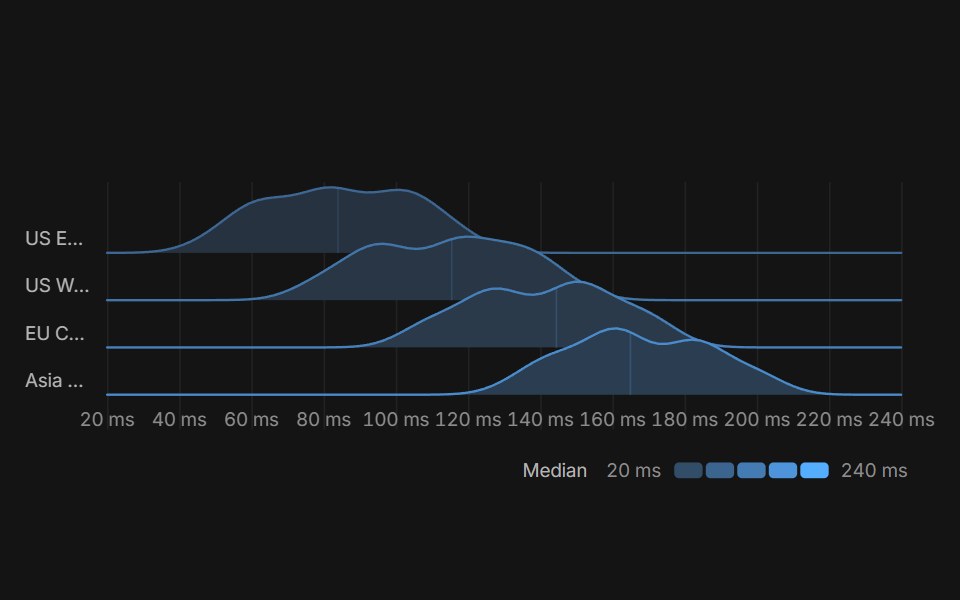 RidgelineArc Library · ReactOverlapping distributions, one ridge per group: hover to lift a ridge and read its quartiles, switch datasets and…
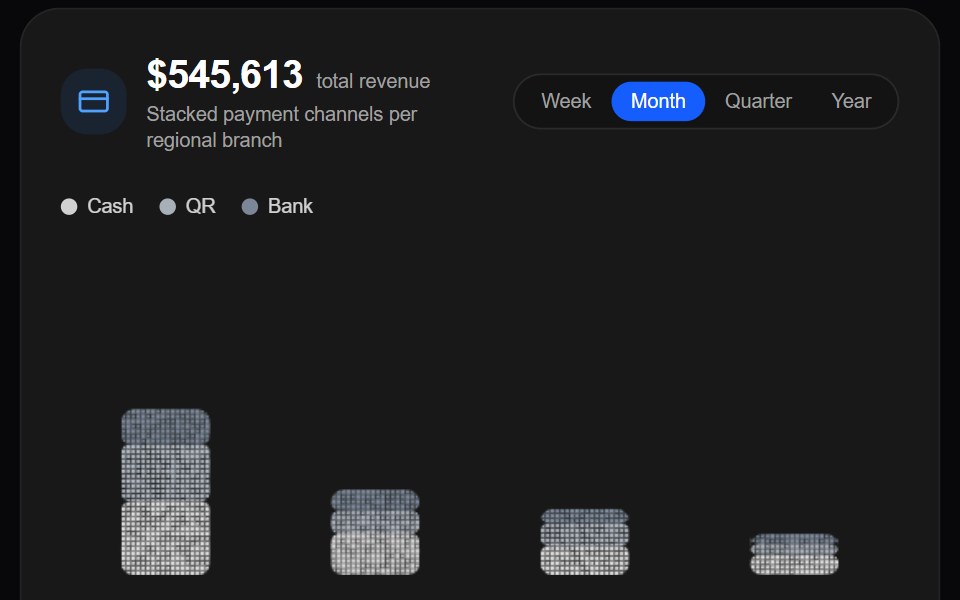 Dither Stacked ChartAmicro Micro Transitions · React
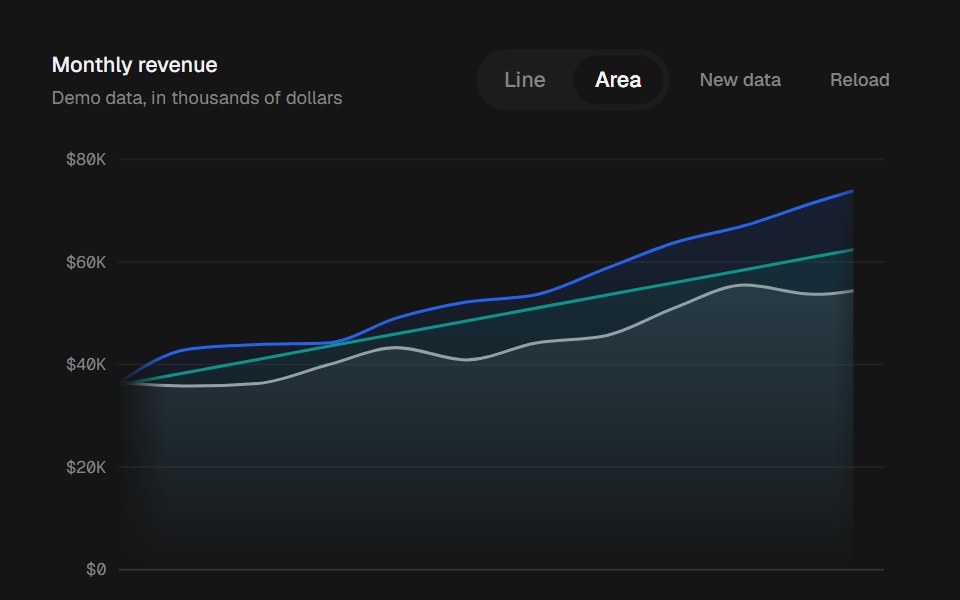 Line ChartbeUI · ReactLine and area charts that morph with your data, with a snapping crosshair and value tooltips.
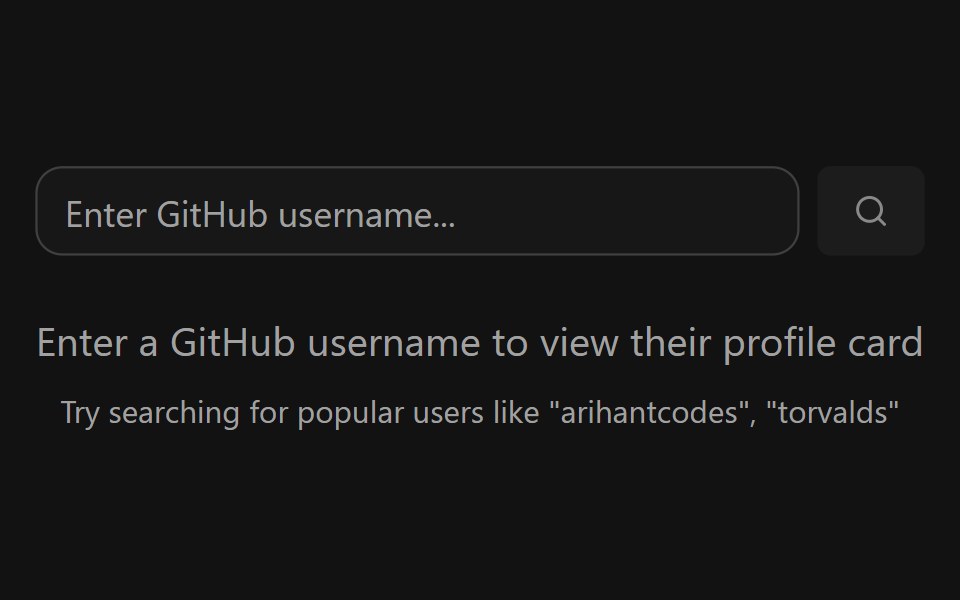 GitHub Profile CardSpectrum UI · ReactA GitHub profile card with account stats, a contribution graph, and social links.
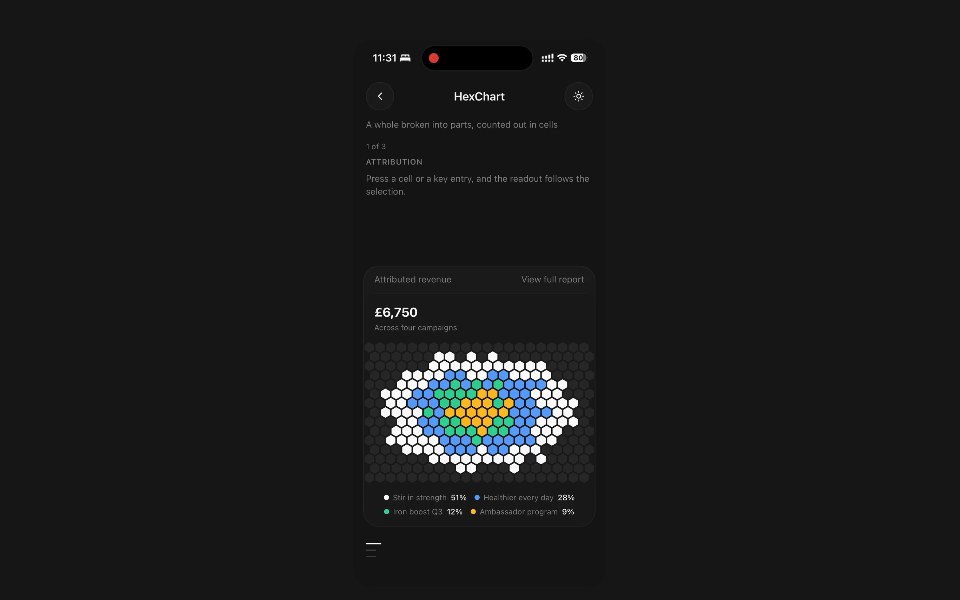 Hex ChartPanel UI · React NativeA whole broken into parts, counted out in cells.
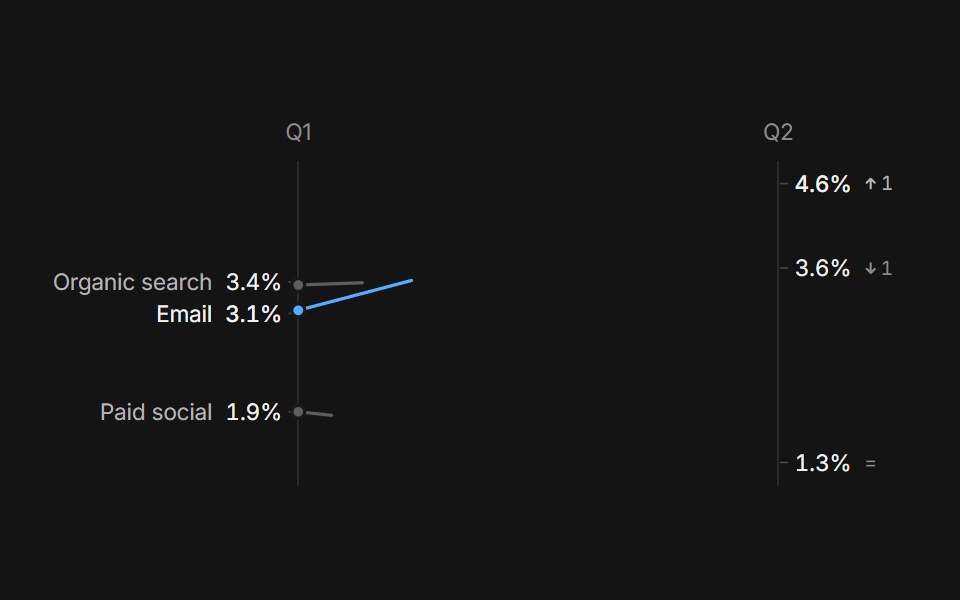 Slope chartArc Library · ReactBefore and after on two axes: lines draw in, rank moves sit beside each value, and switching datasets slides every…
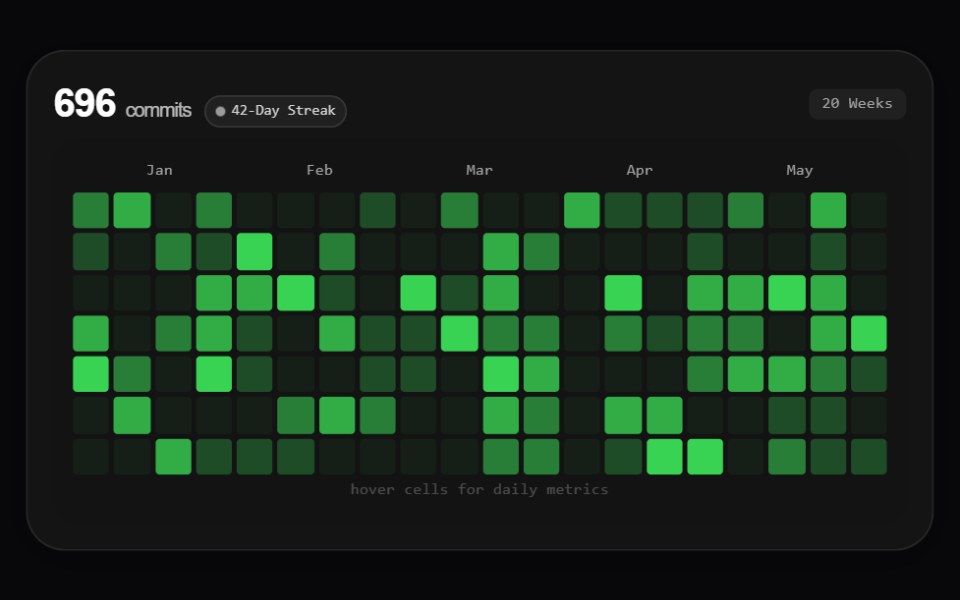 Mono Activity HeatmapAmicro Micro Transitions · React
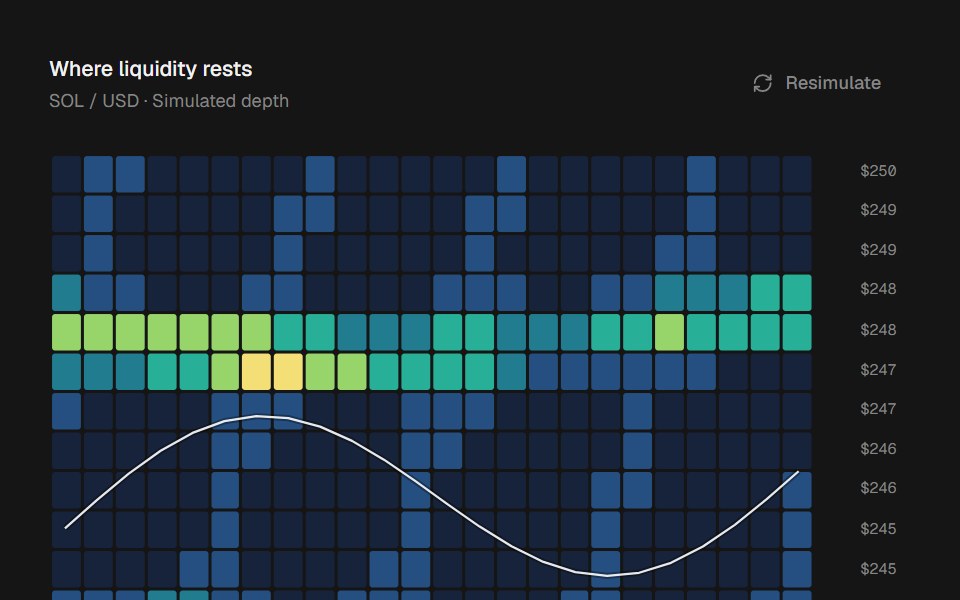 Liquidity HeatmapbeUI · ReactAnimated liquidity bands across price and time, with a price trace and depth tooltips.
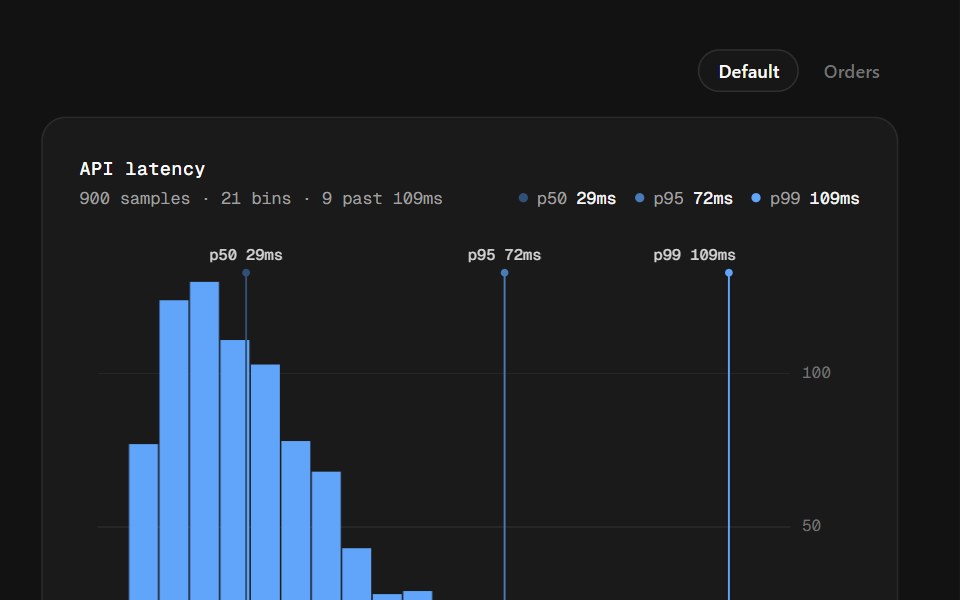 HistogramSpectrum UI · ReactA distribution of raw samples binned on nice edges, with p50 / p95 / p99 pinned onto the plot — the chart that shows…
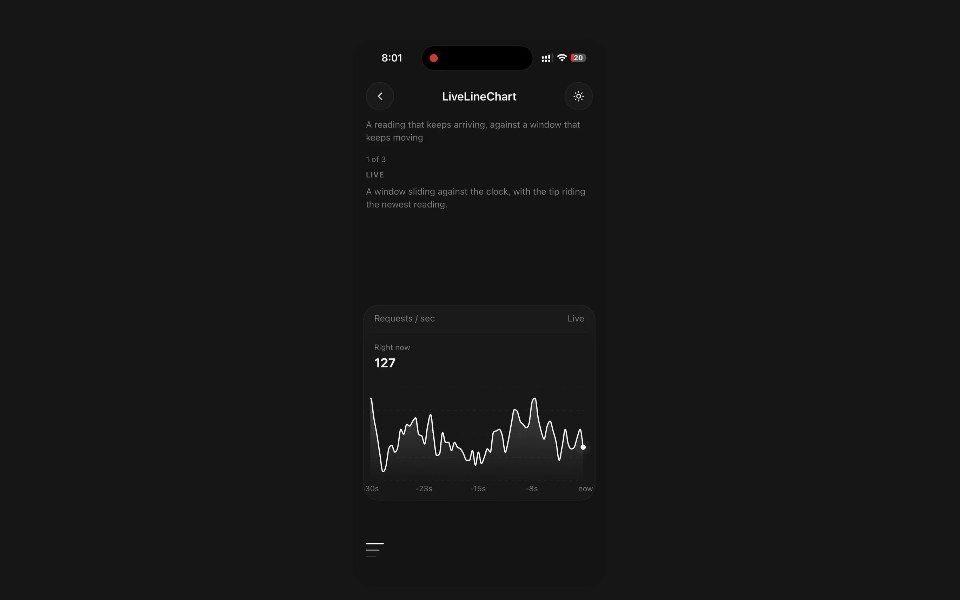 Live Line ChartPanel UI · React NativeA reading that keeps arriving, against a window that keeps moving.
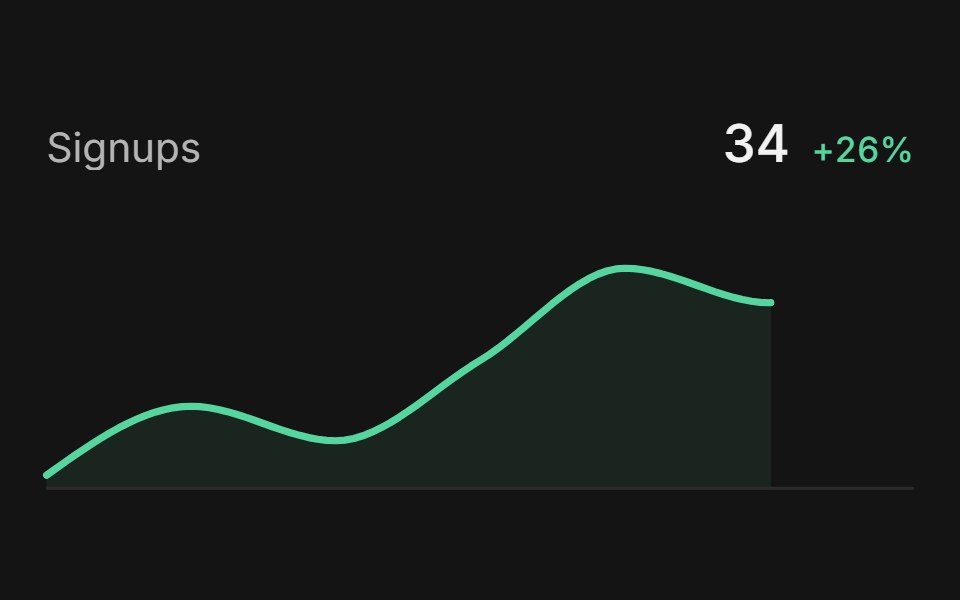 SparklineArc Library · ReactShow a compact trend beside a value.
 Mono Rounded Area ChartAmicro Micro Transitions · React
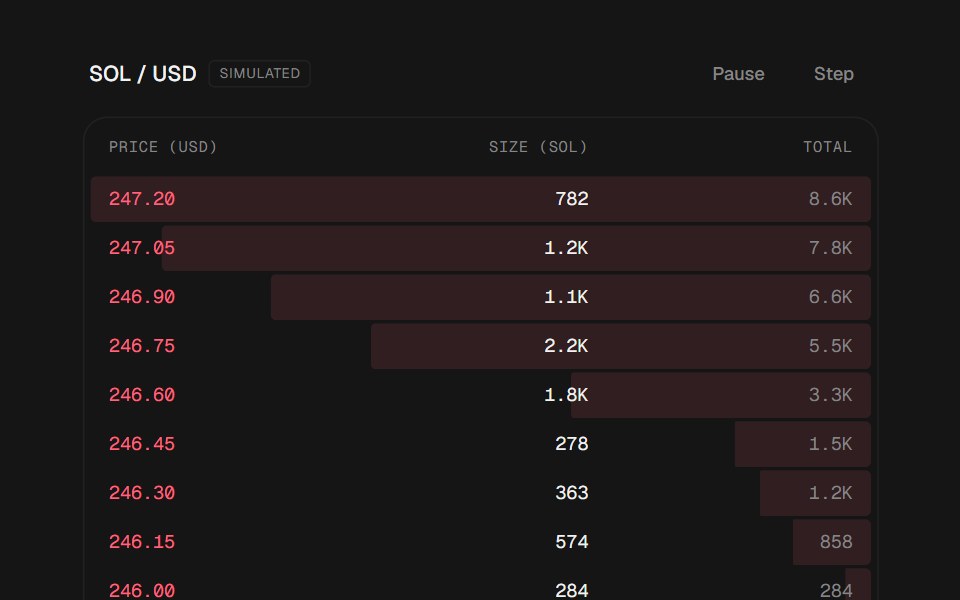 Order BookbeUI · ReactAnimated order book with bid and ask depth, spread, and volume balance.
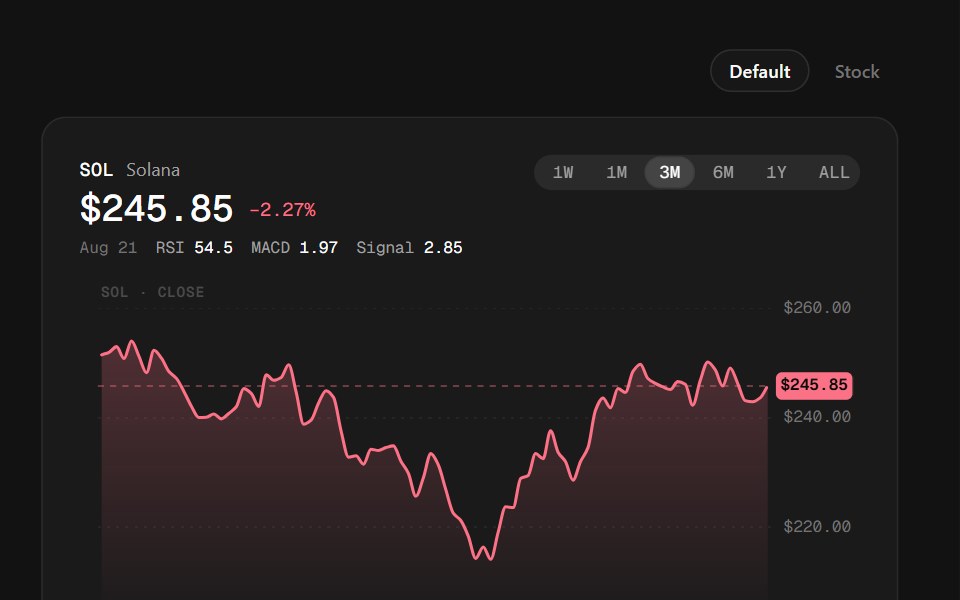 Indicator ChartSpectrum UI · ReactPrice, RSI and MACD stacked on one time axis with a single crosshair that reports all three panes at once.
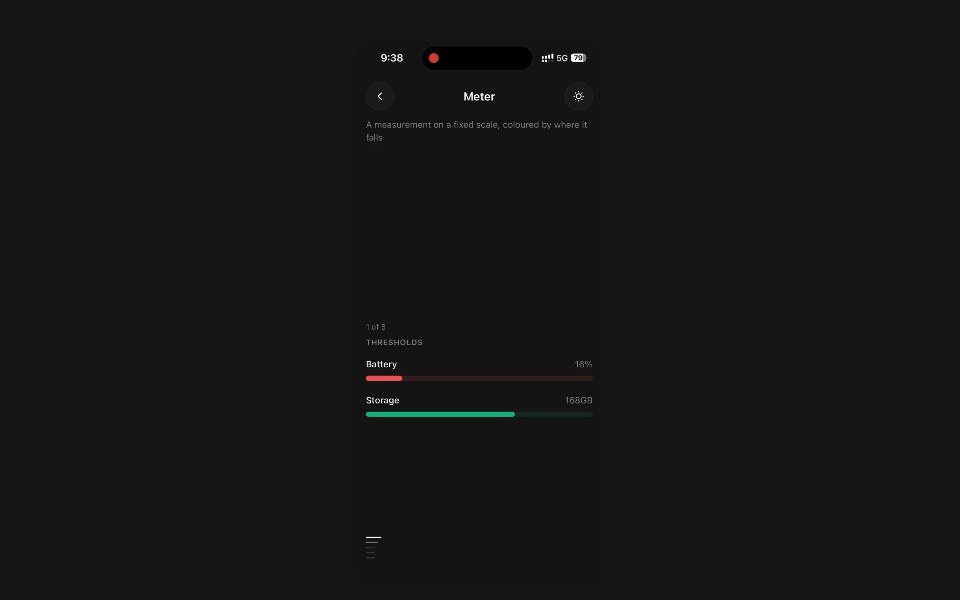 MeterPanel UI · React NativeA measurement on a fixed scale, coloured by where it falls.
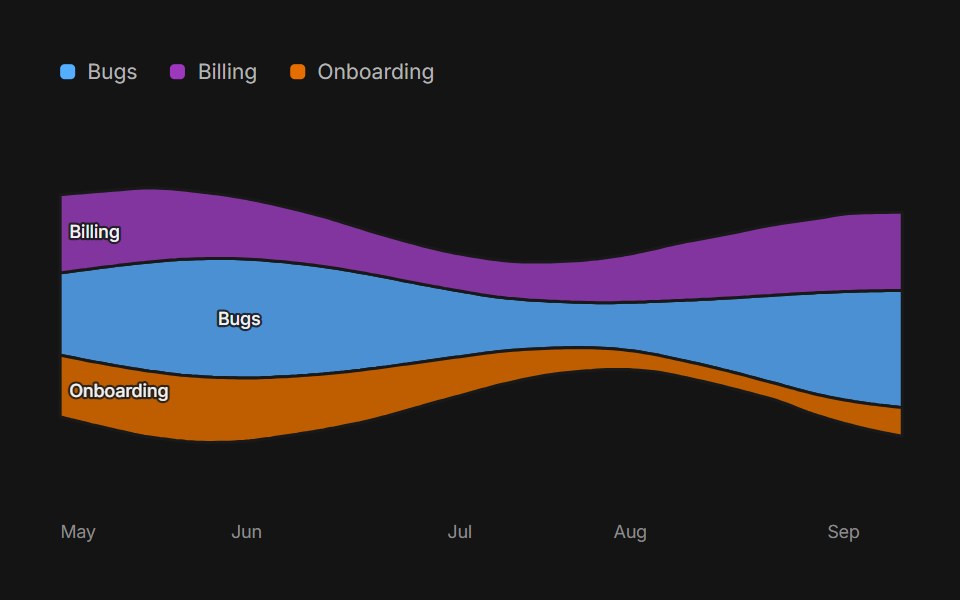 StreamgraphArc Library · ReactLayered streams on a wiggle baseline that morph between ranges, with a layer you can isolate and read week by week.
 Mono Rounded Bar ChartAmicro Micro Transitions · React
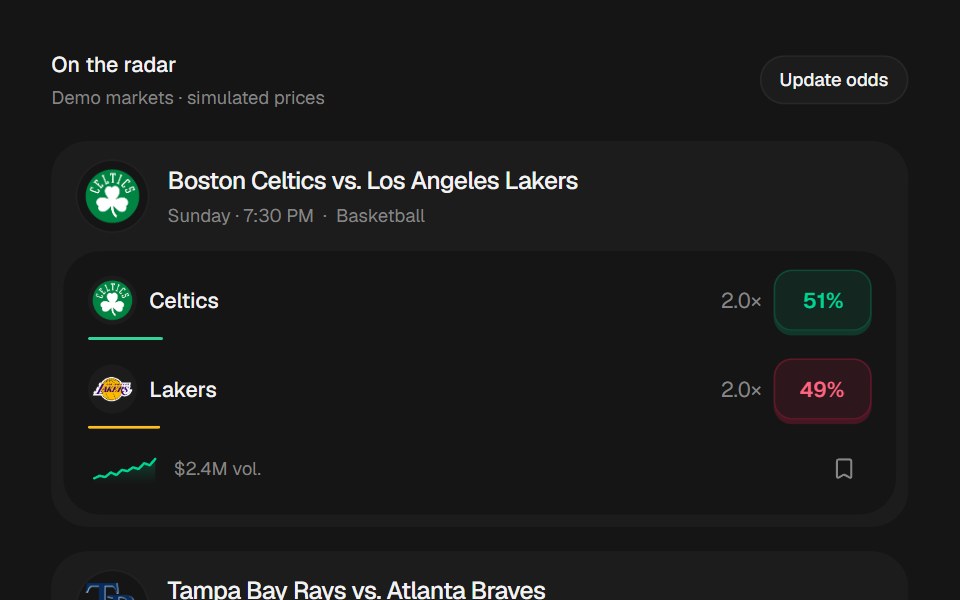 Prediction Market CardbeUI · ReactA listing surface with outcome CTAs and an independent bookmark toggle.
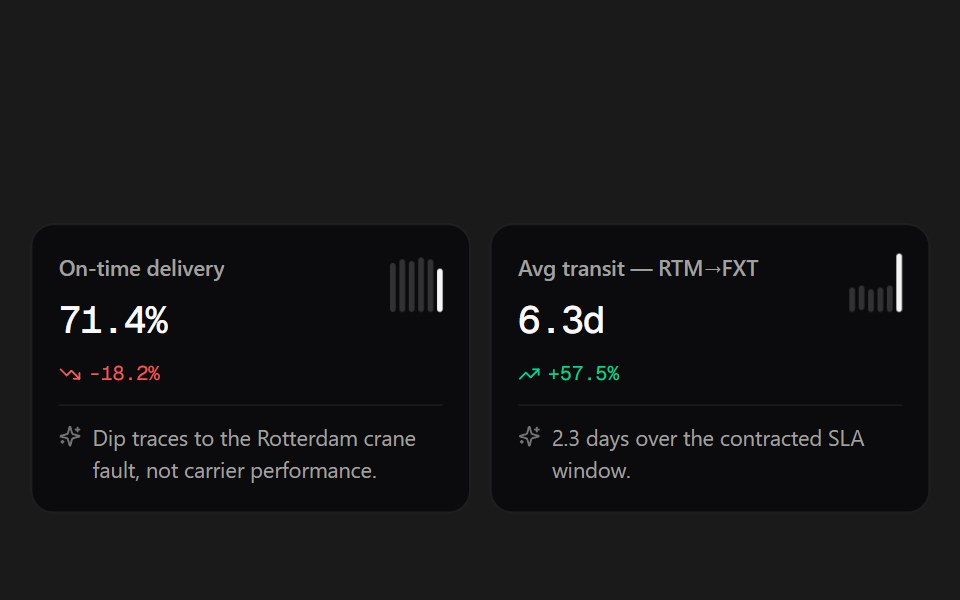 Insight CardsSpectrum UI · ReactMetric cards with spark bars, trend deltas, and an AI note.
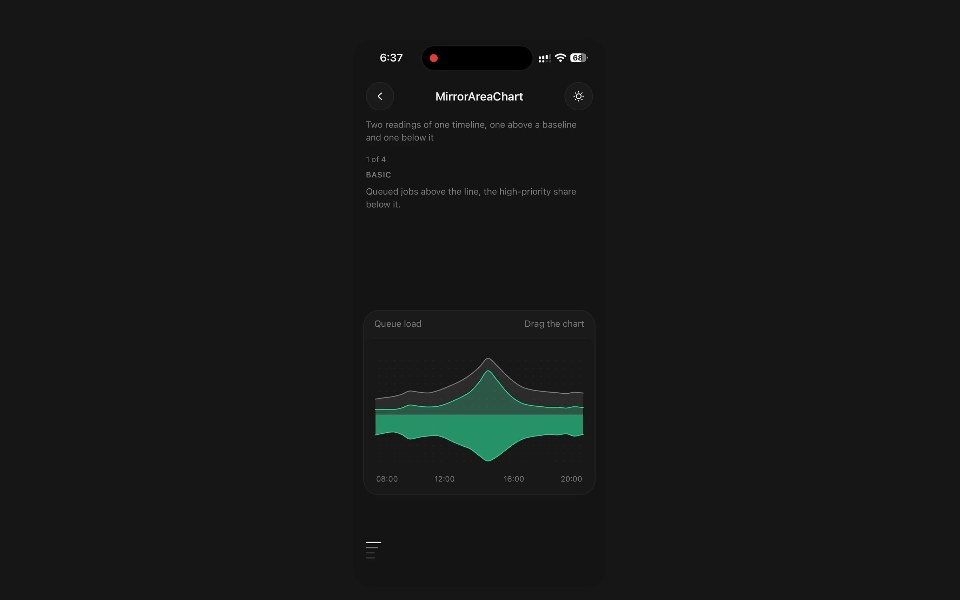 Mirror Area ChartPanel UI · React NativeTwo readings of one timeline, one above a baseline and one below it.
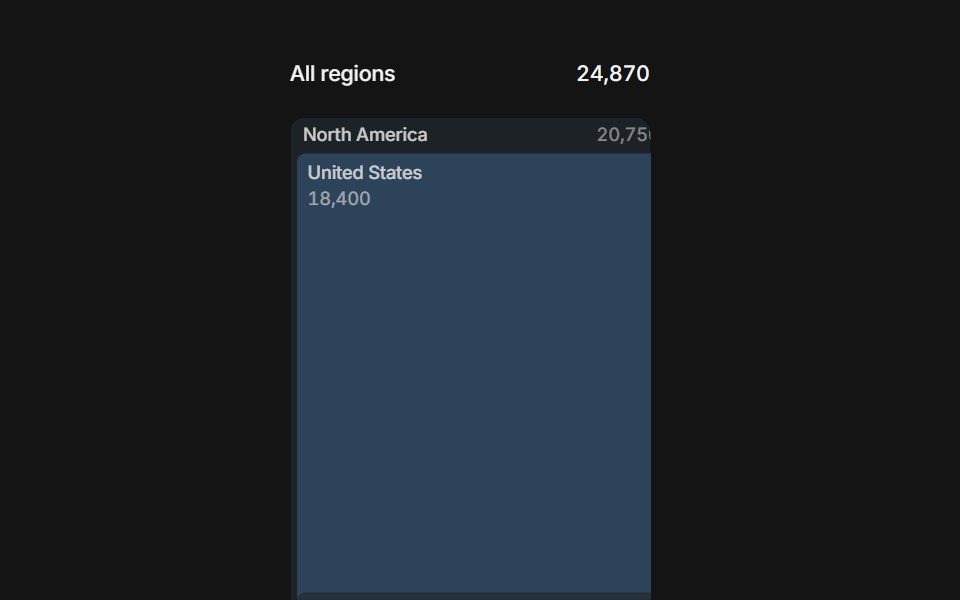 TreemapArc Library · ReactA squarified treemap: click to drill and the tiles grow to fill the view, with a breadcrumb back and metrics that…
 Mono Rounded Bubble ChartAmicro Micro Transitions · React
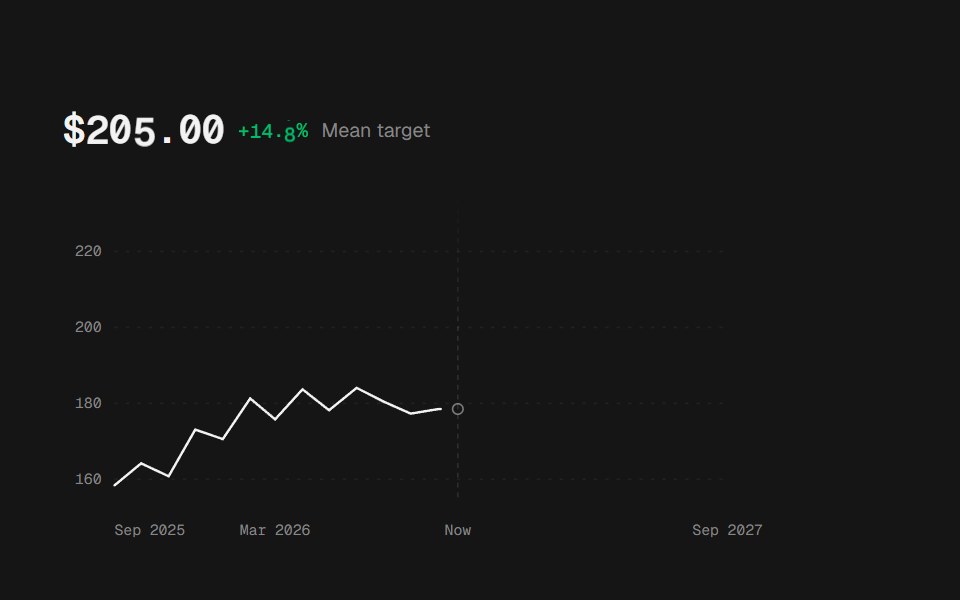 Price Target FanbeUI · ReactOwns chart data and interaction; children may replace or rearrange the default parts.
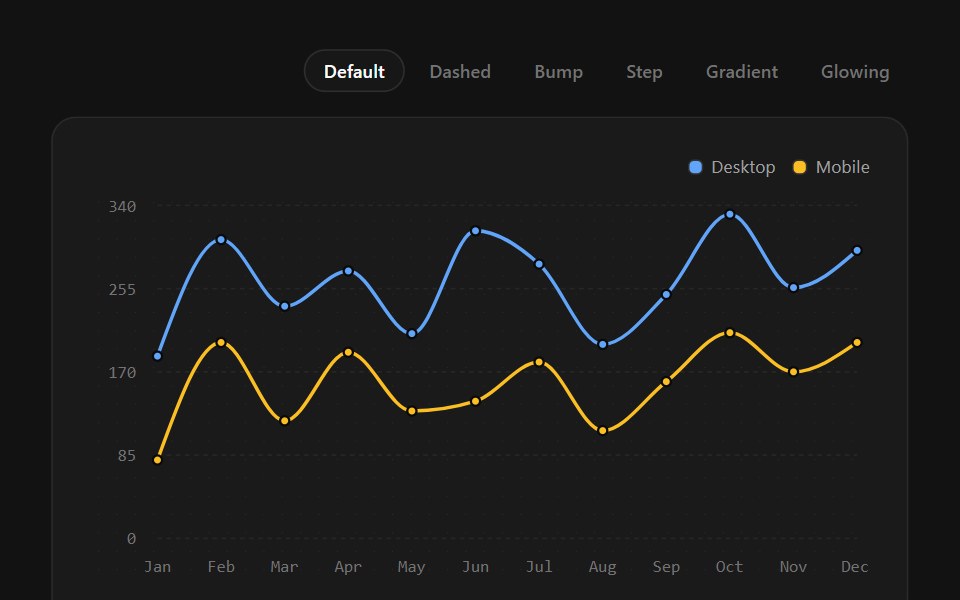 Line ChartSpectrum UI · ReactMulti-series lines with solid, dashed, bump, step, gradient, and glow strokes.
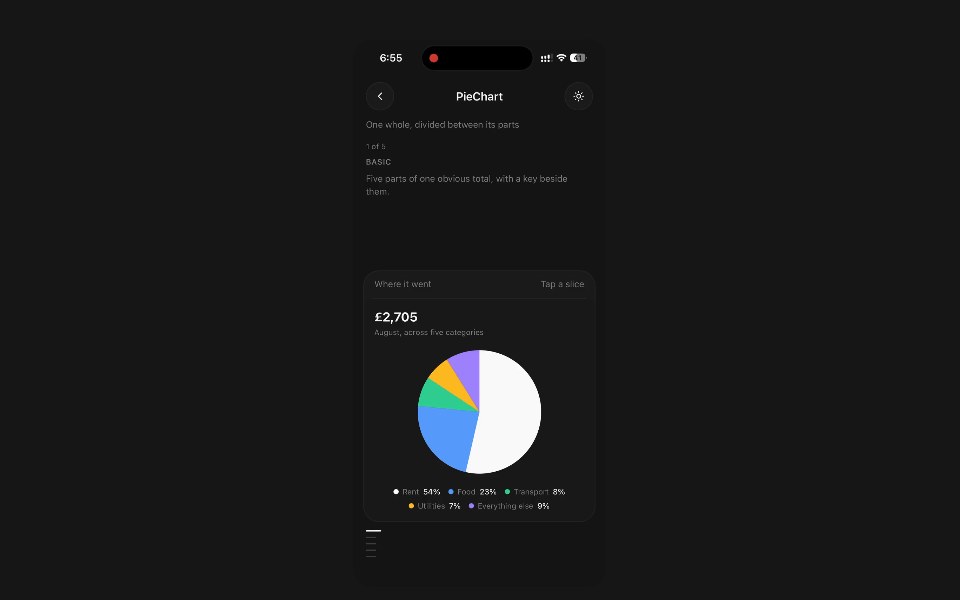 Pie ChartPanel UI · React NativeOne whole, divided between its parts.
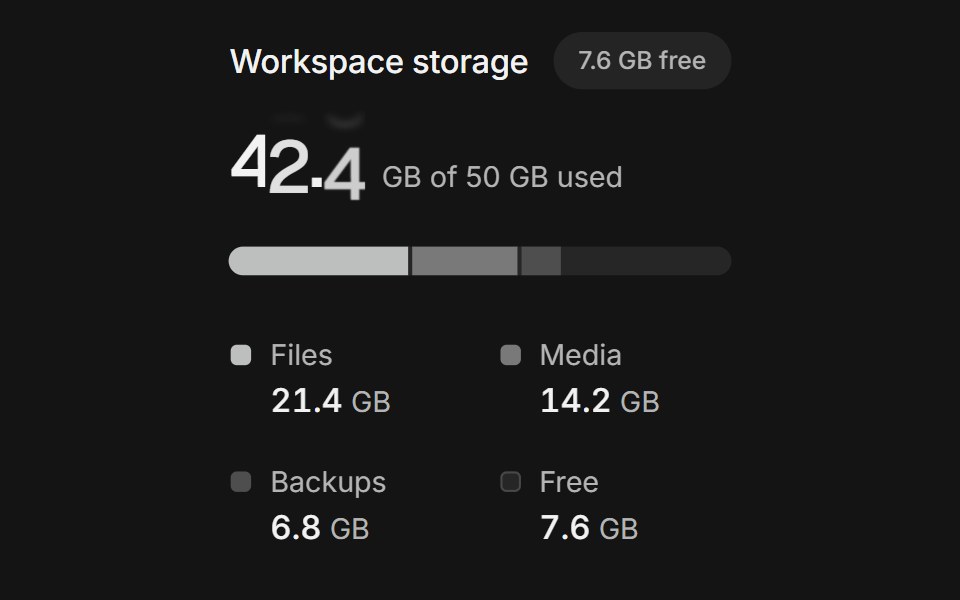 Usage meterArc Library · ReactShow what fills an allowance and how close it is to the limit.
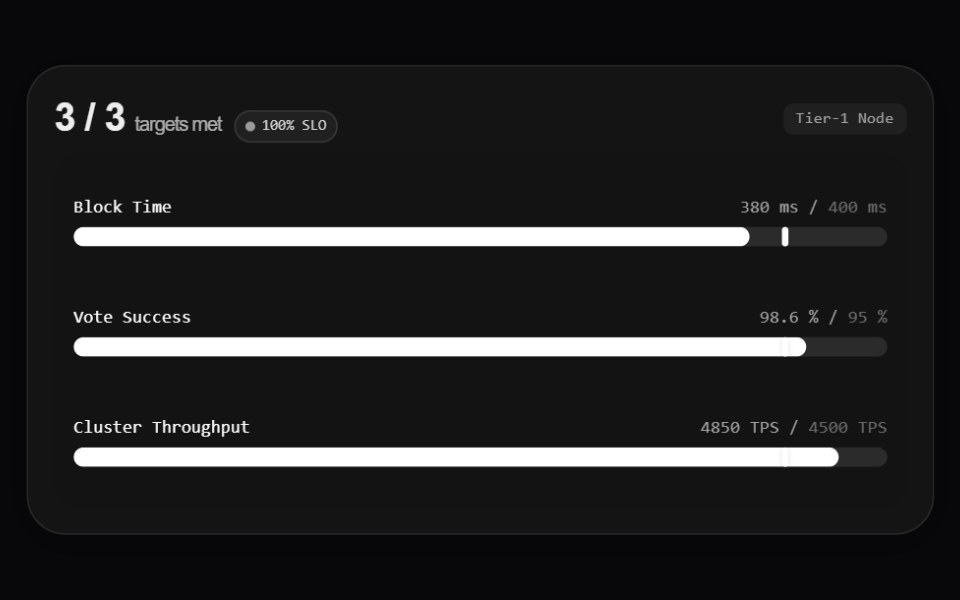 Mono Rounded Bullet ChartAmicro Micro Transitions · React
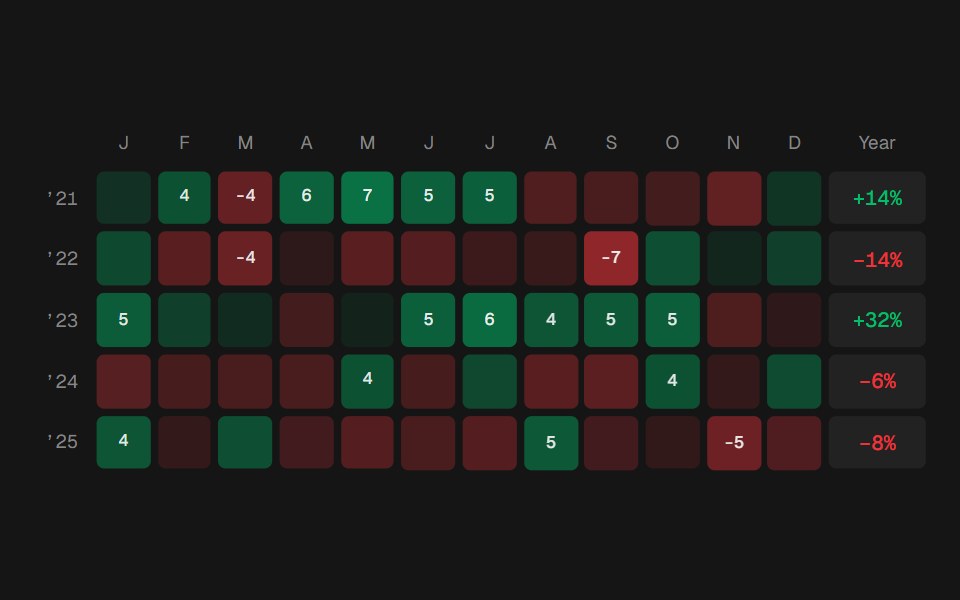 Returns CalendarbeUI · ReactCompose Grid and Tooltip, or omit children for the complete chart.
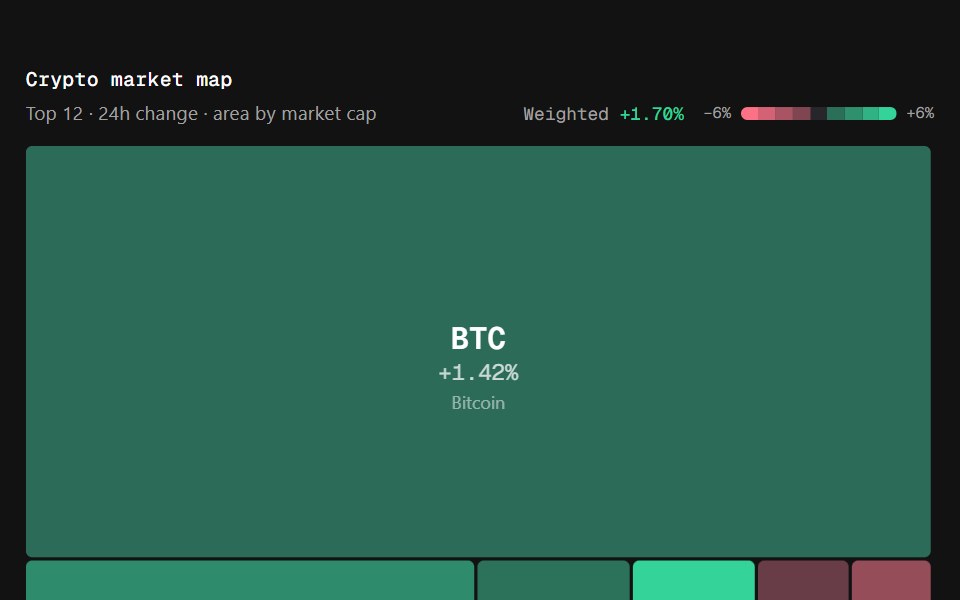 Market HeatmapSpectrum UI · ReactA squarified treemap sized by market cap and coloured on a diverging change ramp — the market map.
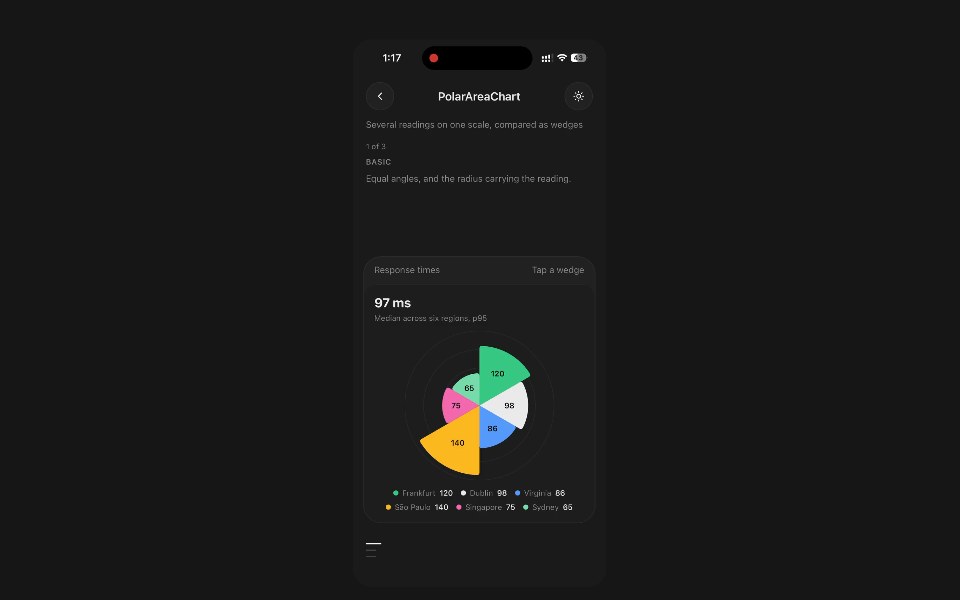 Polar Area ChartPanel UI · React NativeSeveral readings on one scale, compared as wedges.
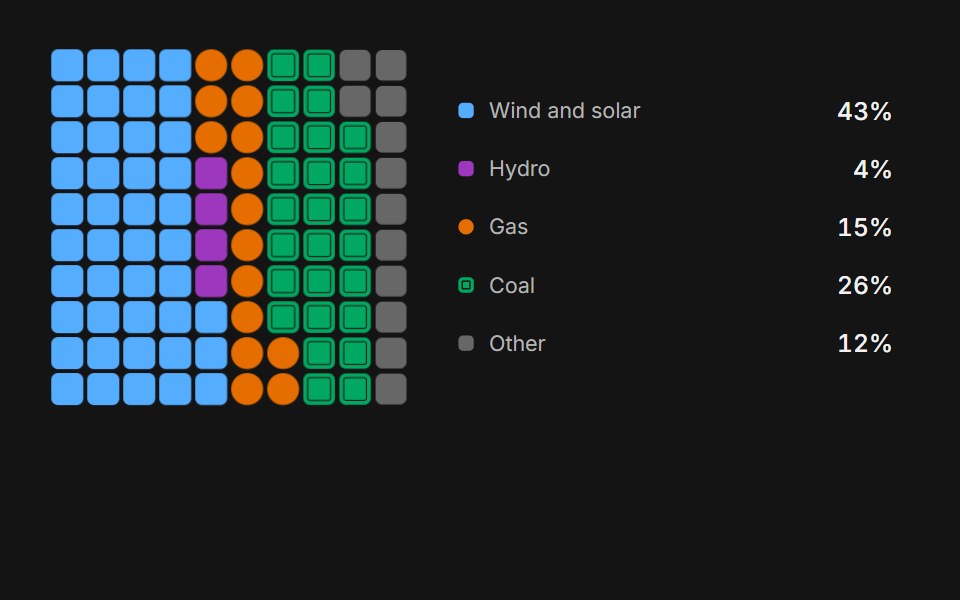 Waffle chartArc Library · ReactA ten by ten unit chart where every cell is one percent, and cells fly to their new group when the data changes.
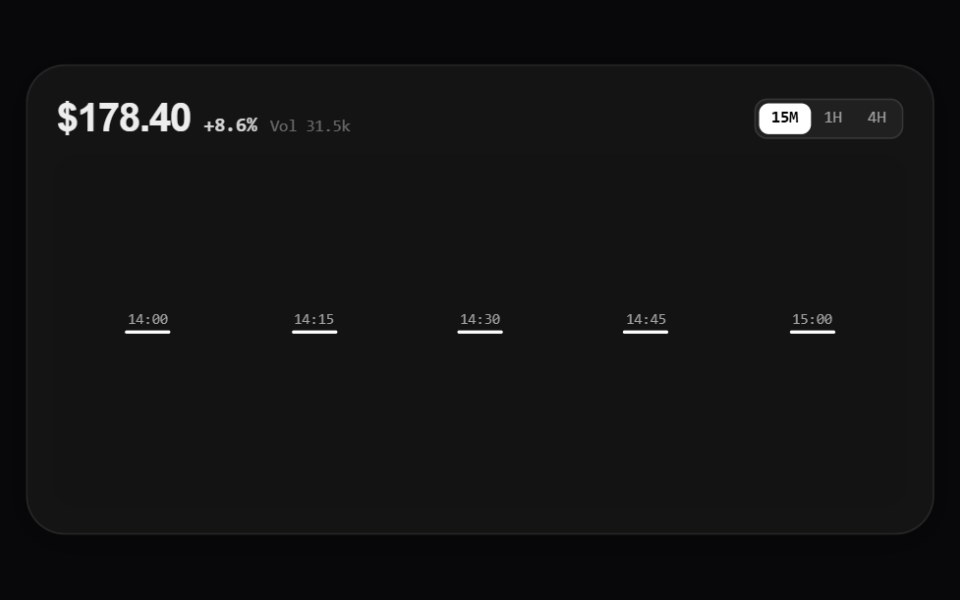 Mono Rounded Candlestick ChartAmicro Micro Transitions · React
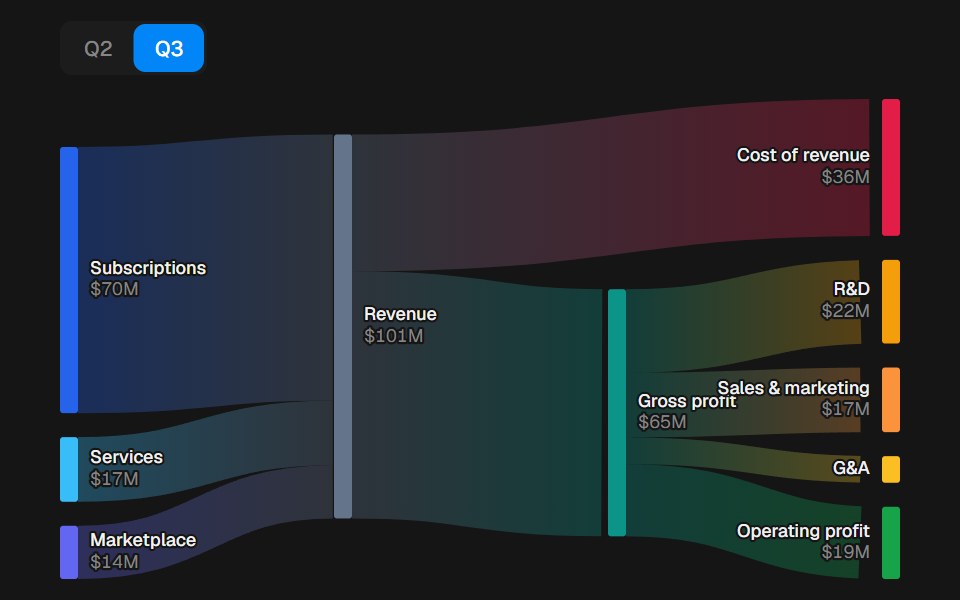 Sankey ChartbeUI · ReactWeighted flows between stages that draw in and morph with your data.
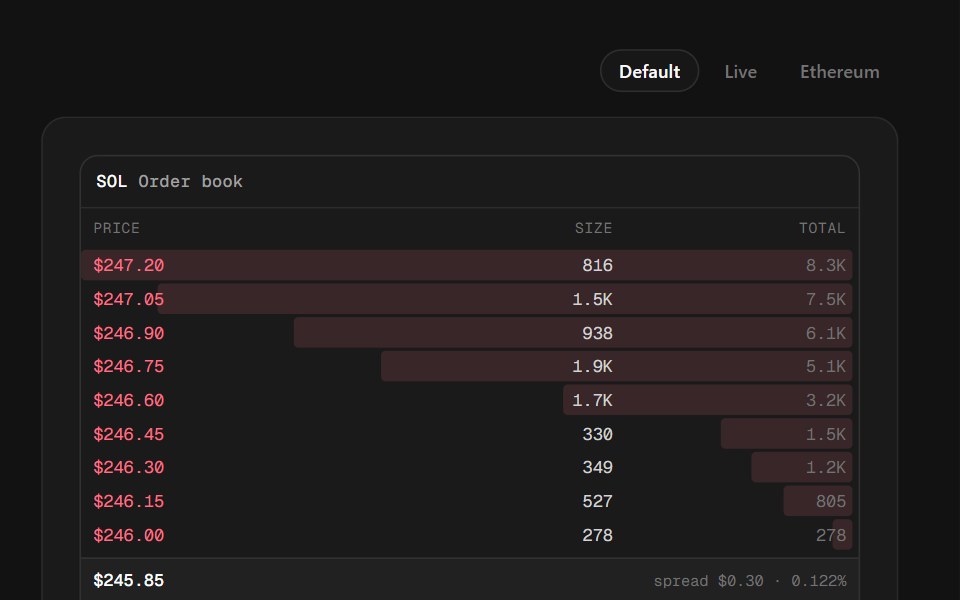 Order BookSpectrum UI · ReactA trading ladder with cumulative depth bars, a spread row, and flashing updates in live mode.
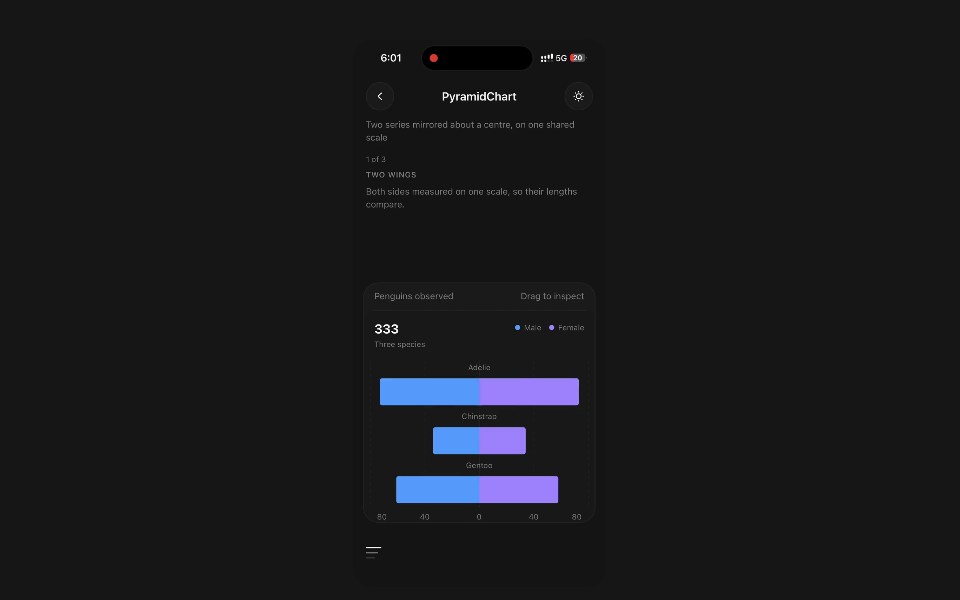 Pyramid ChartPanel UI · React NativeTwo series mirrored about a centre, on one shared scale.
 Mono Rounded Composed ChartAmicro Micro Transitions · React
Libraries with Animated chart components
Related categories
- Chart Components
- React Chart Components
- Tailwind CSS Chart Components
- shadcn/ui Chart Components
- Animated Data Display Components
- Animated Card Components
- Animated Carousel Components
- Animated Accordion Components
- Animated Stat Components
- Animated Collapsible Components
- Animated Card Stack Components
- Animated Counter Components
- Animated List Components
- Animated Avatar Components
- Animated Table Components
- Animated Tree View Components
- Animated Avatar Group Components
- Animated Line Chart Components
- Animated Timeline Components
- Animated Testimonial Components