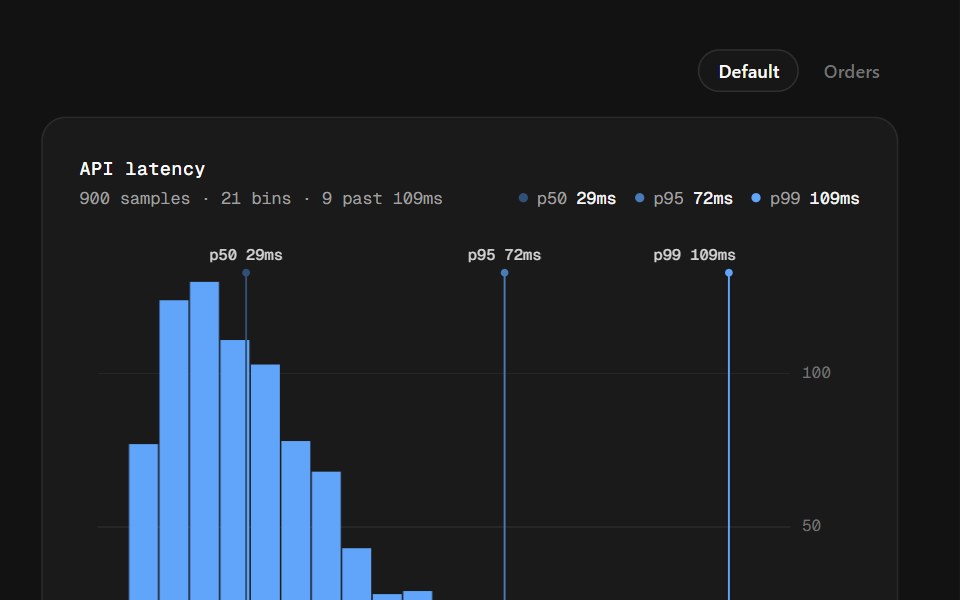
Histogram
A distribution of raw samples binned on nice edges, with p50 / p95 / p99 pinned onto the plot — the chart that shows the tail your average hides.
- Library
- Spectrum UI
- Framework
- React
- Type
- component
- License
- Apache-2.0
- Install
npx shadcn@latest add @spectrumui/histogram-chart- Files
app/registry/charts/chart-engine.tsxapp/registry/charts/histogram-chart.tsxlib/utils.ts
- Source
- https://github.com/arihantcodes/spectrum-ui
Categories
- Chart Components
- React Chart Components
- Tailwind CSS Chart Components
- Animated Chart Components
- Data Display Components
- React Data Display Components
- Tailwind CSS Data Display Components
- Animated Data Display Components