 Dev Design Library
Tailwind CSS Chart Components
Dev Design Library indexes 559 Tailwind CSS chart components from 40 open-source UI libraries, with the most coming from Tremor Blocks, shadcn/ui, Shark UI, Panel UI and Amicro Micro Transitions. Each one links to its page with the source code, a live preview where available, the library license and the install command. Every library in this list styles its components with Tailwind CSS utility classes. Chart components belong to the Data display group.
Showing 120 of 559, a mix from every library. Open a library to see all of its components.
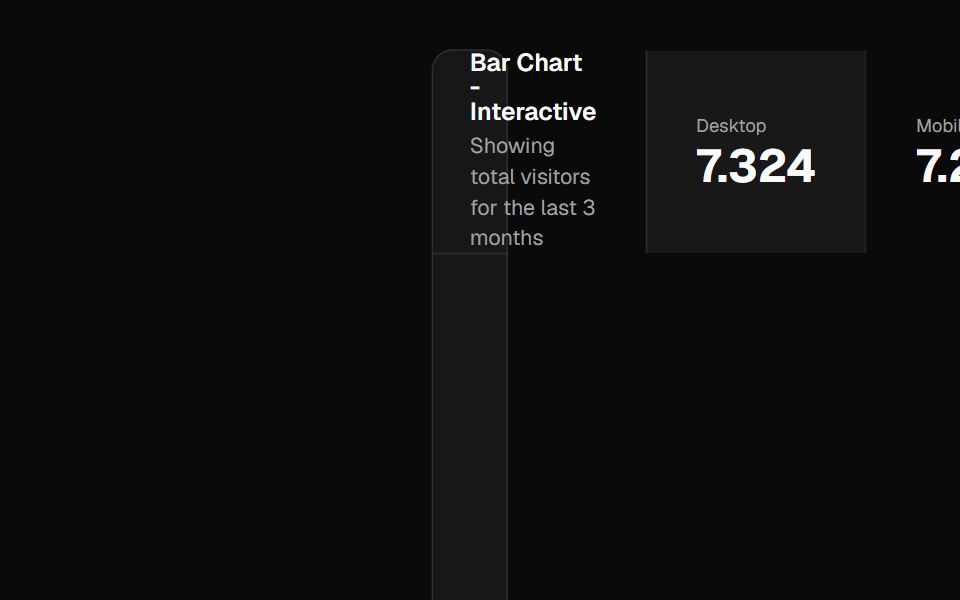 Chartshadcn/ui · ReactBeautiful charts. Built using Recharts. Copy and paste into your apps.
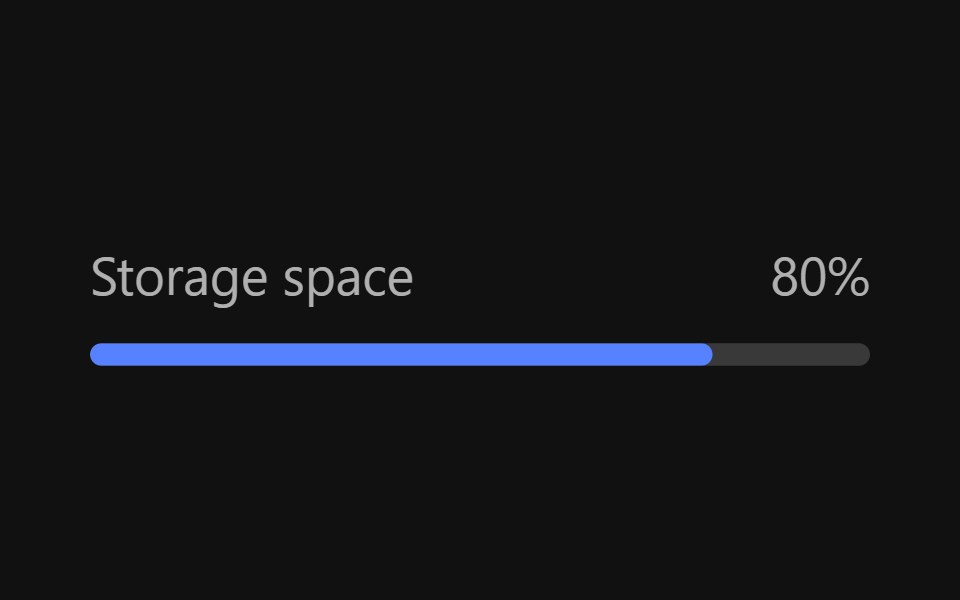 MeterReact Spectrum · ReactMeters are visual representations of a quantity or an achievement. Their progress is determined by user actions…
 Comp 362Origin UI · React
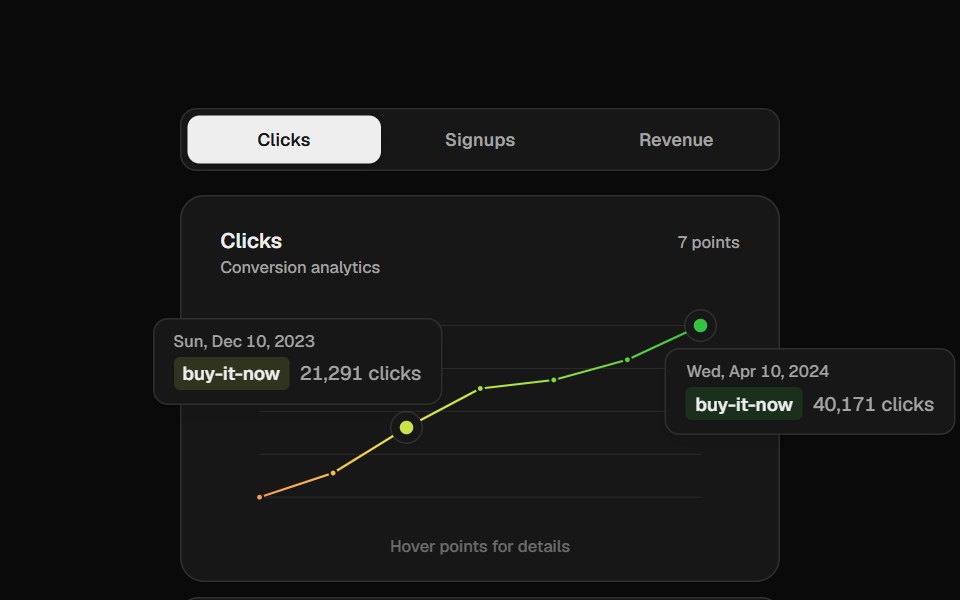 Analytics ChartCult UI · ReactVercel-style gradient line chart with floating tooltip cards
 Area ChartTremor · React
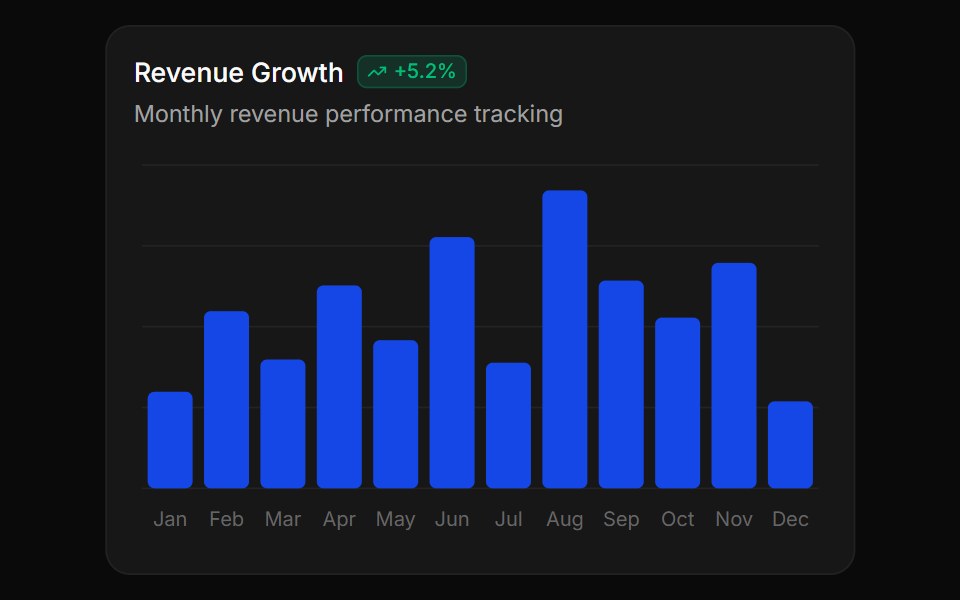 Basic bar chartReUI · ReactBasic bar chart
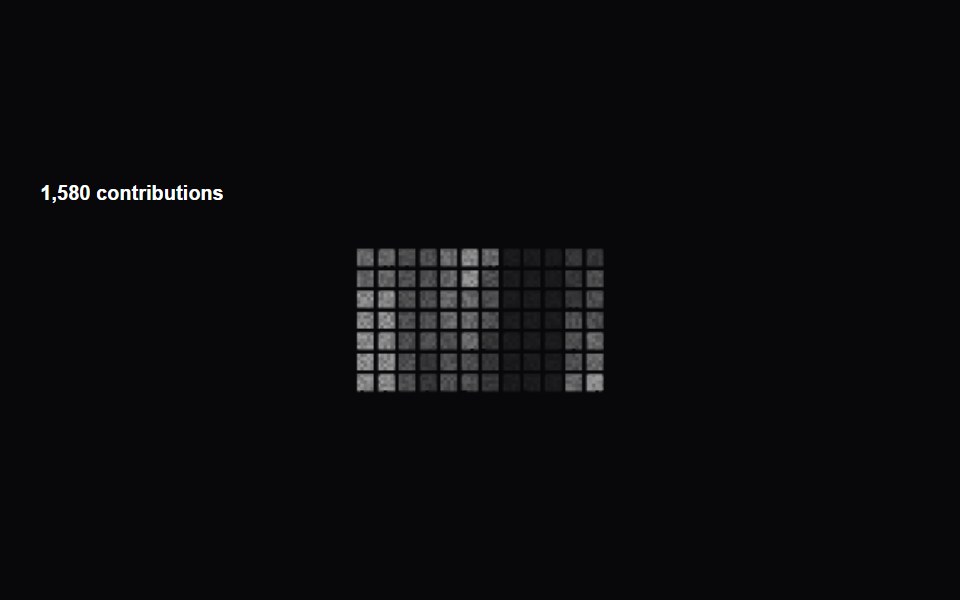 Activity Dither HeatmapAmicro Micro Transitions · ReactGitHub-style activity heatmap with interactive dither dots.
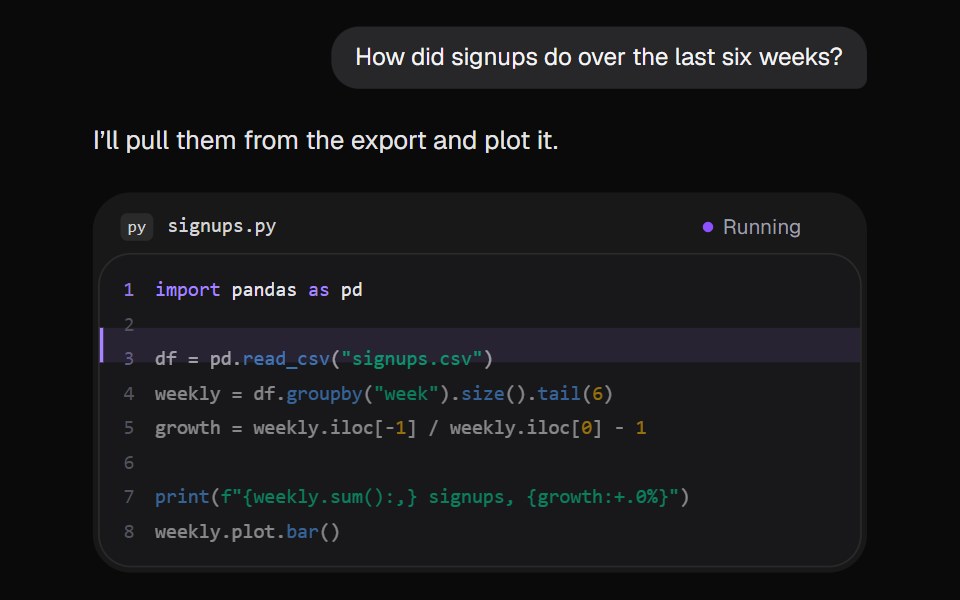 AI Code RunKokonut UI · ReactThe assistant runs a short Python script in the reply. A marker steps down the lines, the output prints, and the chart…
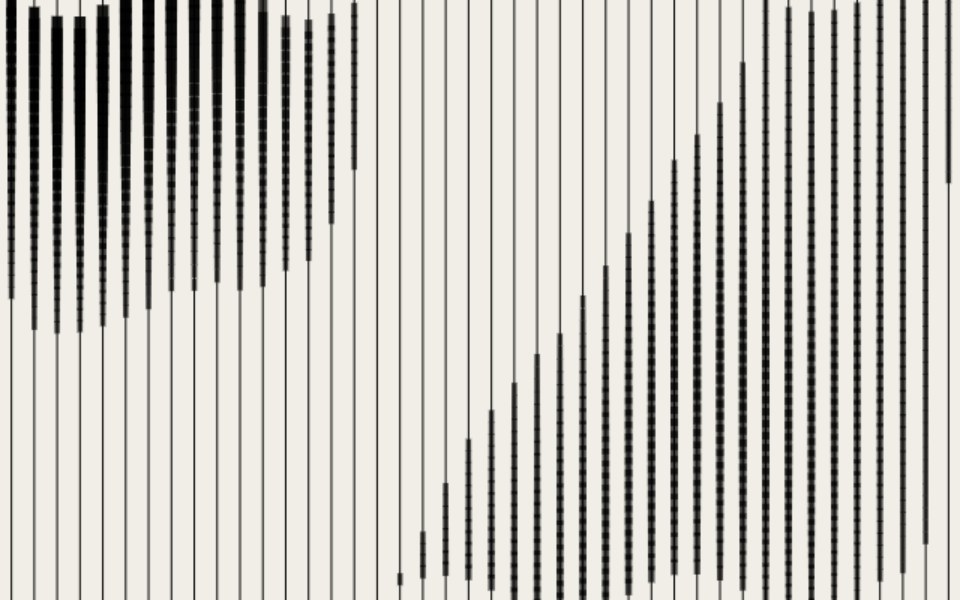 Horizontal BarsCursify · React
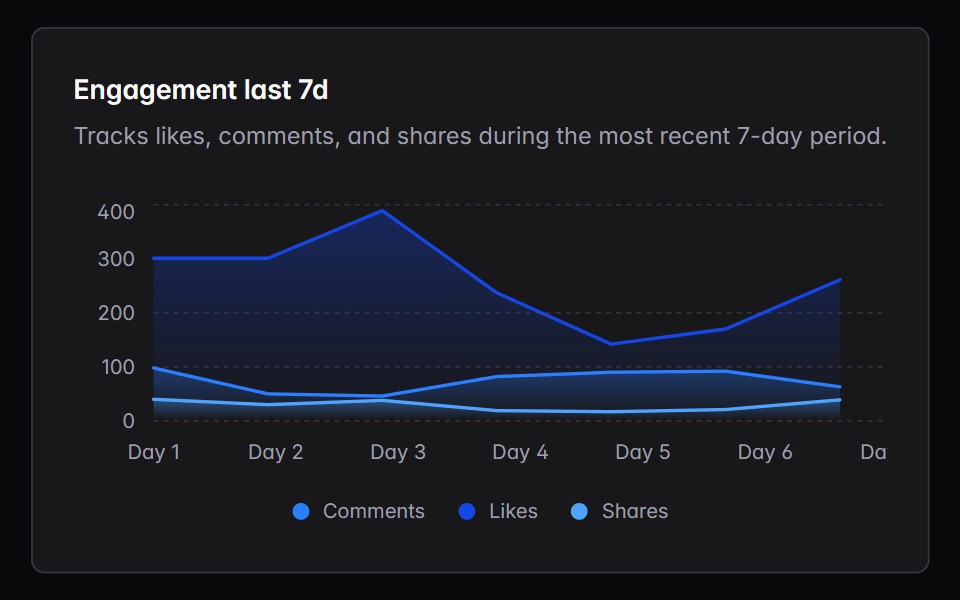 area-chartIntent UI · Reactarea-chart
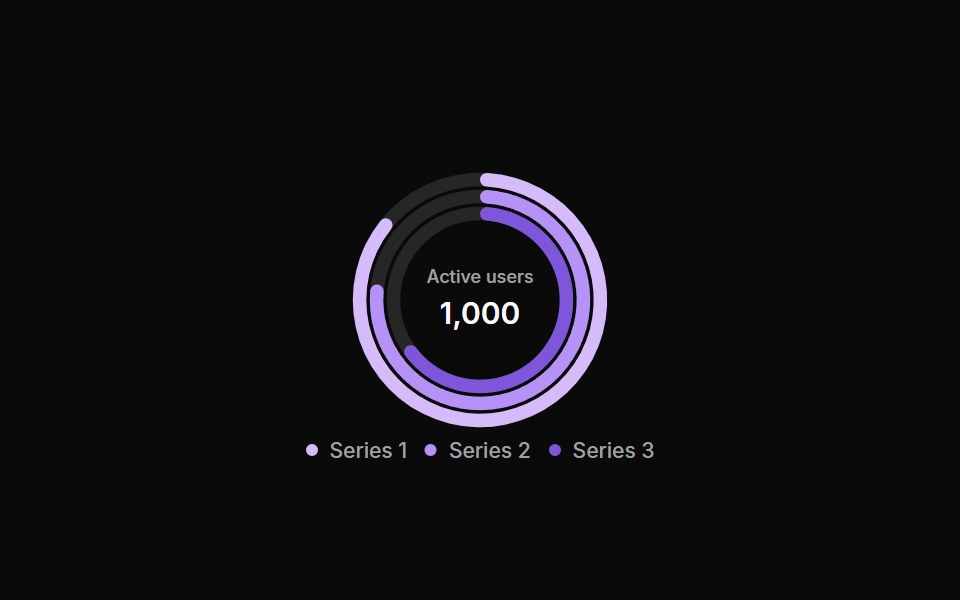 ChartsUntitled UI React · React
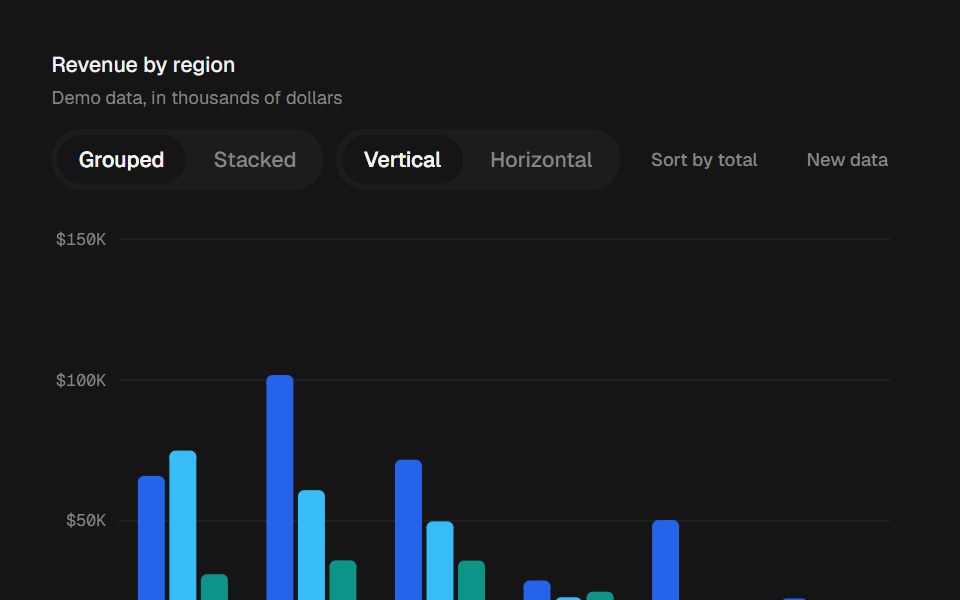 Bar ChartbeUI · ReactGrouped, stacked and horizontal bars that grow in, rescale and reorder with springs.
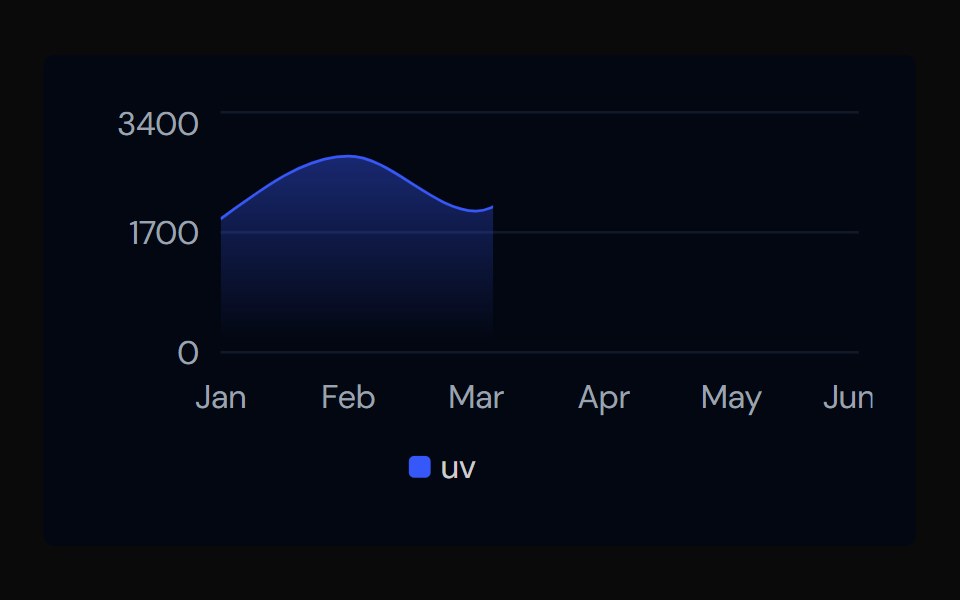 ChartTailGrids · ReactA chart component with multiple variants.
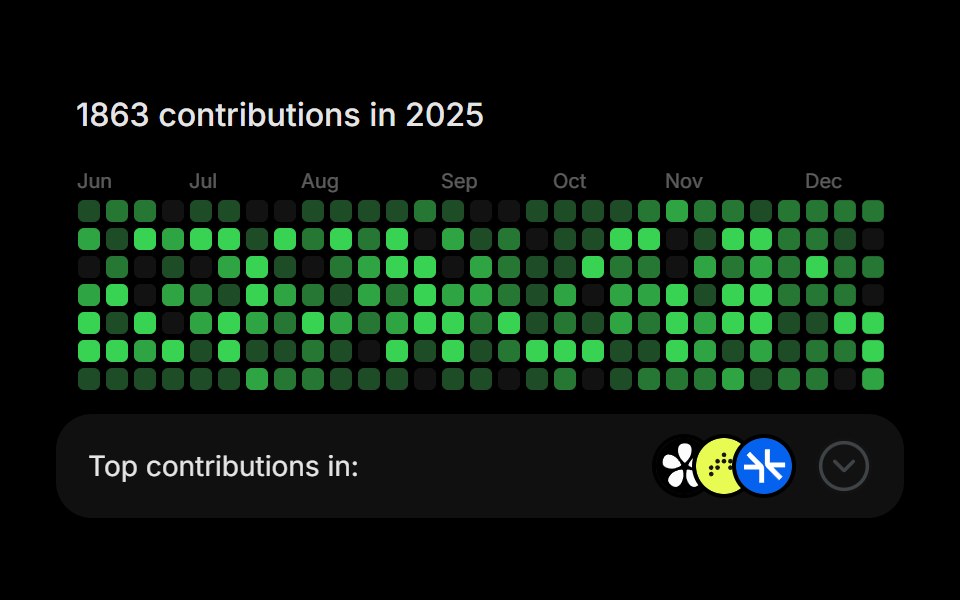 GitHub ActivityRare UI · ReactA contribution heatmap with a footer panel that expands over the grid to rank your top repositories.
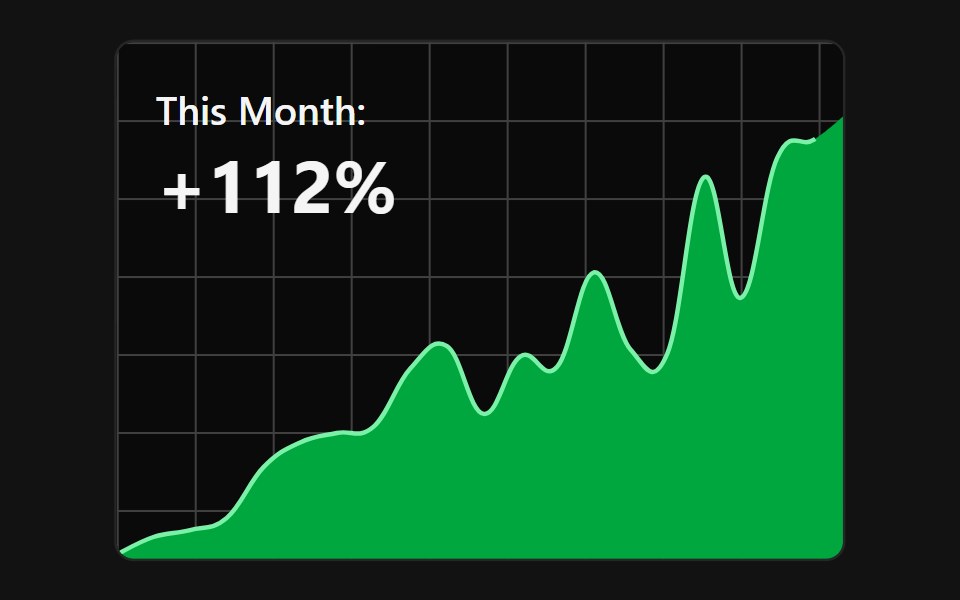 Animated SVG ChartSpectrum UI · Reactcomponent for the Animated SVG Chart
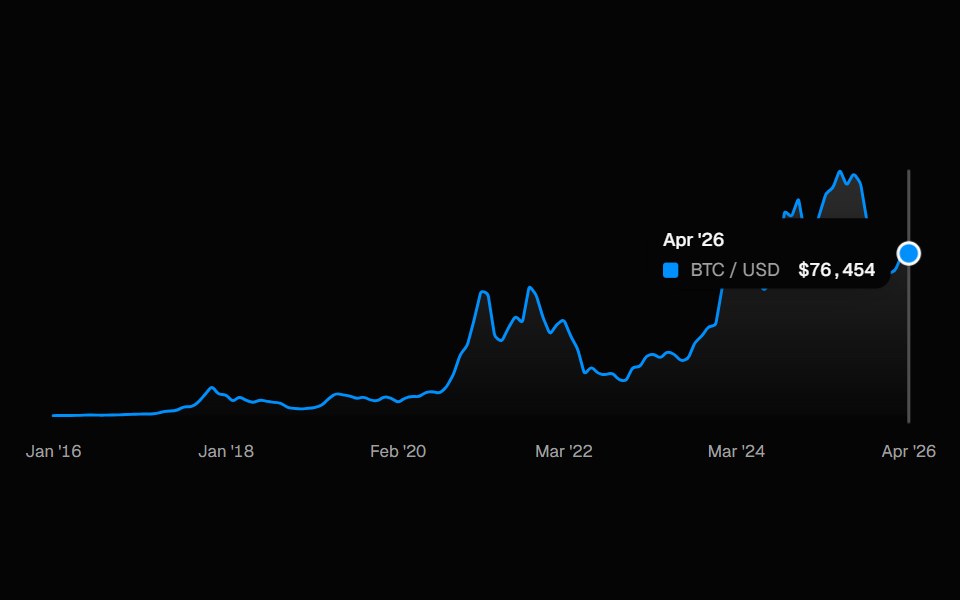 ChartSpell UI · ReactInteractive line chart with a cursor-tracked tooltip card, snap-to-point hover, and built-in X-axis labels.
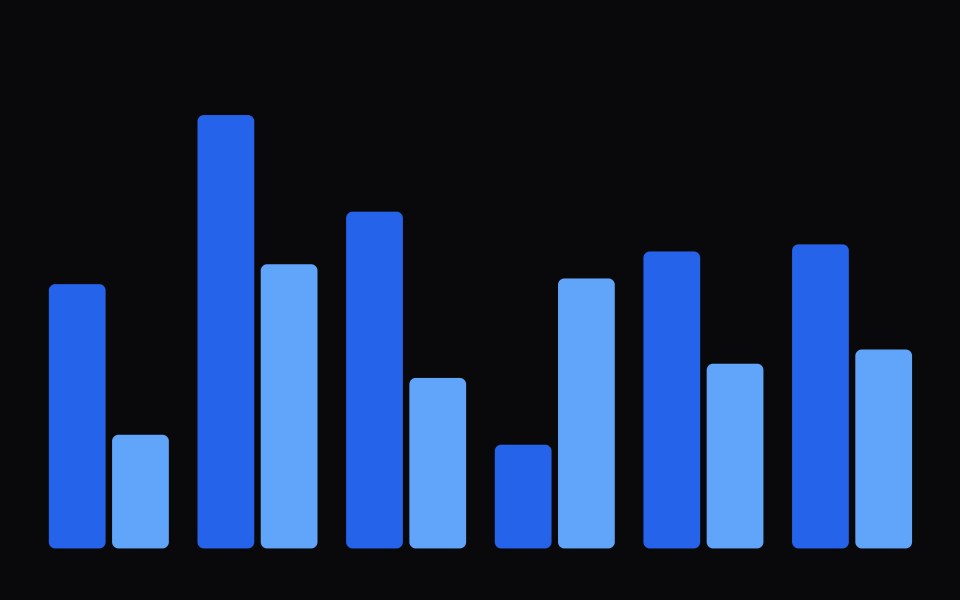 ChartVengeance UI · React
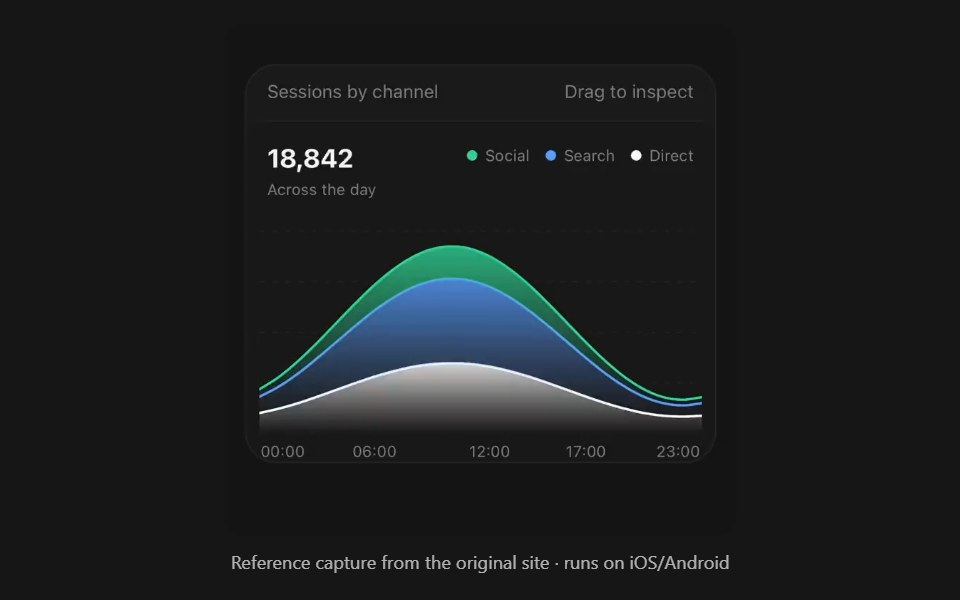 Area ChartPanel UI · React NativeFilled bands over time, stacked or overlaid.
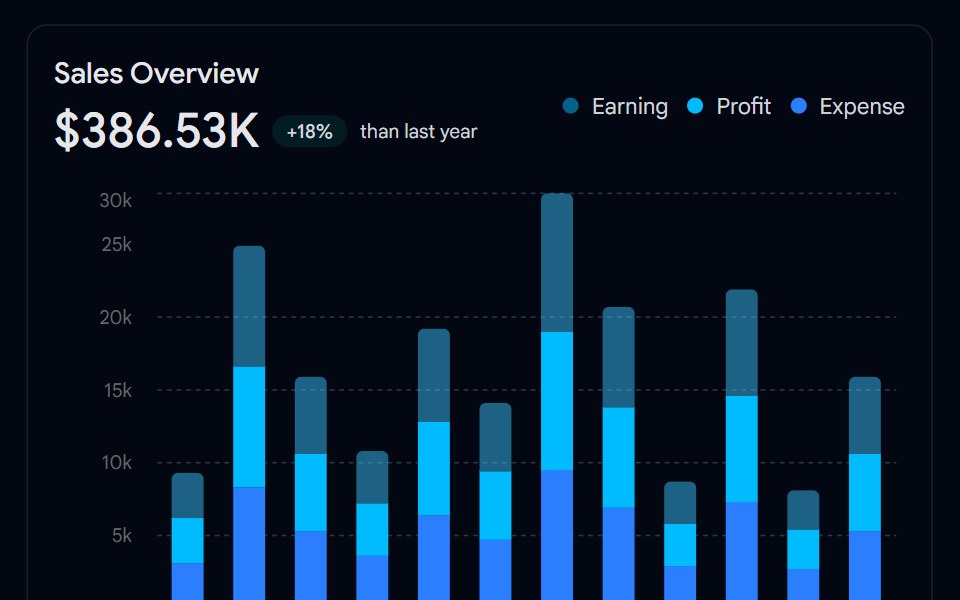 Chart 01 - Sales Performance Bar ChartShadcn Space · ReactAn interactive stacked bar chart displaying monthly earnings, profit, and expenses, ideal for admin dashboards to…
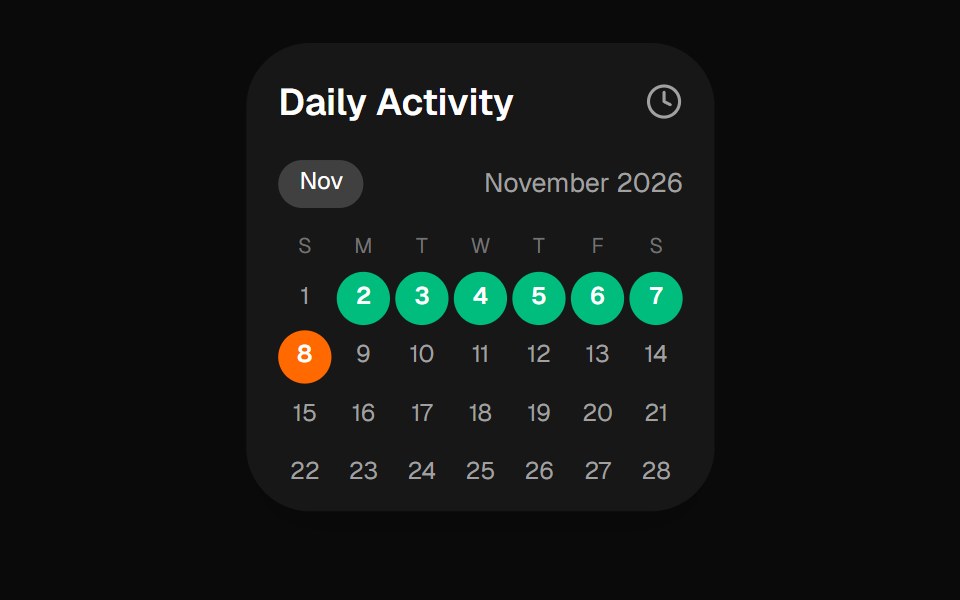 Daily Activity Calendar WidgetOpenSourceUI · React
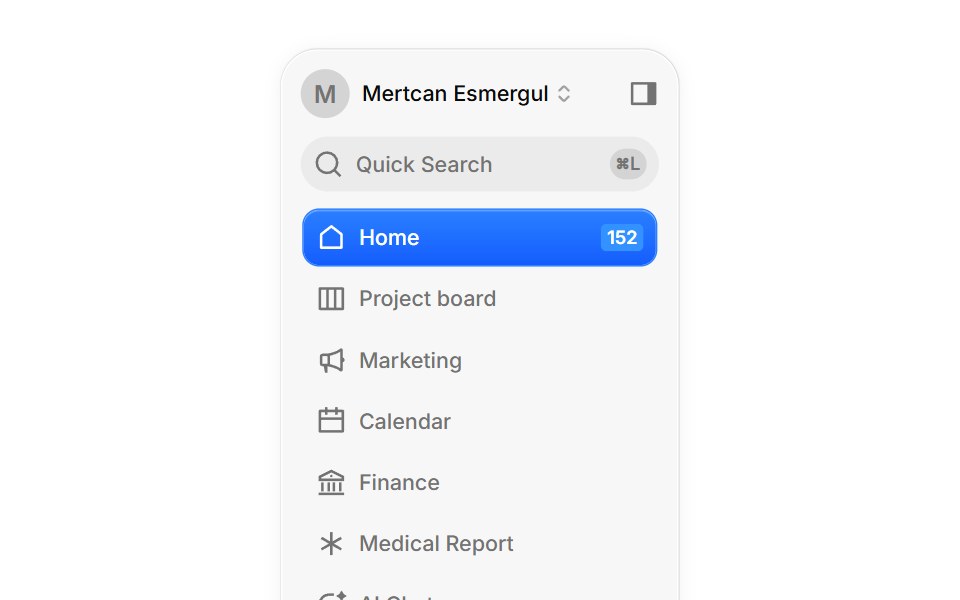 DashboardBoardUI · React
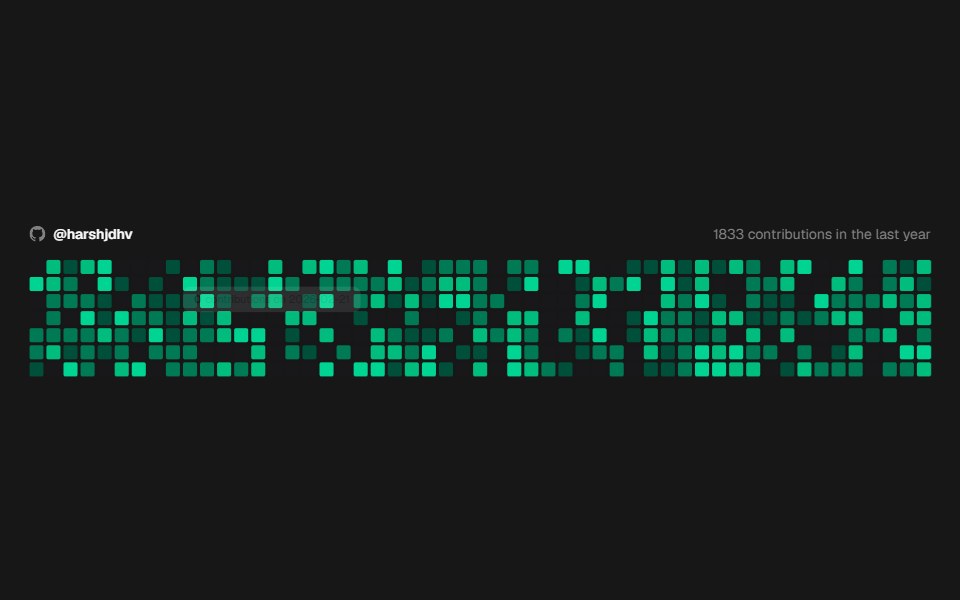 Github CalendarComponentry · ReactGitHub-style contribution calendar heatmap.
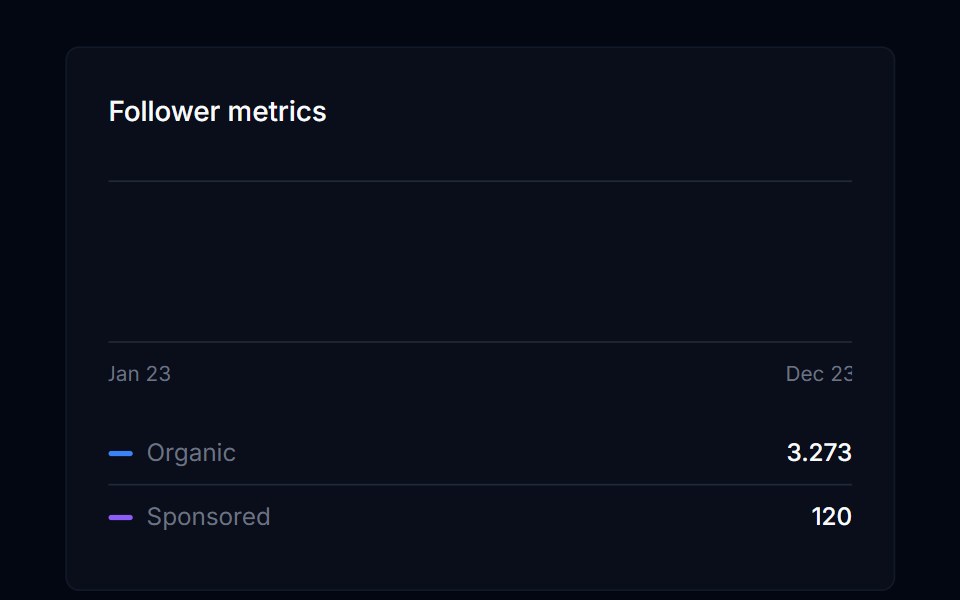 Area ChartTremor Blocks · ReactThe base area chart component (Recharts): any number of series, legend, tooltip, axes, stacked or percent mode…
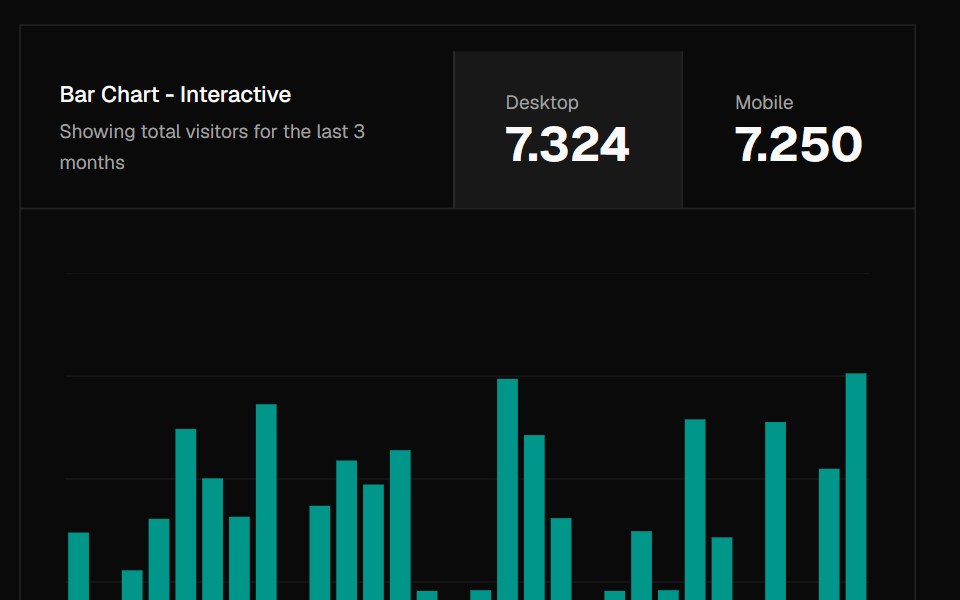 ChartShadcn Dashboard · React
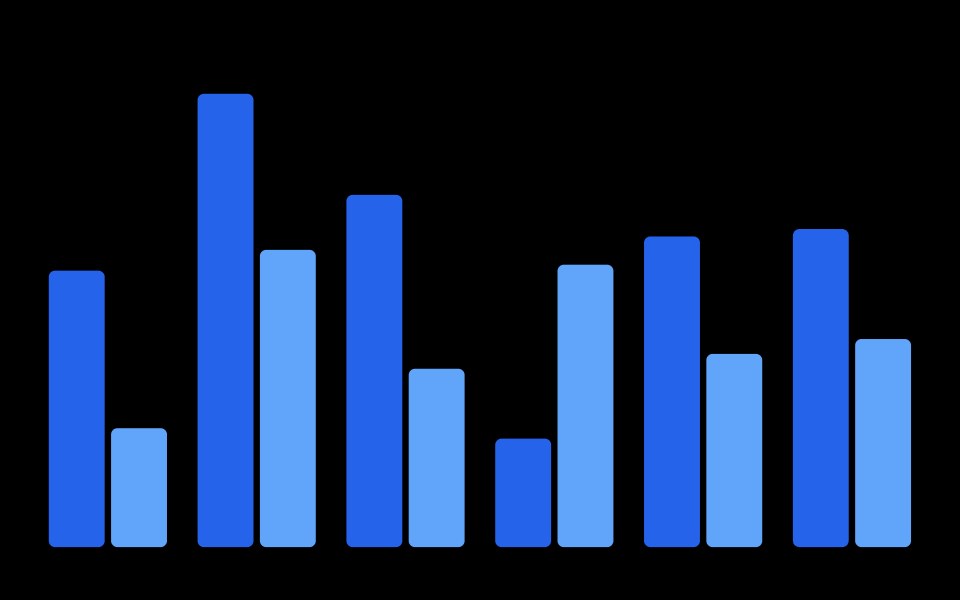 ChartObsidianUI · React
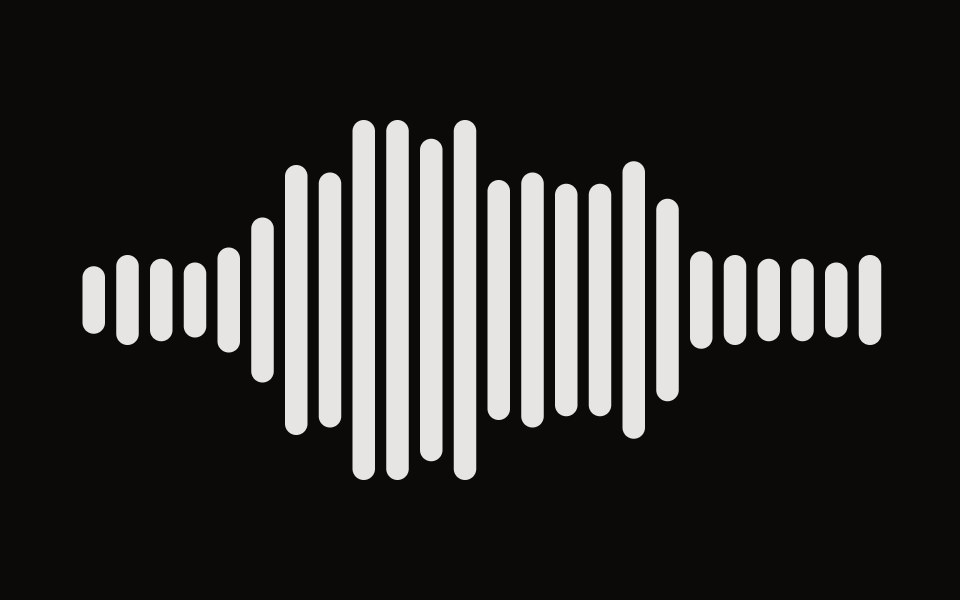 Bar Visualizeraudiocn · ReactA row of bars driven by frequency bands, with idle, loading and mirrored modes. Bars paint without re-rendering React.
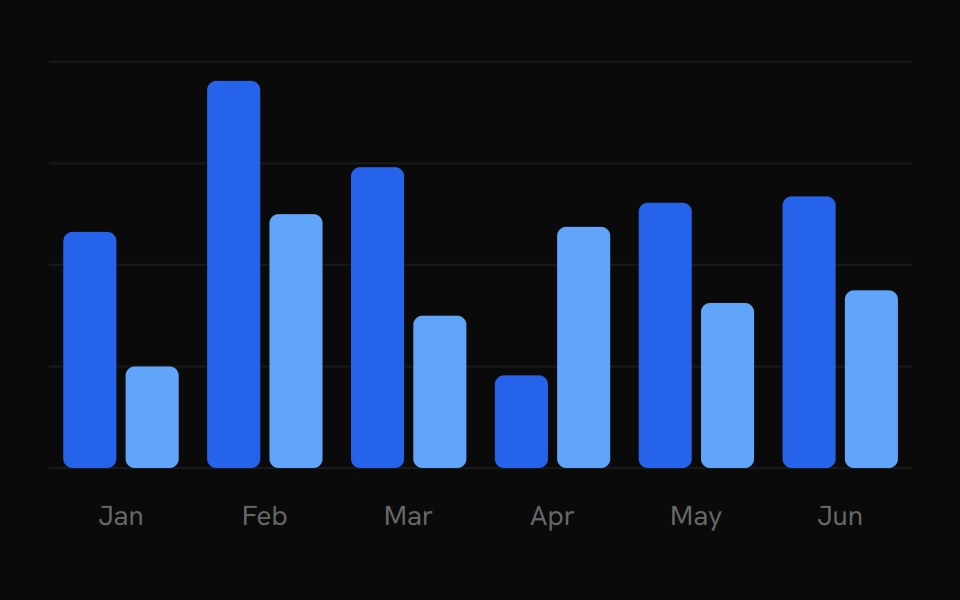 ChartShark UI · ReactVisualize data with beautiful charts.
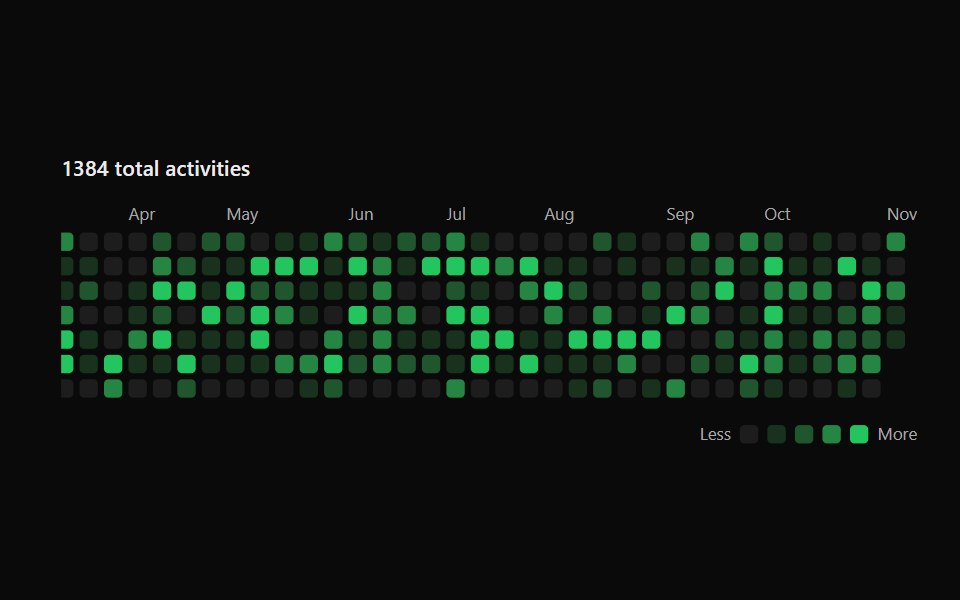 Activity GraphSona UI · ReactA keyboard-accessible calendar heatmap with normalized intensity levels and an interruptible shared focus surface.
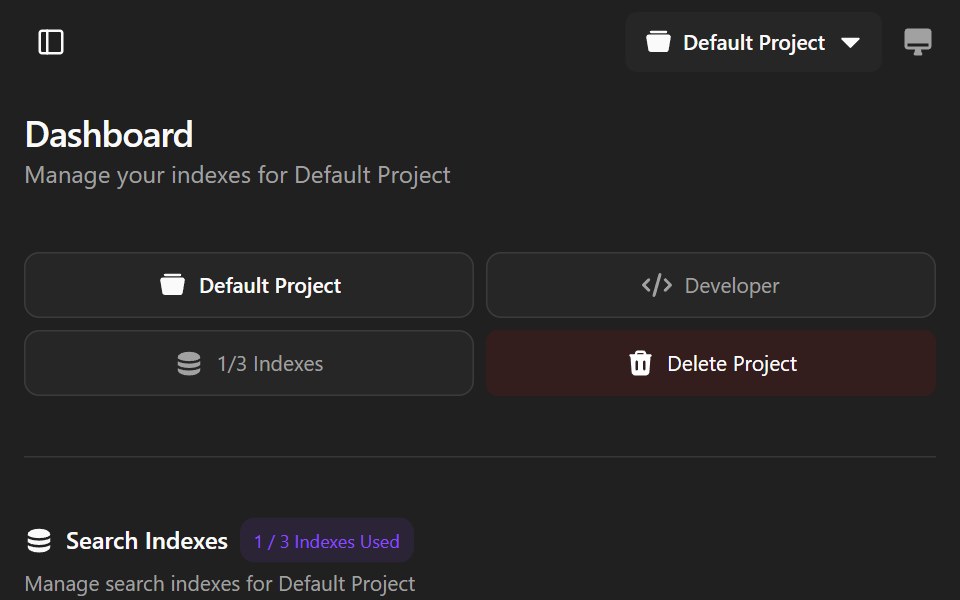 Agndex DashboardWatermelon UI · ReactA developer portal for managing search indexes, API credentials, billing, and project settings with light and dark…
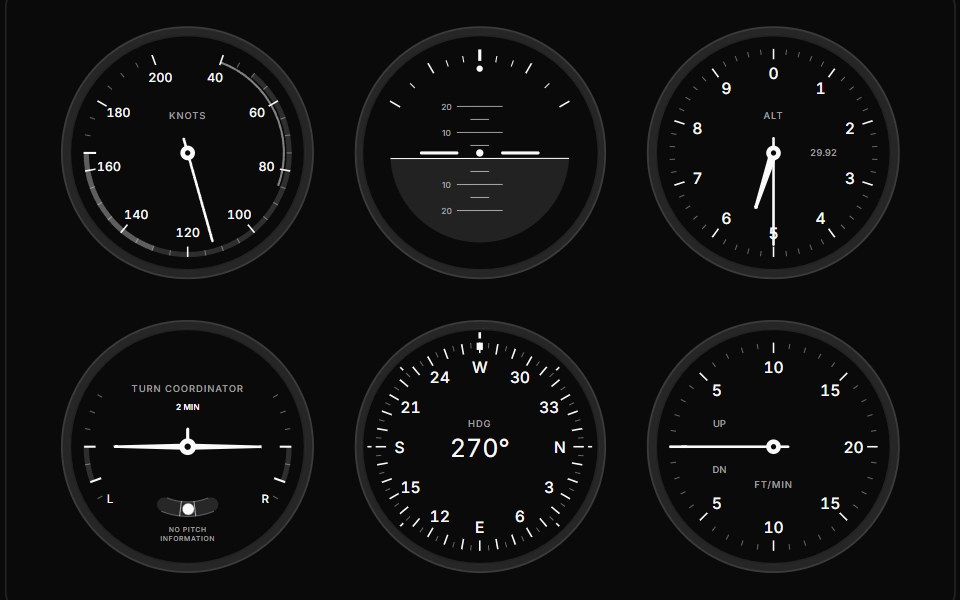 GaugeGauge UI · ReactComposable SVG gauge primitives: track, arc, zones, ticks, tick fills, labels, needle, hub, dot, tooltip and value…
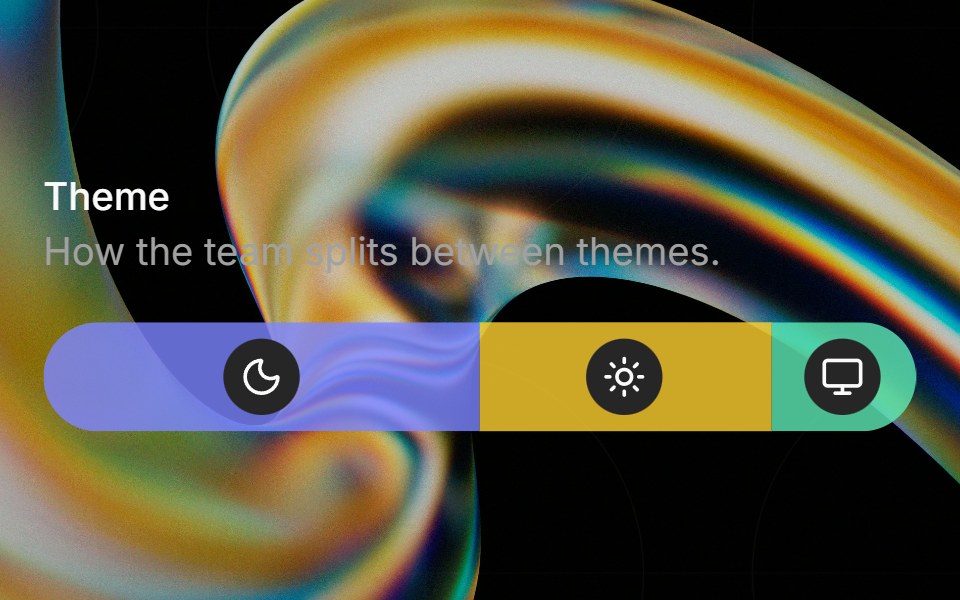 Preferenceglasscn · ReactA weighted preference bar with icon badges, hover tinting, and tooltip descriptions.
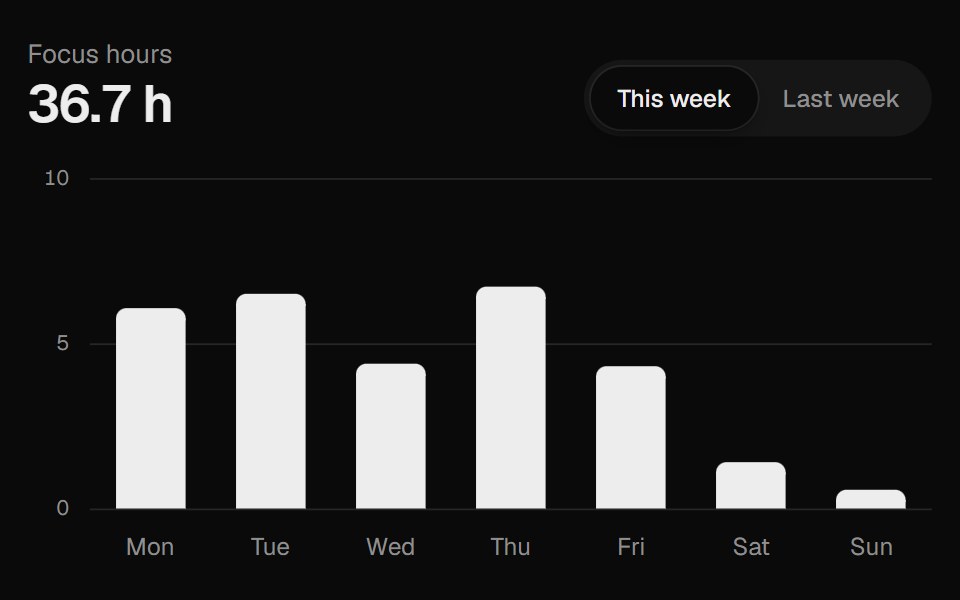 Bar ChartUI Lab · ReactGrows its bars from the baseline and springs them between two weeks.
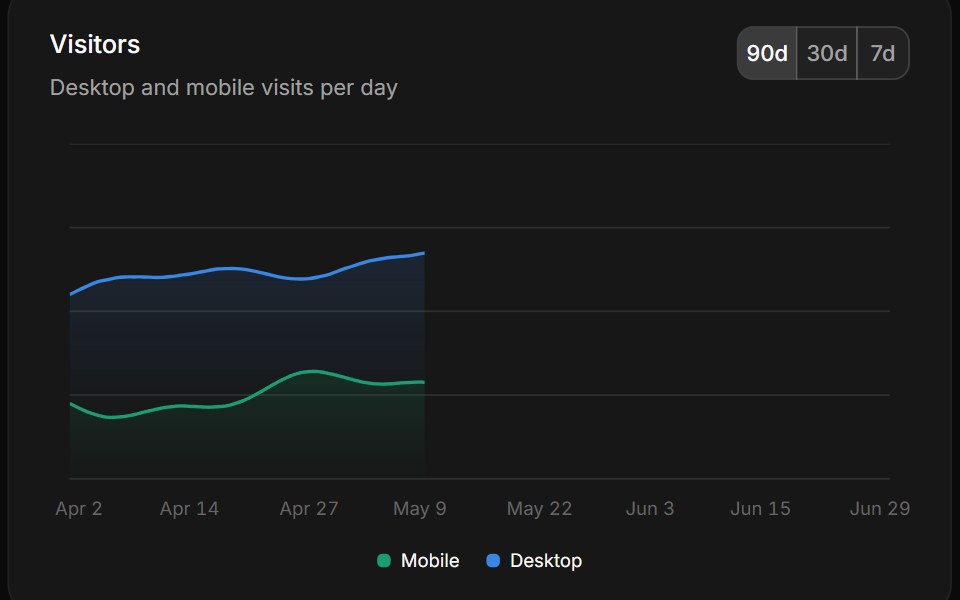 ChartHextaUI · ReactRecharts charts with themed colors, a tooltip and legend that read labels from one config, and keyboard navigation…
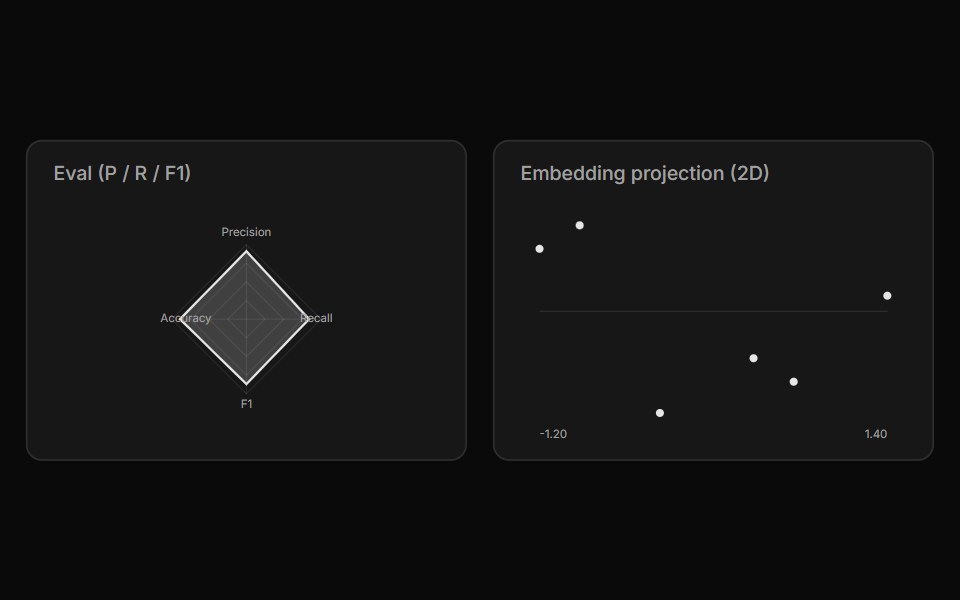 Chart ArtifactLocalMode · ReactA dependency-free inline-SVG chart (line / bar / area / scatter / radar / gauge) for local metrics — eval curves…
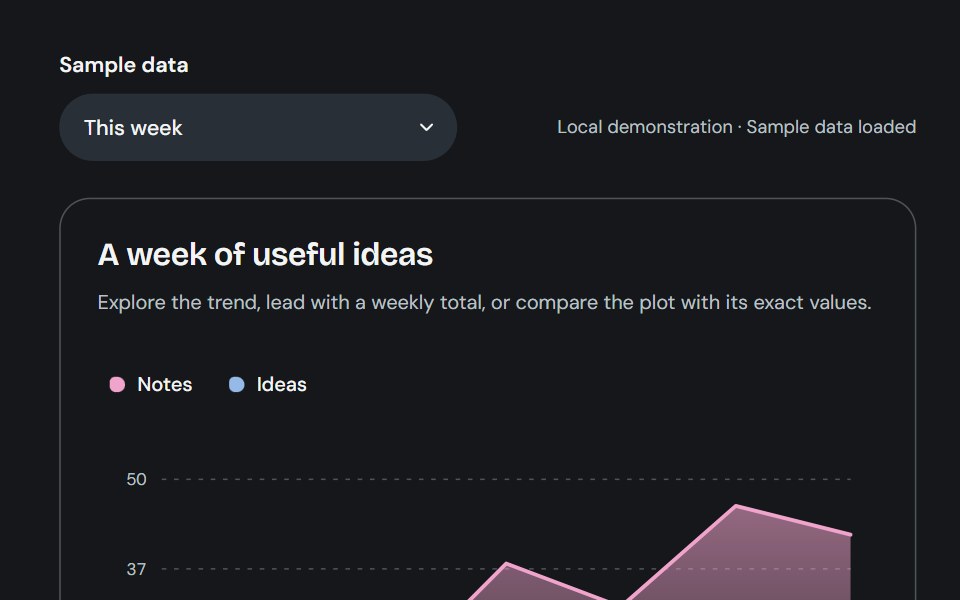 Area chartCojeev UI · ReactLayered area charts with shared series colors, responsive bounds and a keyboard data inspector.
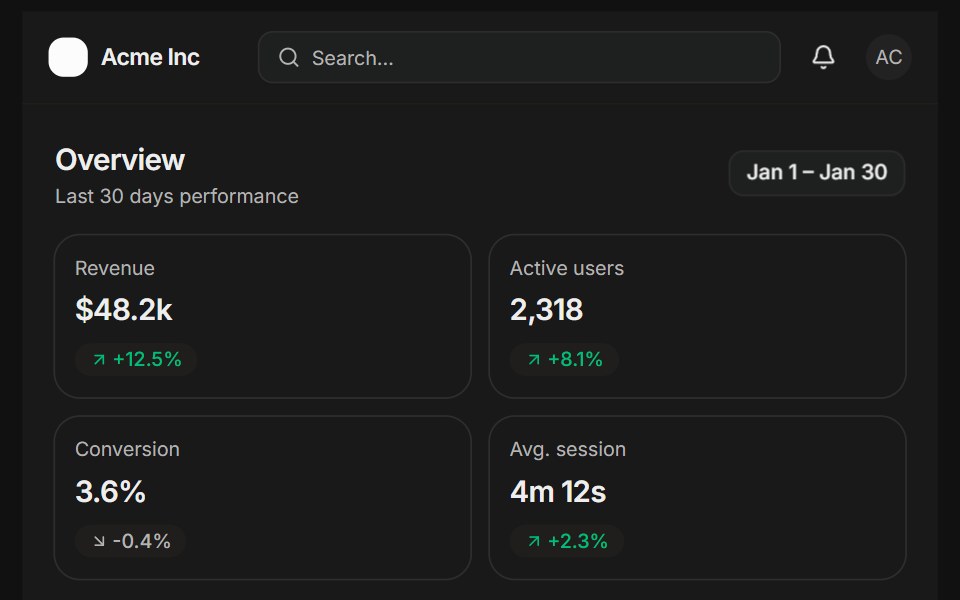 Analytics overviewFLX UI · ReactSidebar, KPI cards, a bar chart, and a recent activity list.
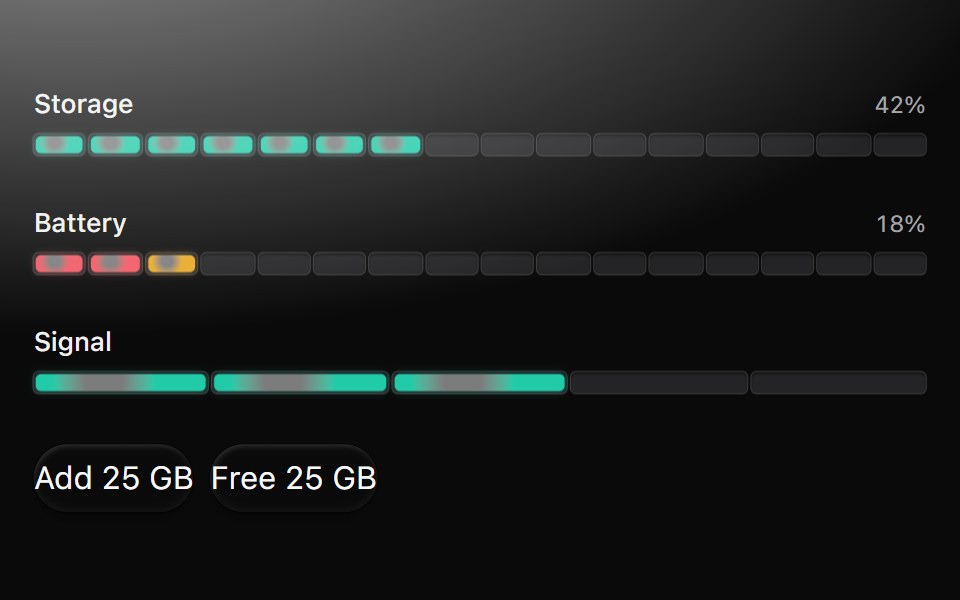 MeterMetal UI · React + SwiftUIA level in a range as a row of LED segments coloured by position (green, amber, red); a change sweeps segment by…
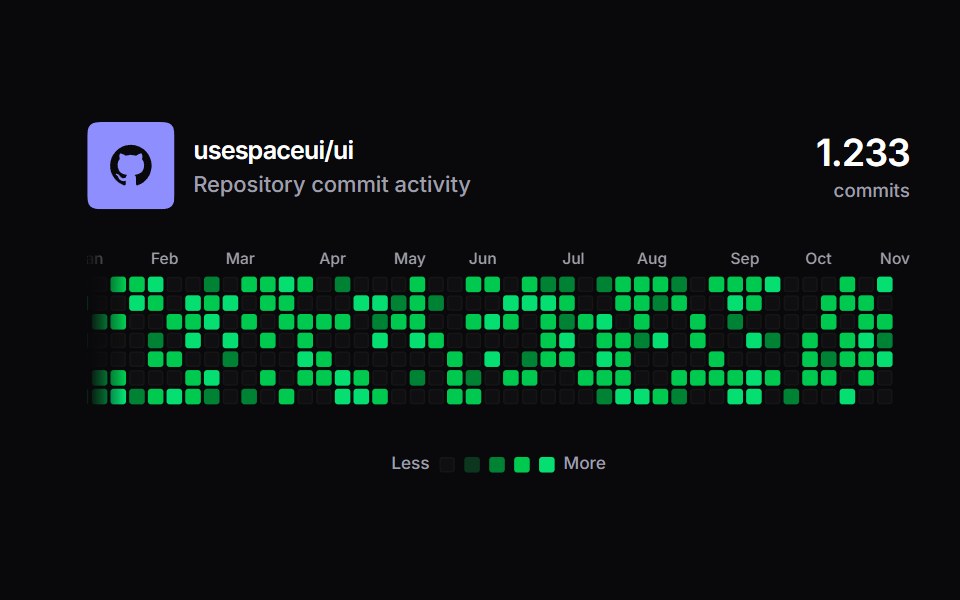 Github ActivitySpaceUI · ReactAn interactive GitHub ecosystem showcase featuring pure 52-week contribution heatmap matrix content with live fetch…
 Bento 01D2Studio UI · ReactBento grid for an education program platform with admin overview, faculty view and a program form.
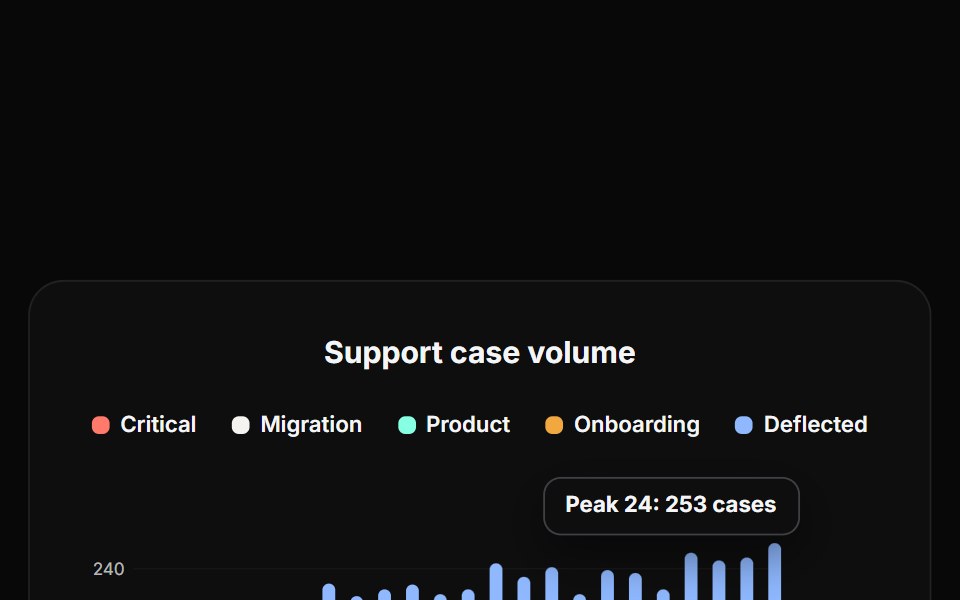 Bar ChartReactFrame · ReactA stacked bar chart, up to 5 series per bar, a reference line, a peak-value annotation, and a hover tooltip breaking…
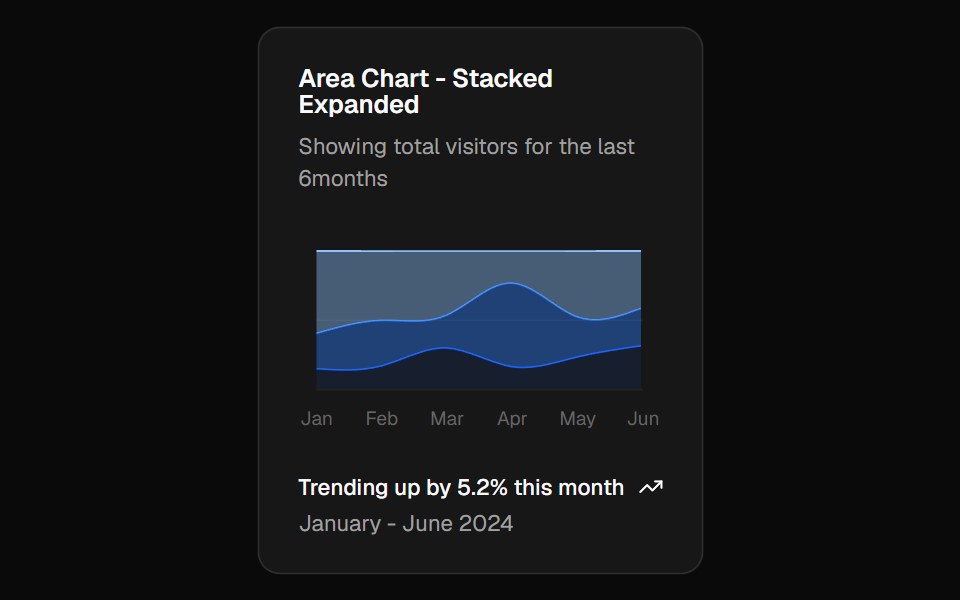 Chart Area Stacked Expandshadcn/ui · ReactStacked area chart example normalised to 100%, showing each series as a share of the total.
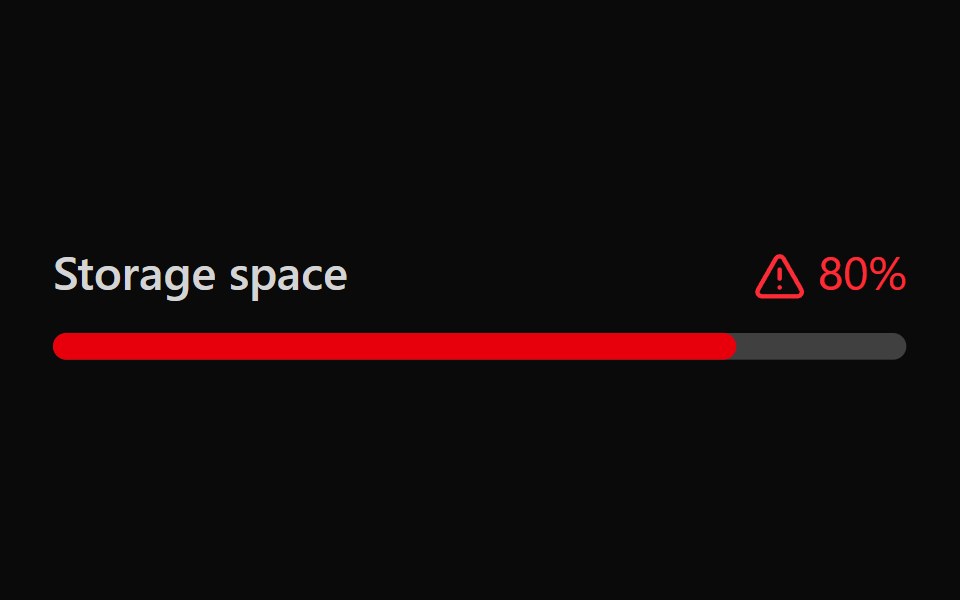 Tailwind MeterReact Spectrum · React
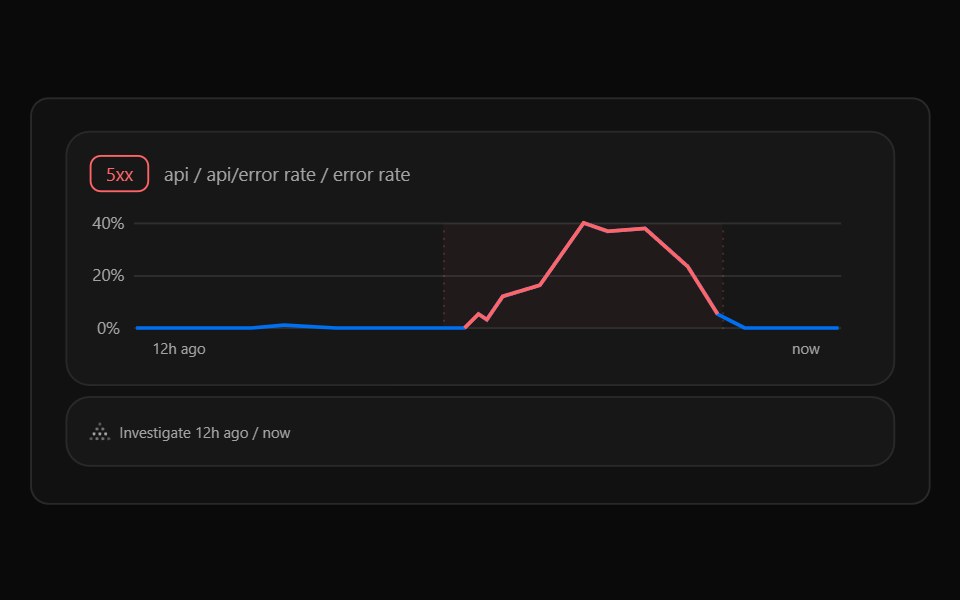 Illustration GraphCult UI · ReactGraph illustration component
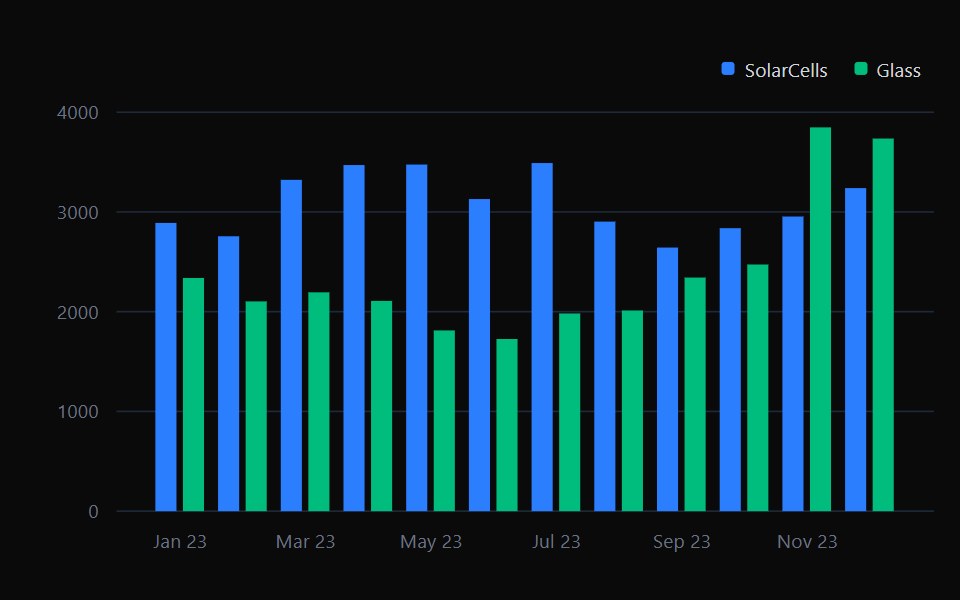 Bar ChartTremor · React
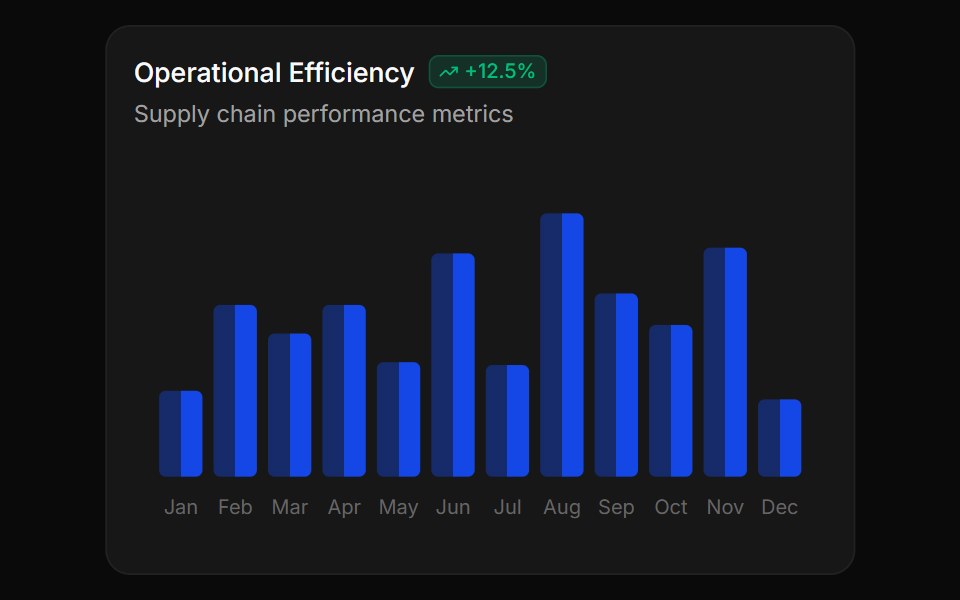 Duotone gradient bar chartReUI · ReactDuotone gradient bar chart
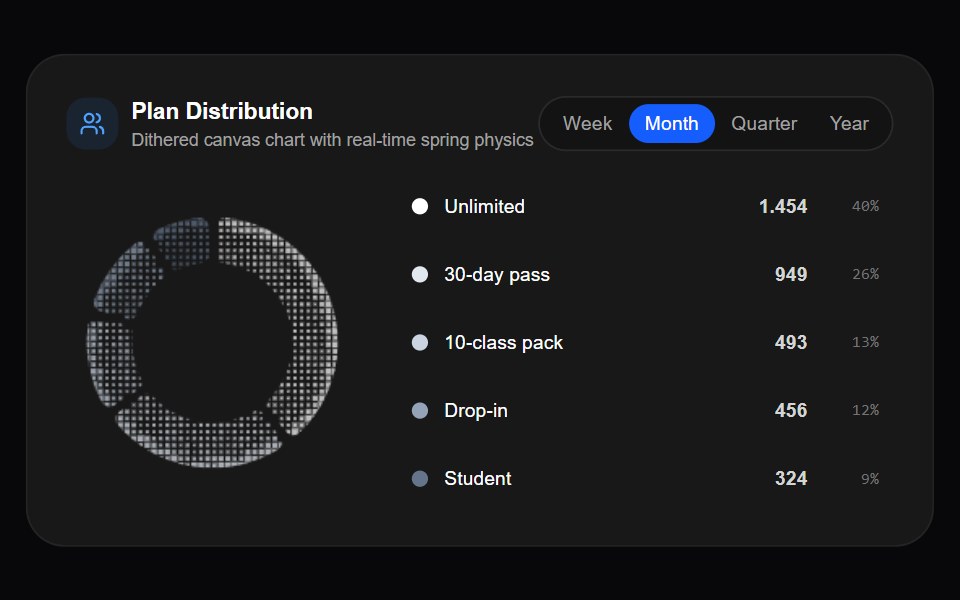 Dither Donut ChartAmicro Micro Transitions · ReactInteractive pixelated dither donut chart with real-time spring physics.
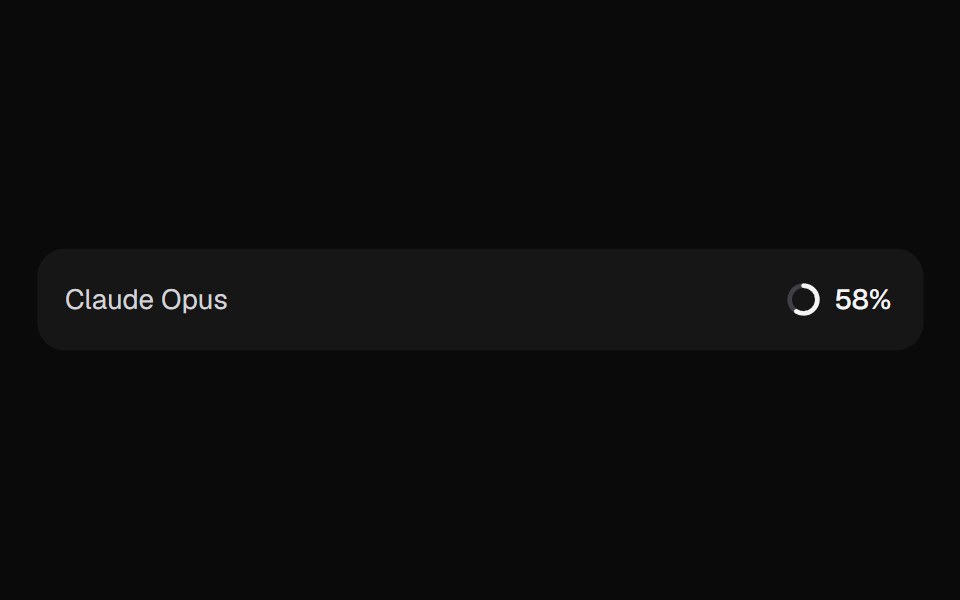 AI Context MeterKokonut UI · ReactHow full the context window is, as a ring in the prompt footer that opens a breakdown by source and compacts when it…
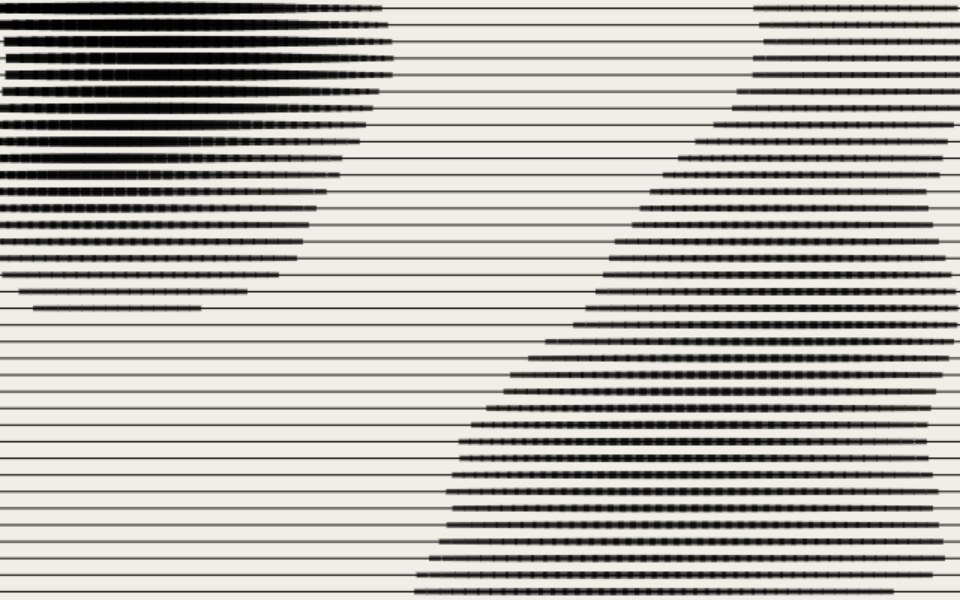 Verticle BarsCursify · React
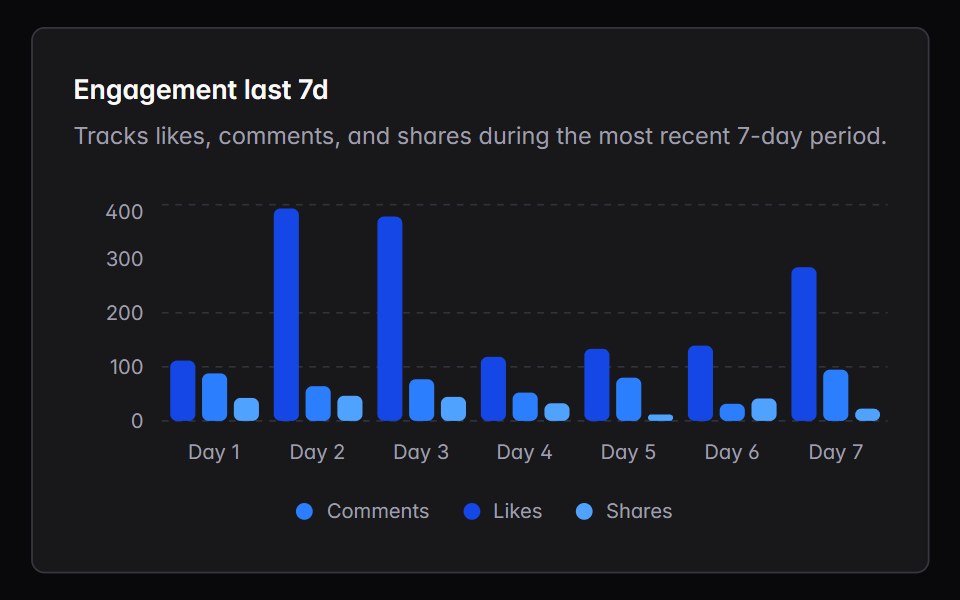 bar-chartIntent UI · Reactbar-chart
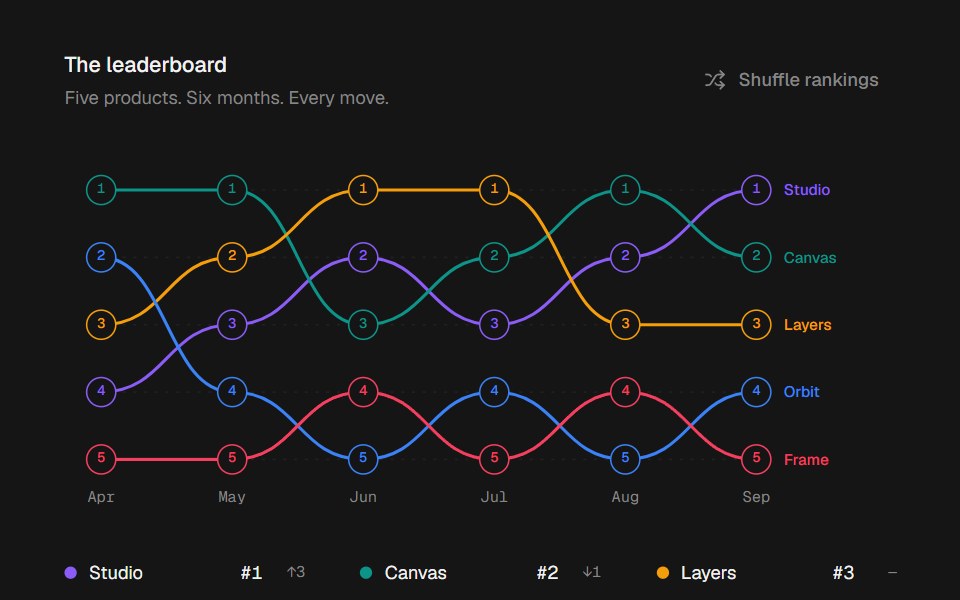 Bump ChartbeUI · ReactAnimated rankings with curved paths, interactive rank dots, and tooltips.
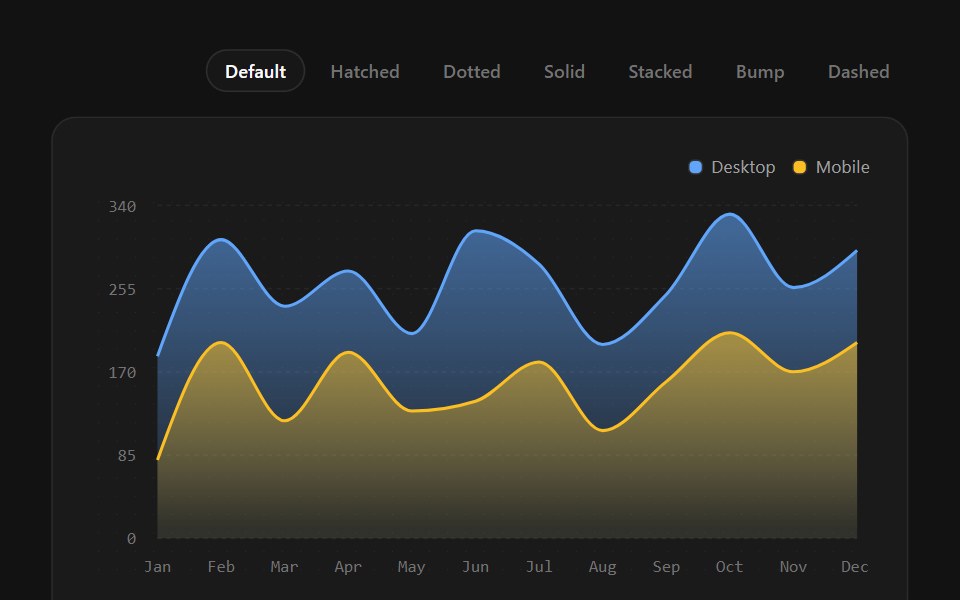 Area ChartSpectrum UI · ReactFilled areas with gradient, hatch, dotted, stacked, and dashed-stroke variants.
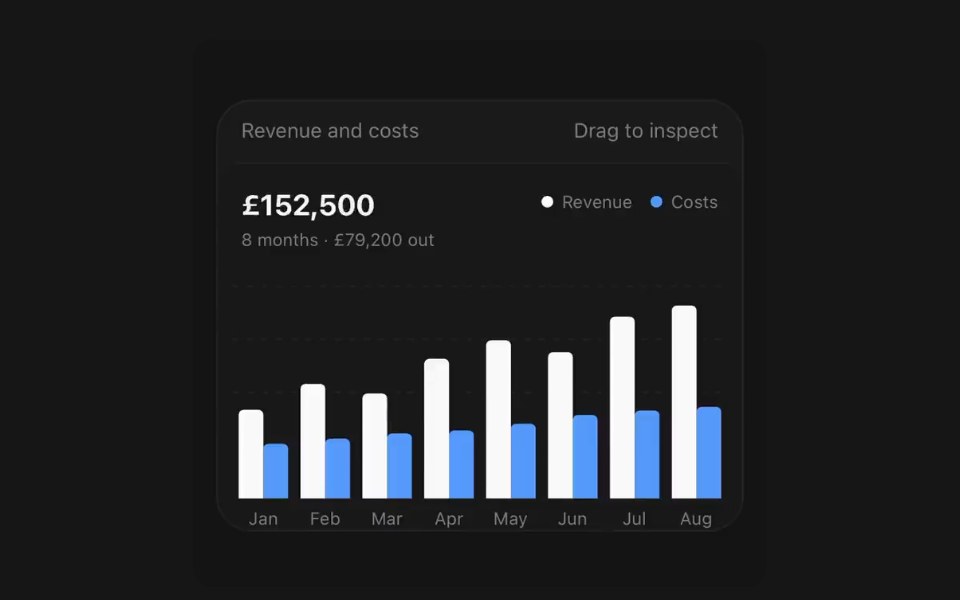 Bar ChartPanel UI · React NativeCategories compared by length, grouped or stacked.
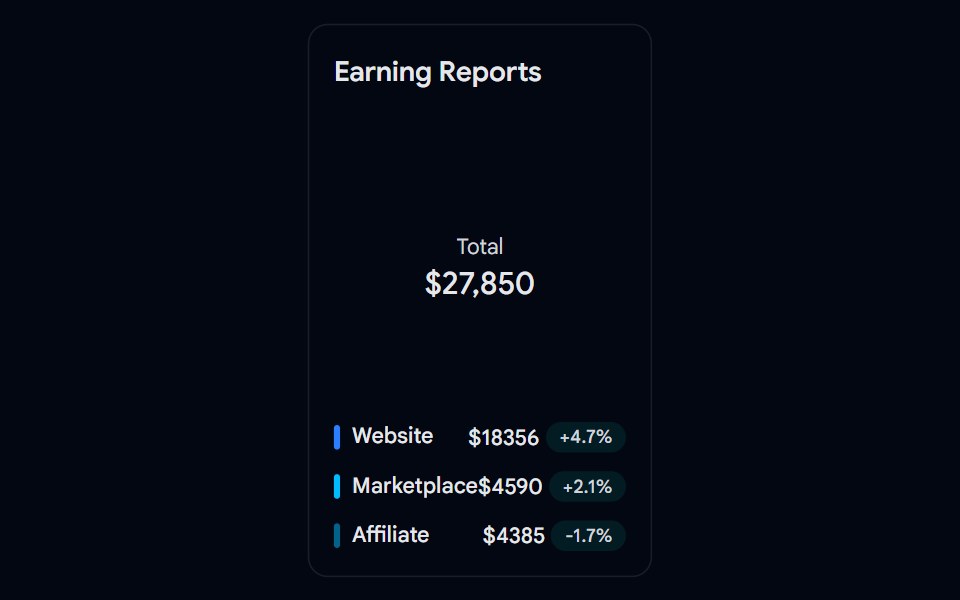 Chart 02 - Earnings Pie ChartShadcn Space · ReactA clean donut chart widget summarizing total earnings with source-wise breakdown, perfect for admin dashboards to…
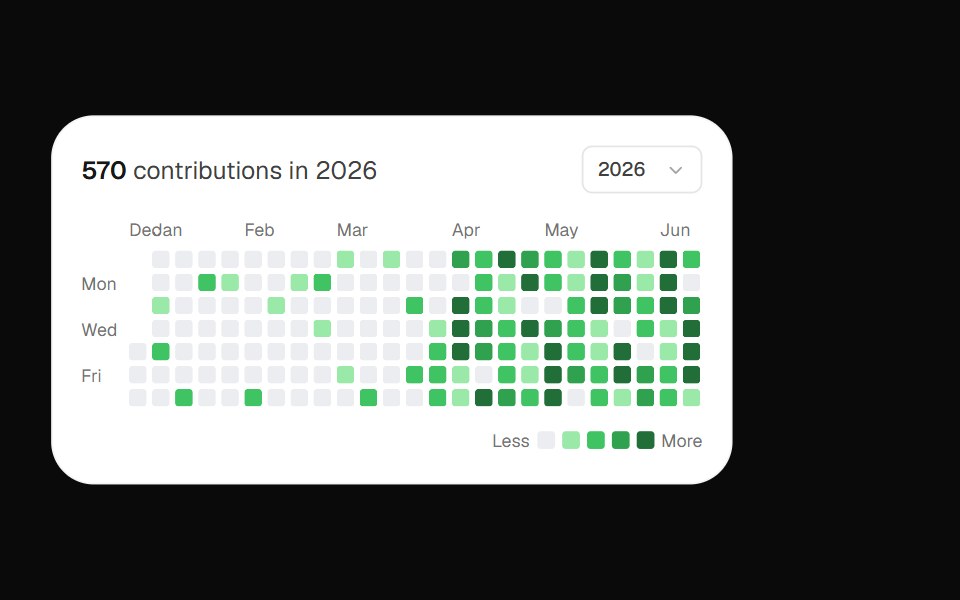 Github ContributionOpenSourceUI · React
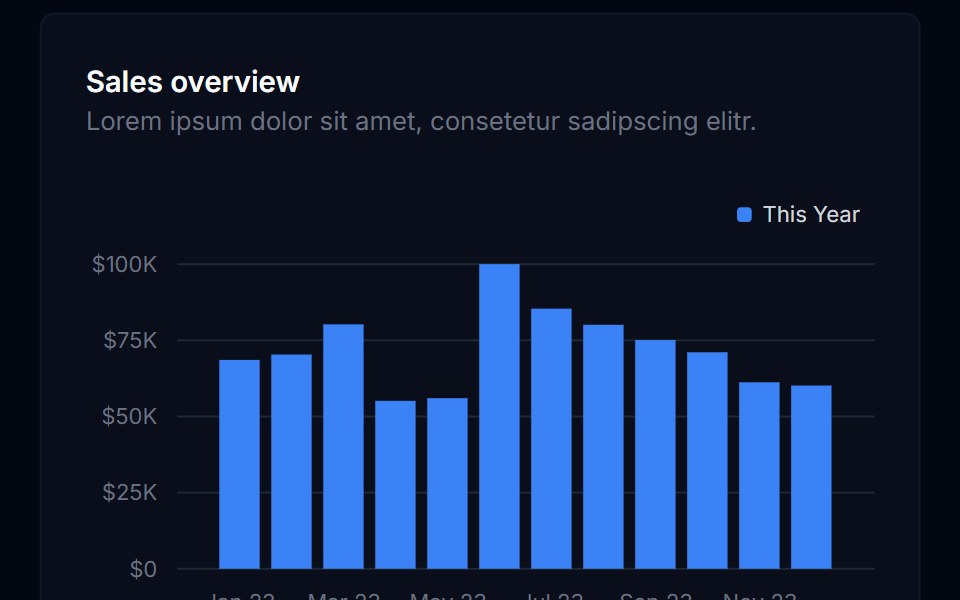 Bar ChartTremor Blocks · ReactThe base bar chart component (Recharts): vertical or horizontal bars, grouped or stacked, legend and tooltip…
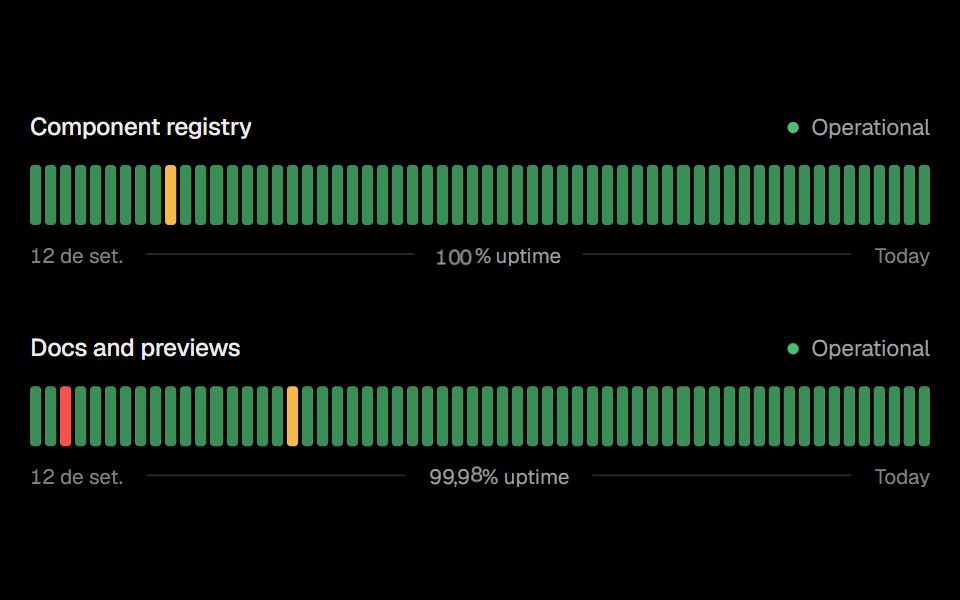 Status BarsObsidianUI · React
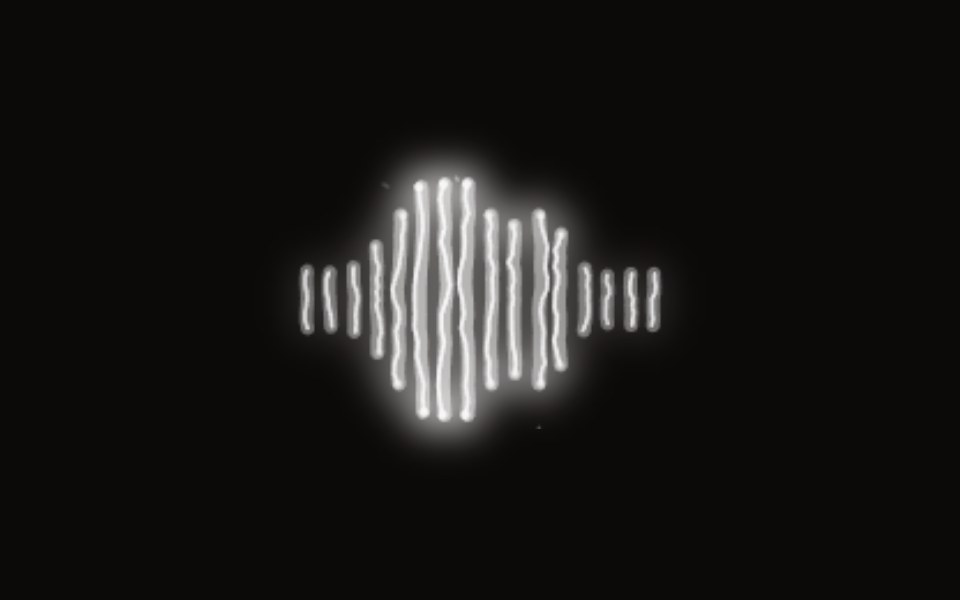 Electric Bar Visualizeraudiocn · ReactFrequency-band bars drawn as crackling filaments, with arcs between loud neighbours and sparks on sudden rises. Takes…
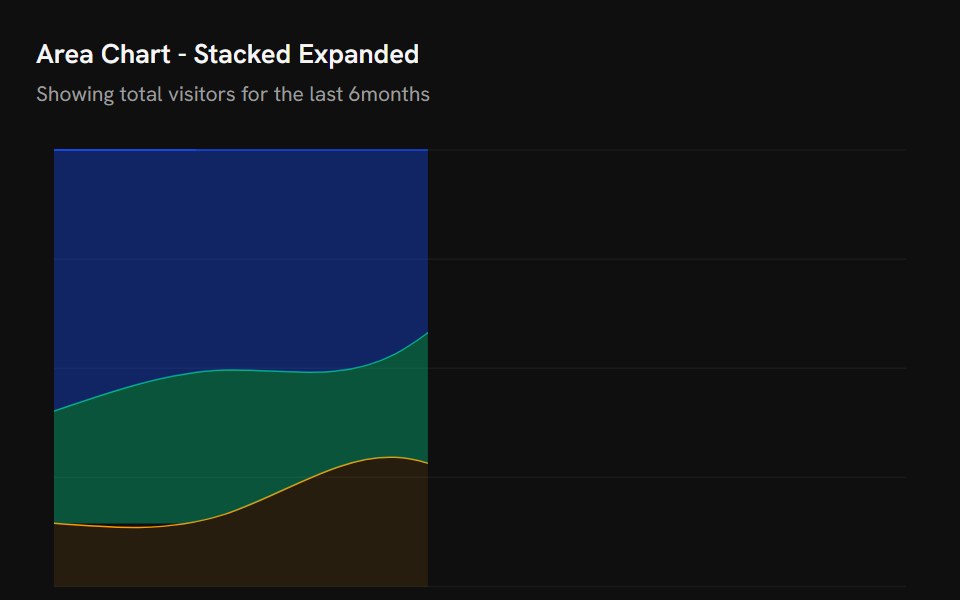 Chart Area Stacked ExpandShark UI · ReactStacked area chart example normalised to 100%, showing each series as a share of the total.
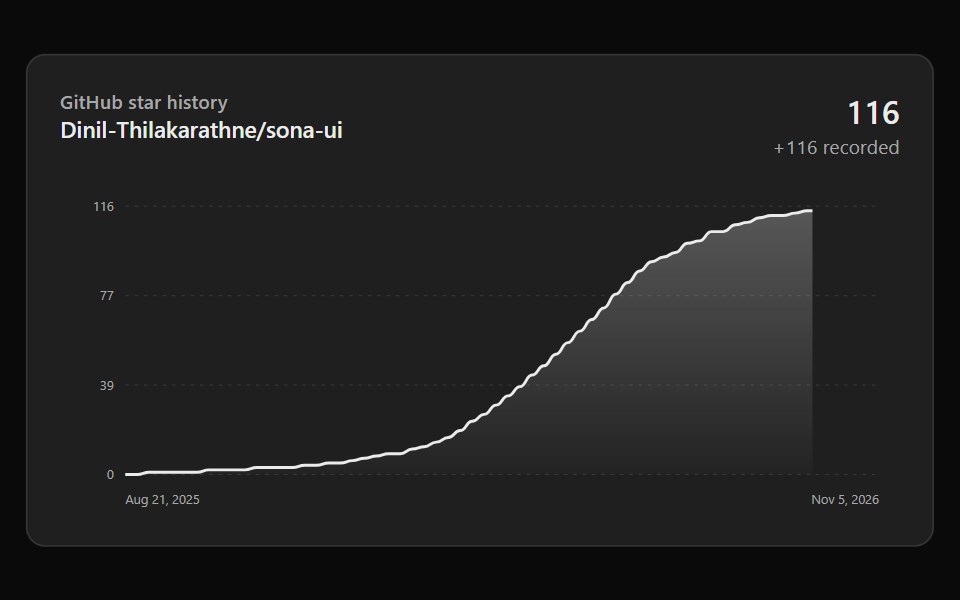 Github Star HistorySona UI · React
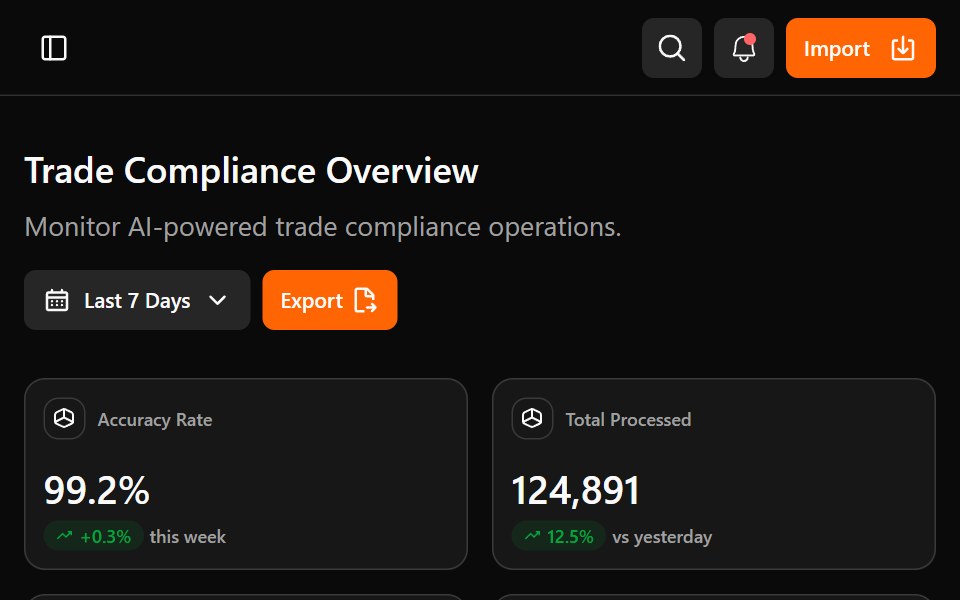 Astrix DashboardWatermelon UI · ReactA trade compliance workspace with AI classification metrics, a live pipeline, HS code stream review, and light and…
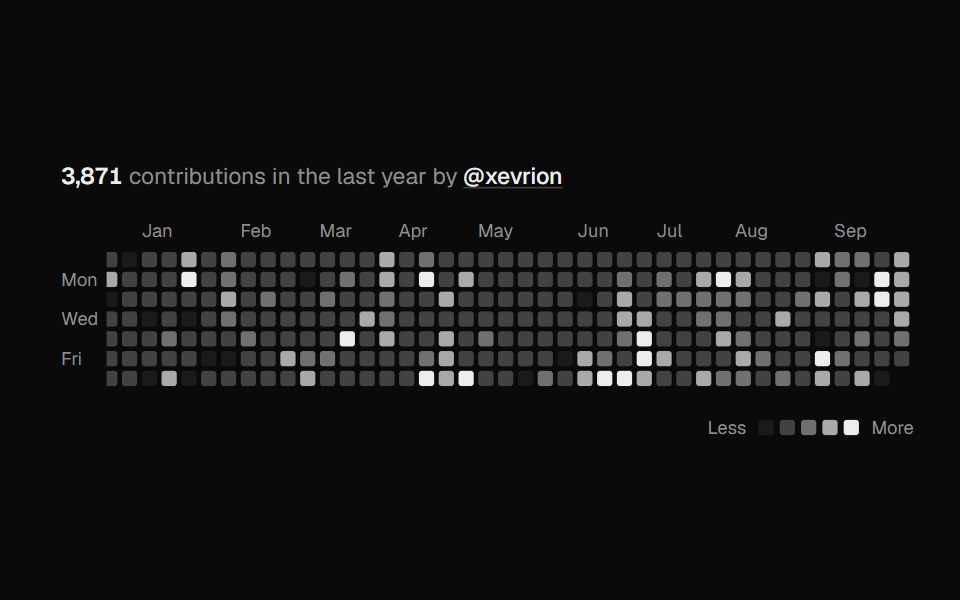 Contribution HeatmapUI Lab · ReactA year of activity at a glance, sweeping in week by week.
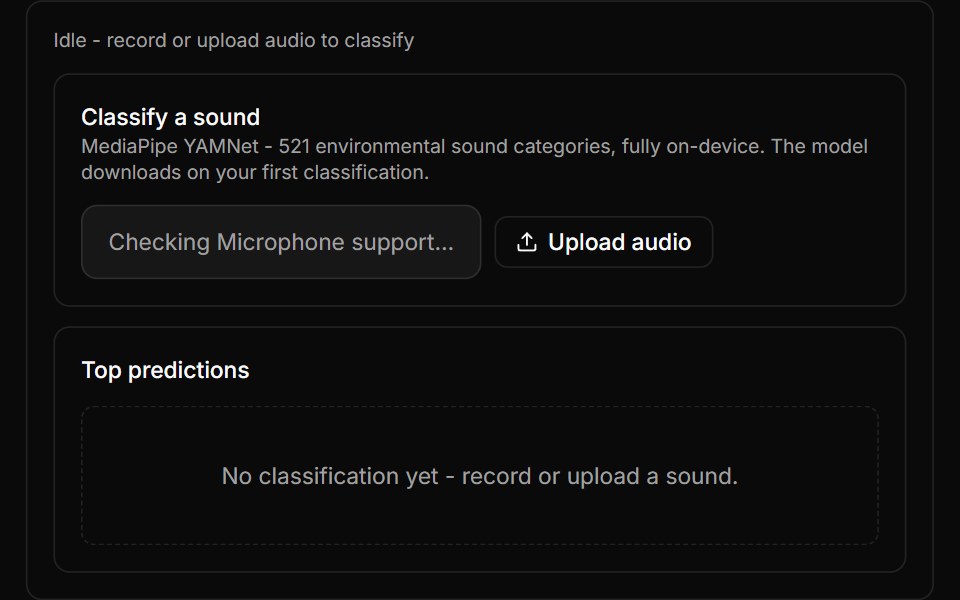 Audio Classifier BlockLocalMode · ReactMediaPipe YAMNet (521 environmental sound categories) top-8 classification of a microphone recording (MediaRecorder…
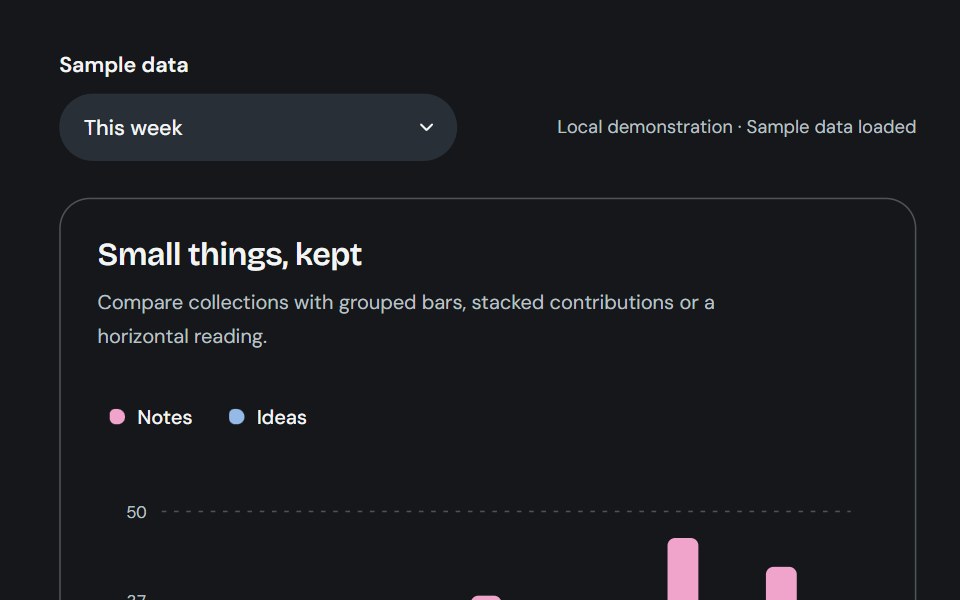 Bar chartCojeev UI · ReactCompare series with grouped, stacked or horizontal bars and a shared interactive tooltip.
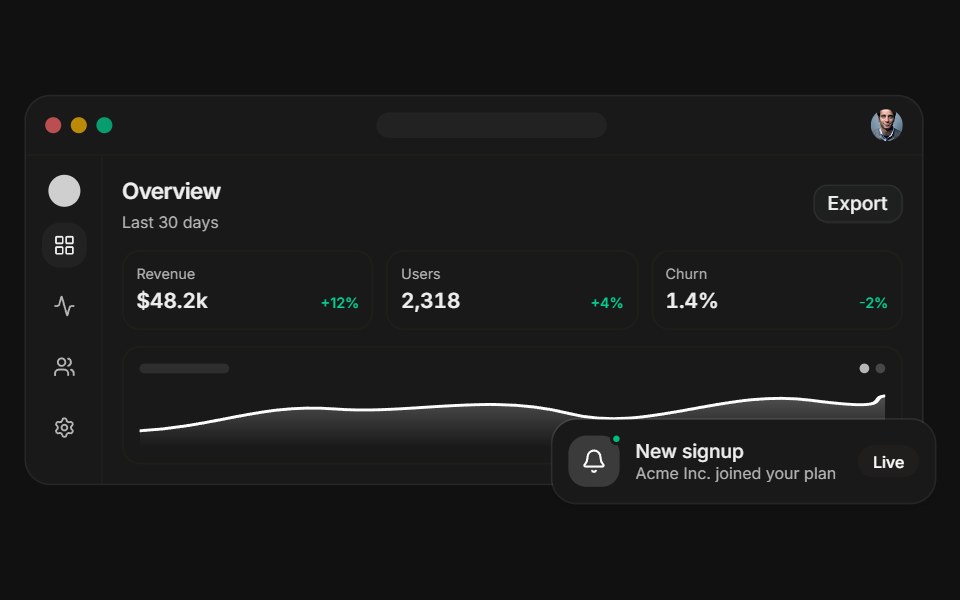 Dashboard previewFLX UI · ReactA layered app dashboard with a floating notification.
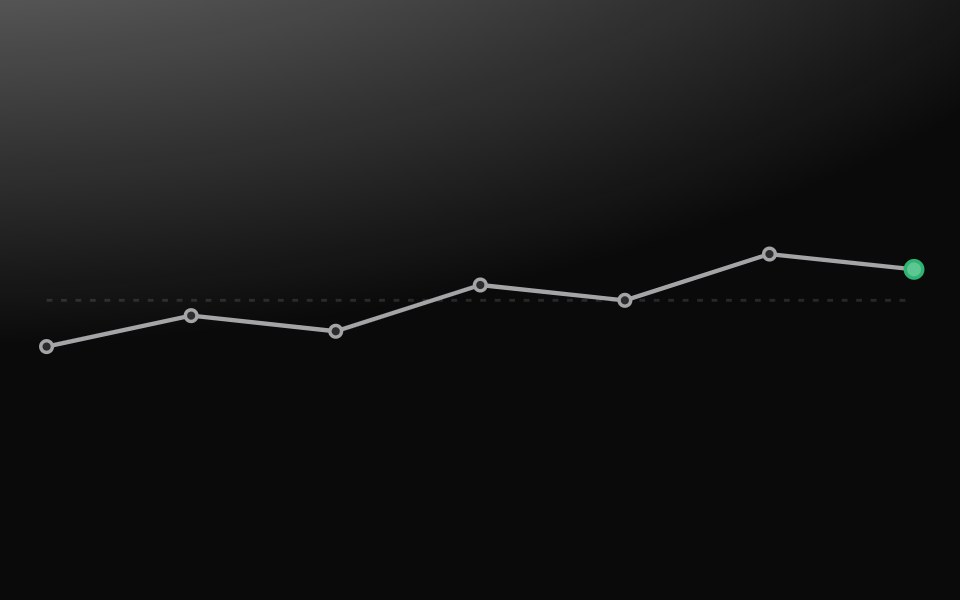 SparklineMetal UI · React + SwiftUIA small series plot: a line with gaps, dots, the last point emphasised, a dashed baseline at the average.
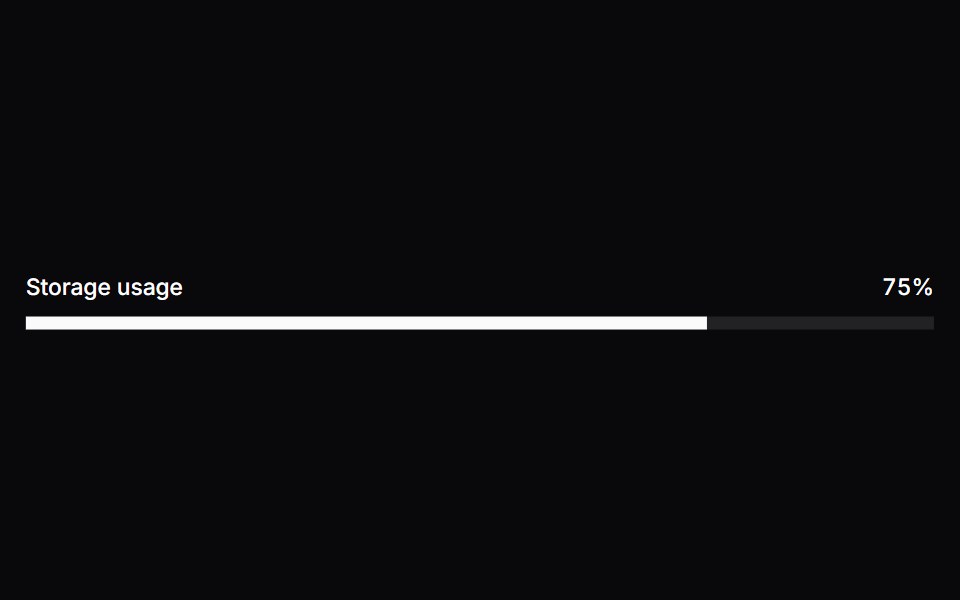 MeterSpaceUI · ReactDisplays a visual gauge bar showing a quantity within a known range, such as battery level, disk capacity, or password…
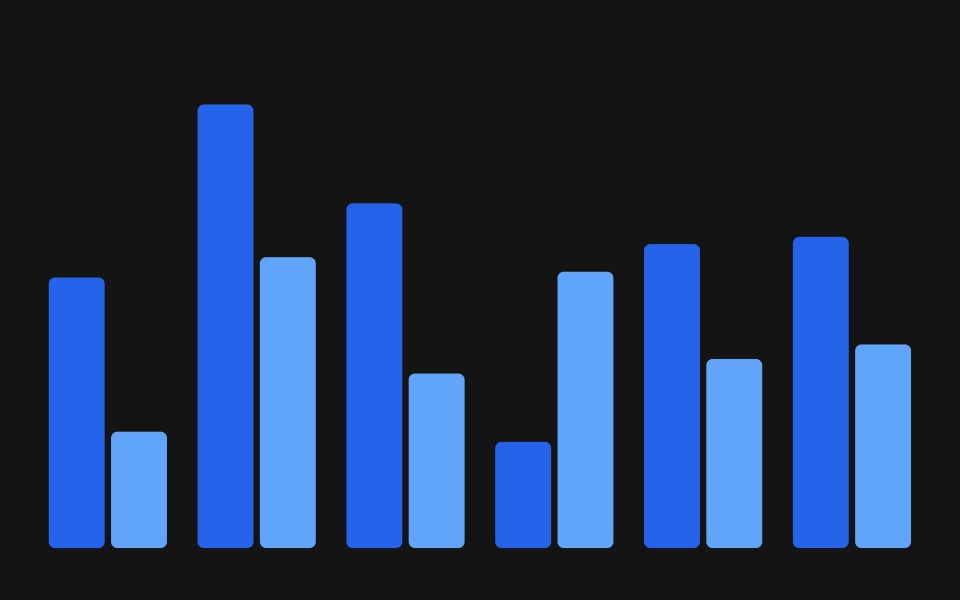 ChartD2Studio UI · ReactBeautiful charts built using Recharts, themed from CSS variables.
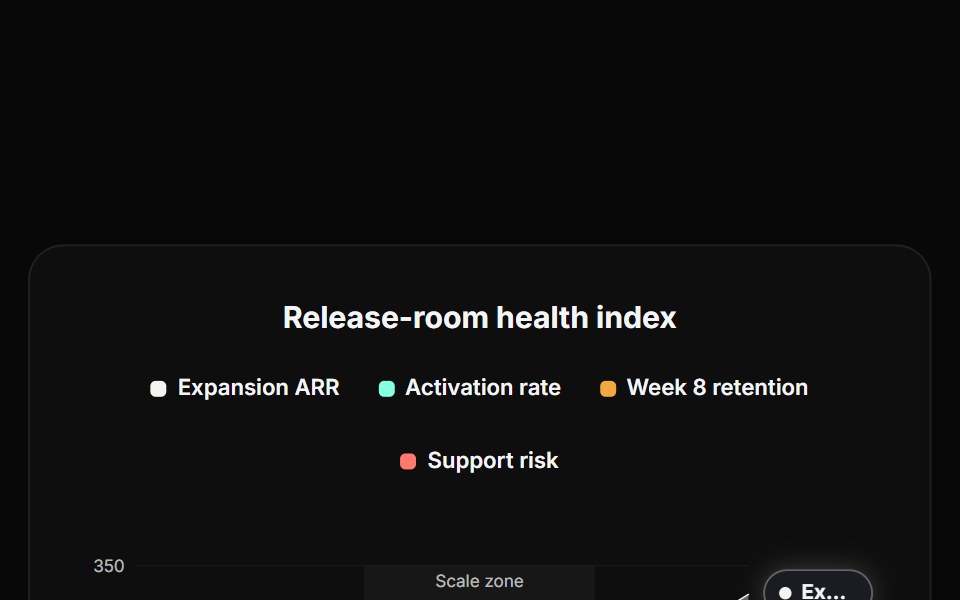 Line ChartReactFrame · ReactA multi-series line/area chart, smooth Catmull-Rom curves, a highlighted zone band, a reference line, endpoint value…
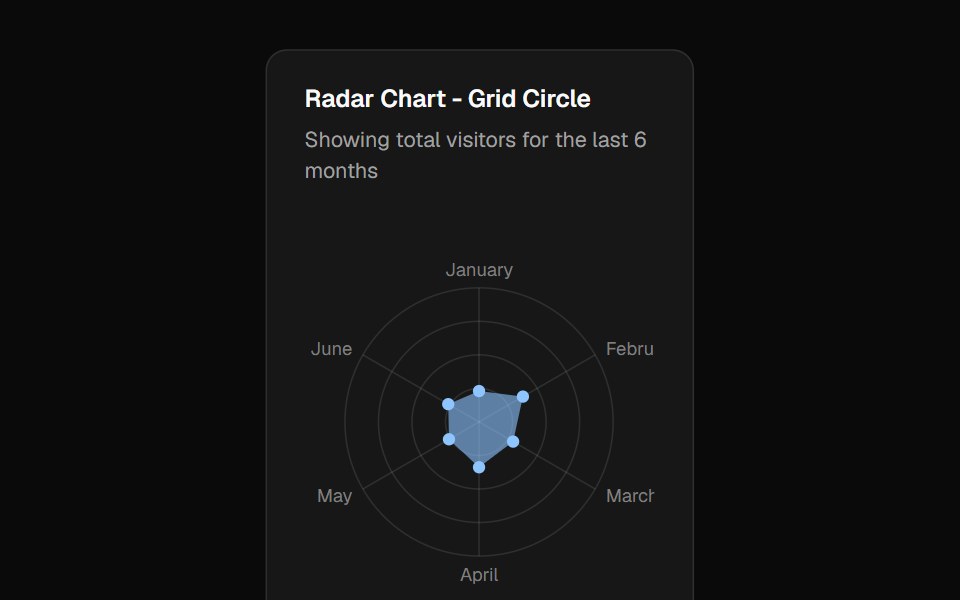 Chart Radar Grid Circleshadcn/ui · ReactRadar chart example with a circular polar grid.
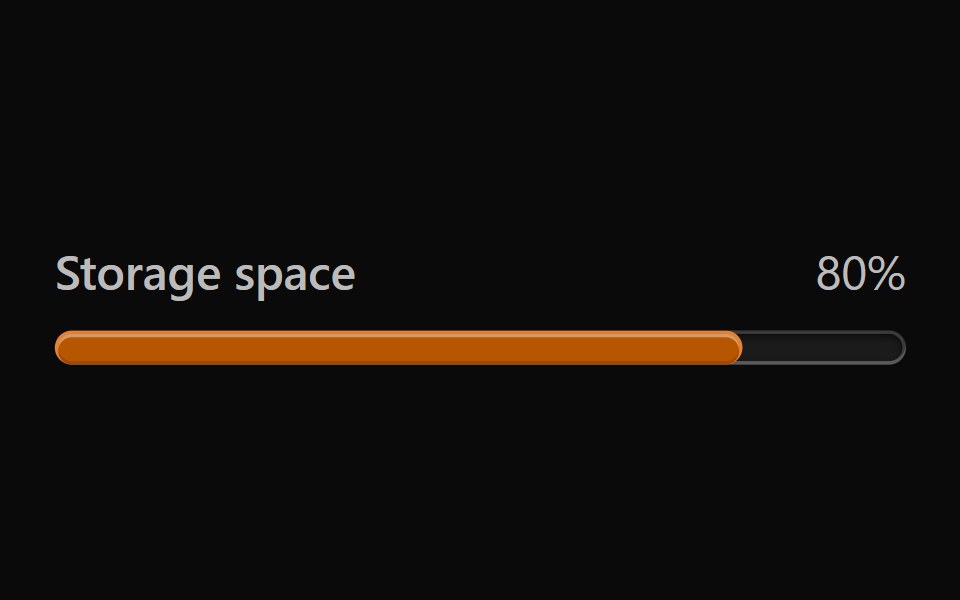 Vanilla MeterReact Spectrum · React
 Bar ListTremor · React
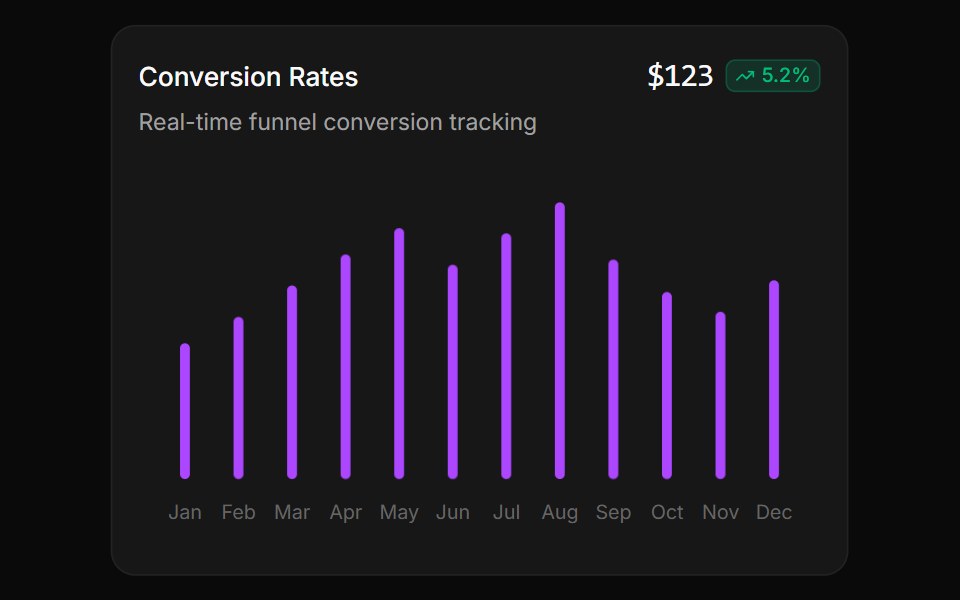 Animated monochrome bar chartReUI · ReactAnimated monochrome bar chart
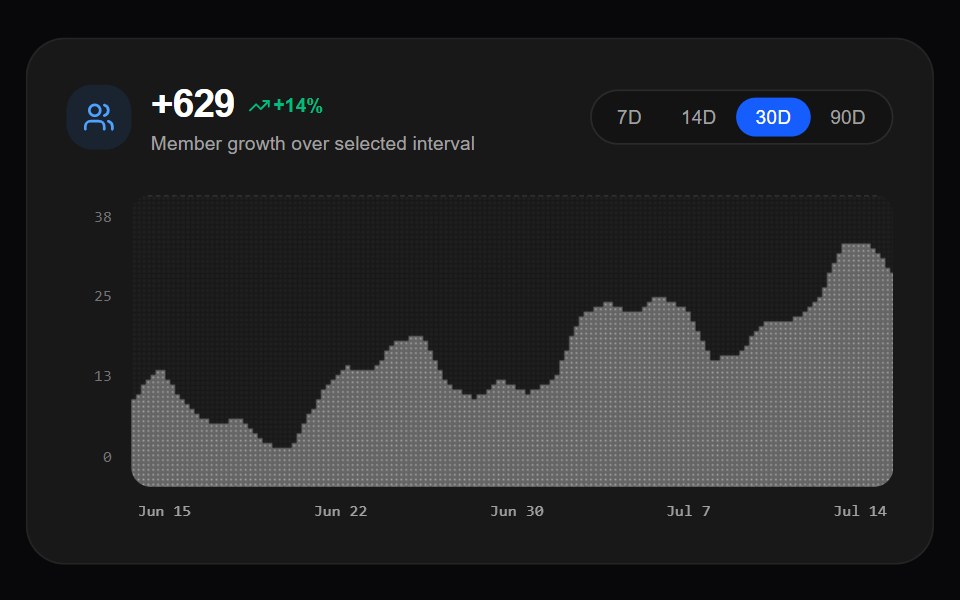 Dither Growth ChartAmicro Micro Transitions · React60fps canvas growth line chart with pixel dither fill matrix.
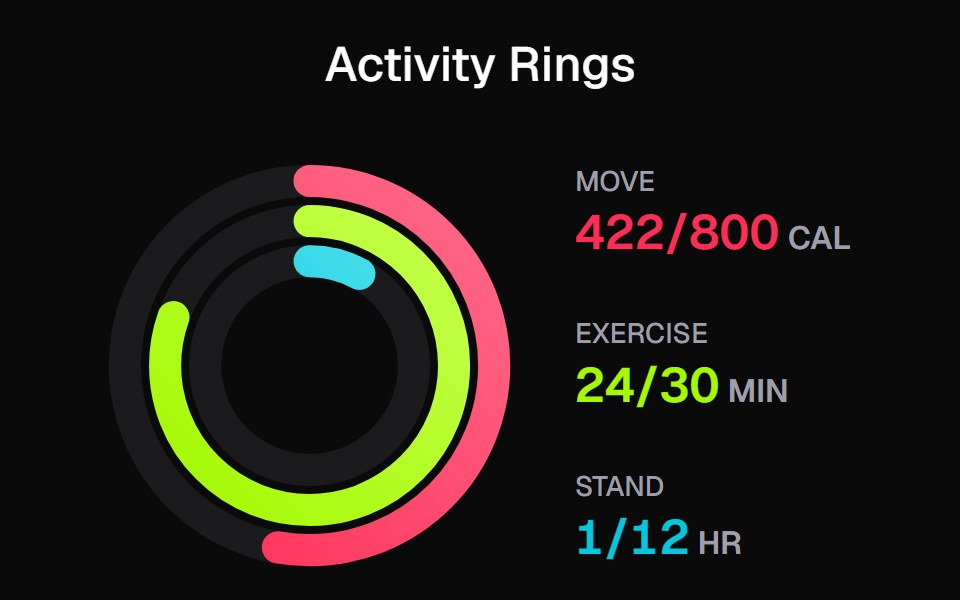 Apple Activity CardKokonut UI · ReactActivity rings that draw with a count-up, lap past 100% with a shadowed end cap and dim to focus, built with React and…
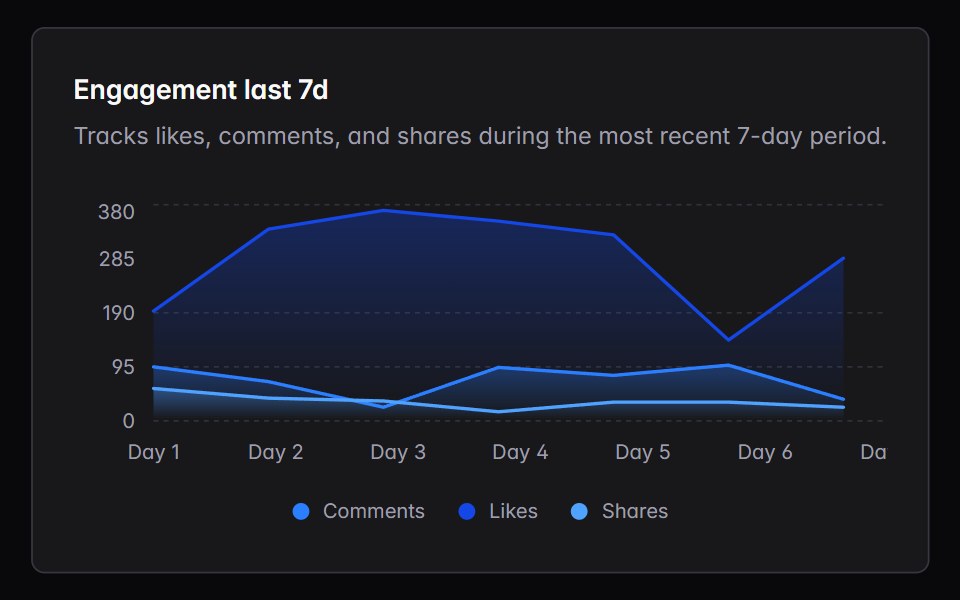 chartIntent UI · Reactchart
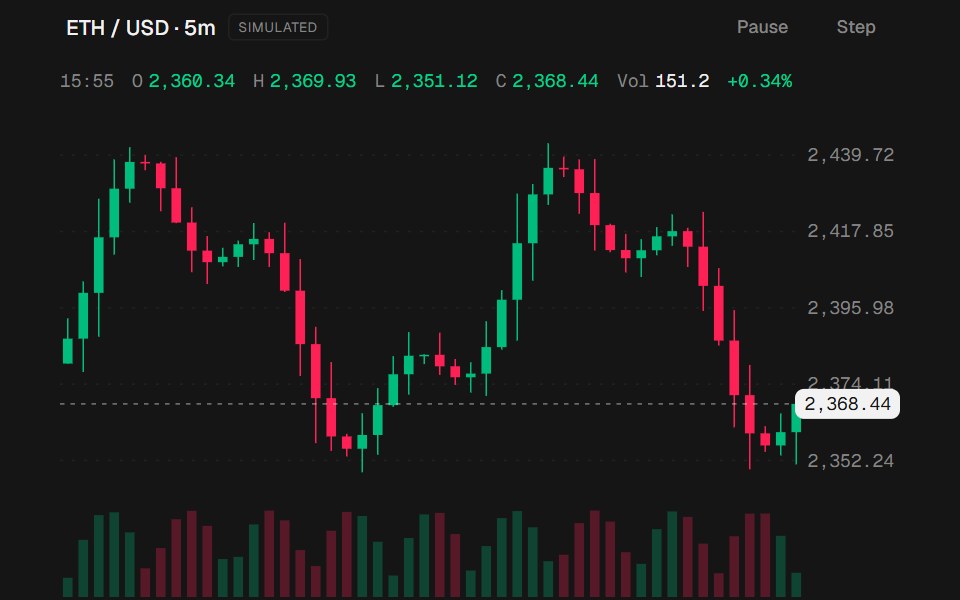 Candlestick ChartbeUI · ReactLive OHLC candles with volume, a last-price line, and a crosshair readout.
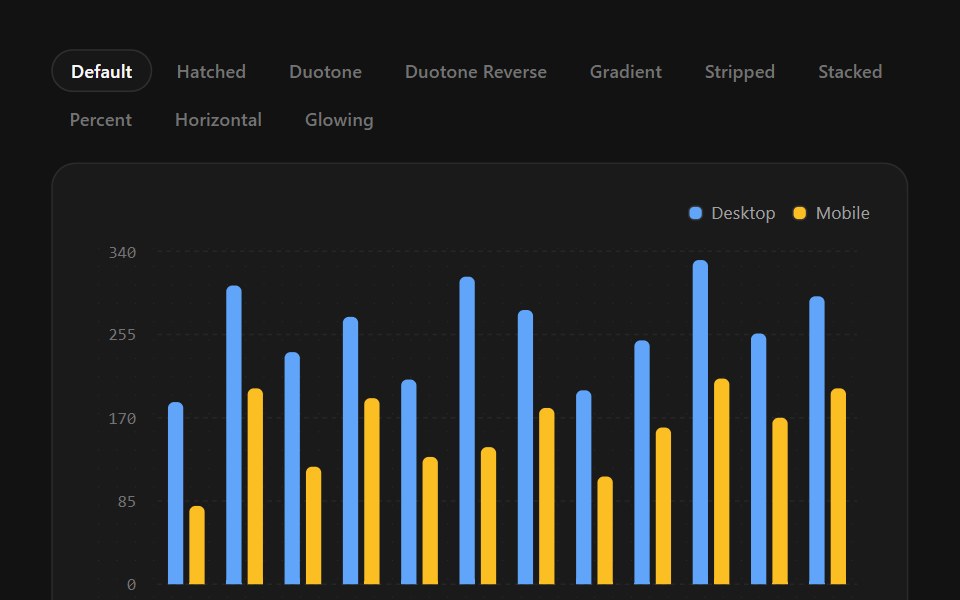 Bar ChartSpectrum UI · ReactVertical and horizontal bars with hatch, duotone, gradient, stripe, stack, and glow fills.
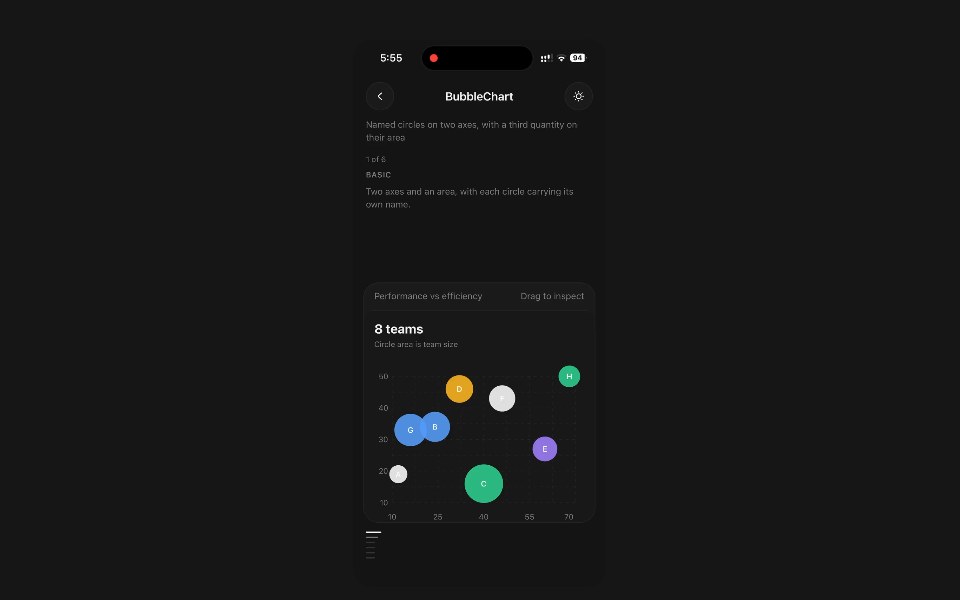 Bubble ChartPanel UI · React NativeNamed circles on two axes, with a third quantity on their area.
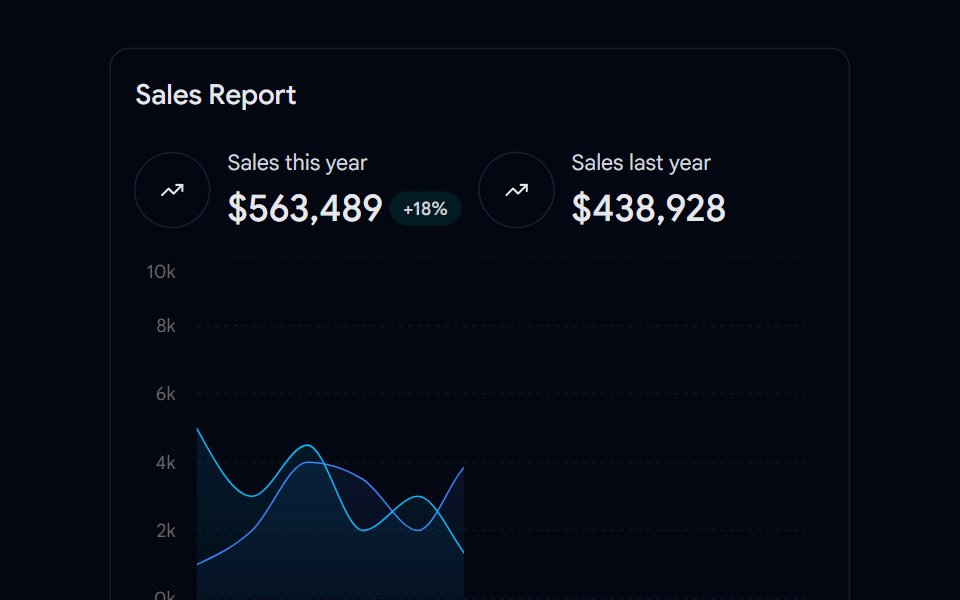 Chart 03 - Yearly Sales ComparisonShadcn Space · ReactA smooth line chart comparing this year versus last year sales with summary stats, ideal for dashboards to visualize…
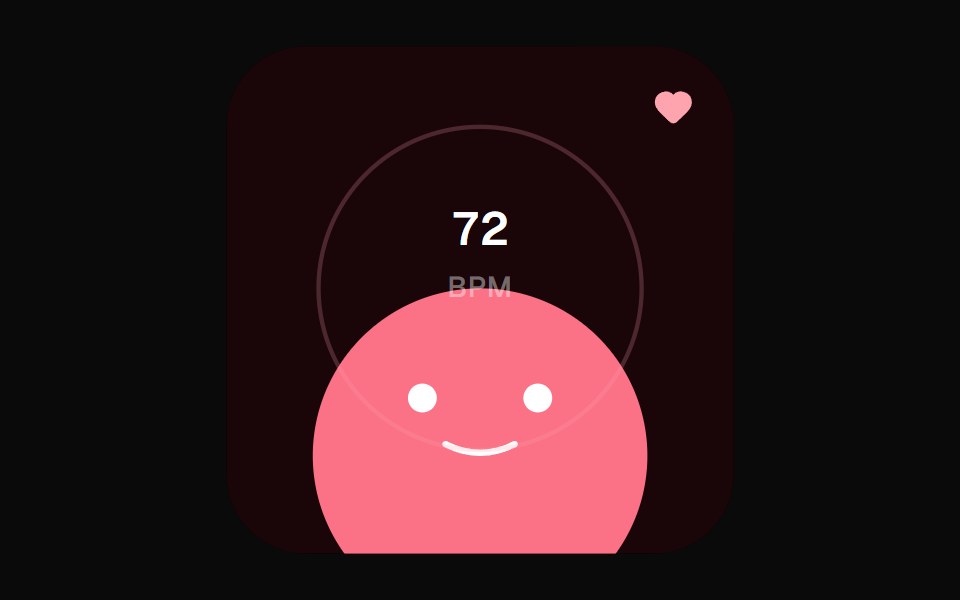 Heart Rate WidgetOpenSourceUI · React
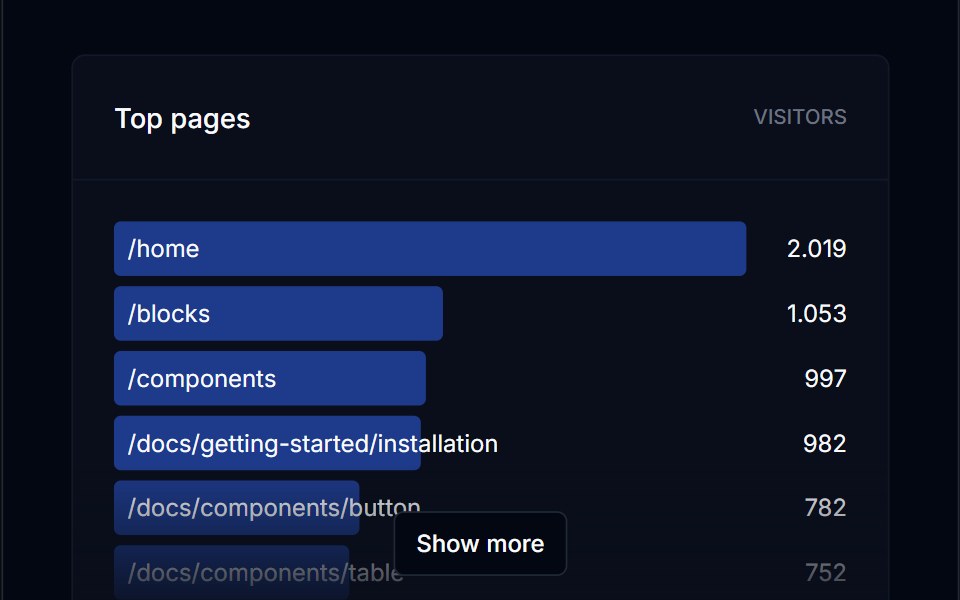 Bar ListTremor Blocks · ReactRanked list of horizontal bars, each with a name and a value, sorted ascending or descending.
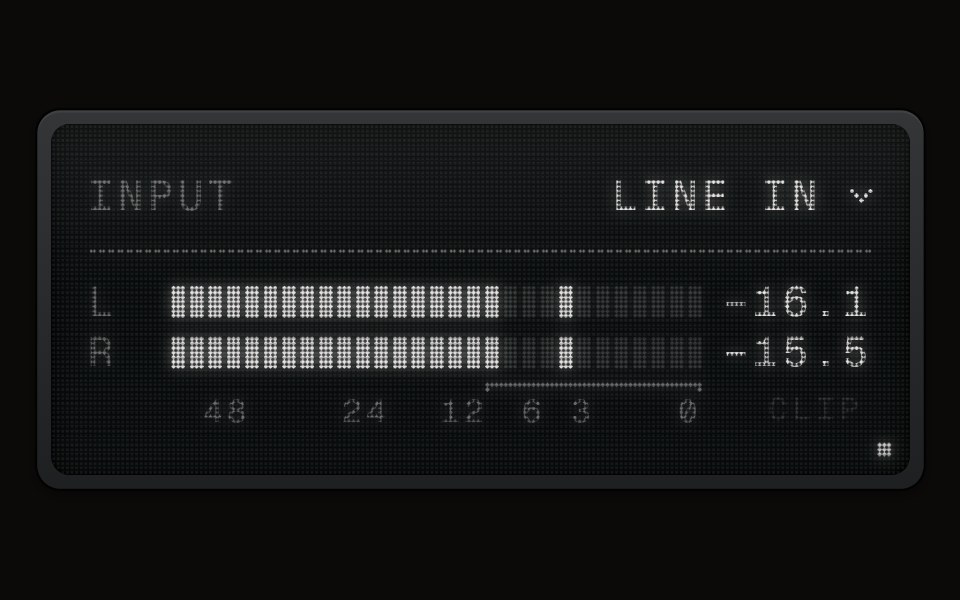 LCD Meteraudiocn · ReactA recorder-style level meter on an LCD Display's screen: block segments in the display's ink that light whole, a held…
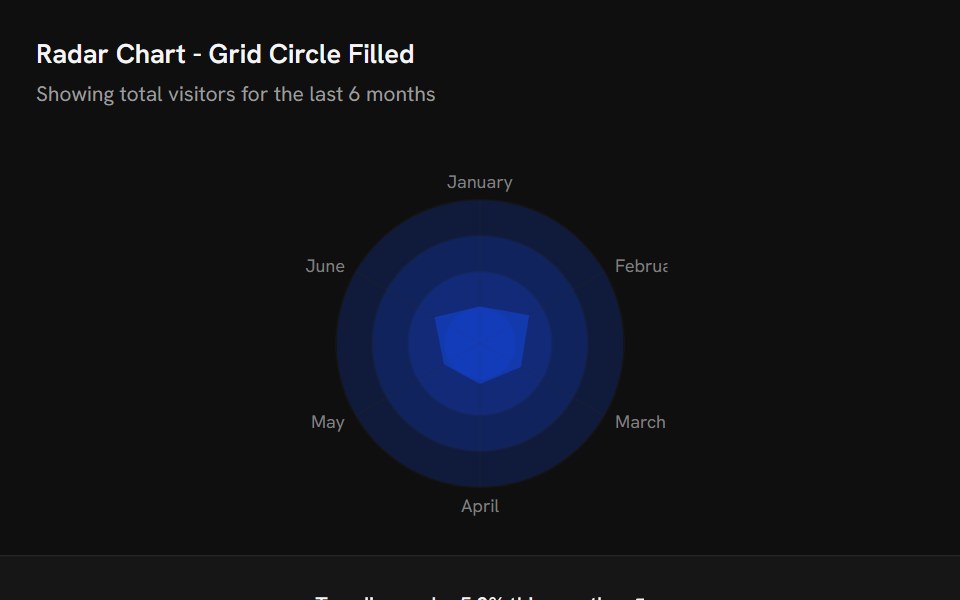 Chart Radar Grid Circle FillShark UI · ReactRadar chart example with a filled circular polar grid.
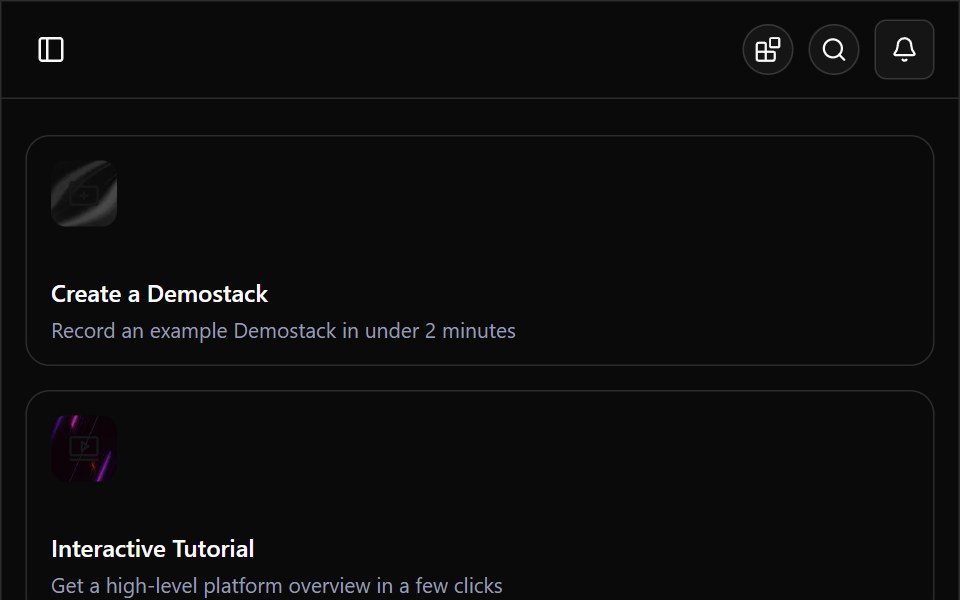 Demostack DashboardWatermelon UI · ReactA responsive product-demo workspace with organization switching, resource discovery, team filtering, and light and…
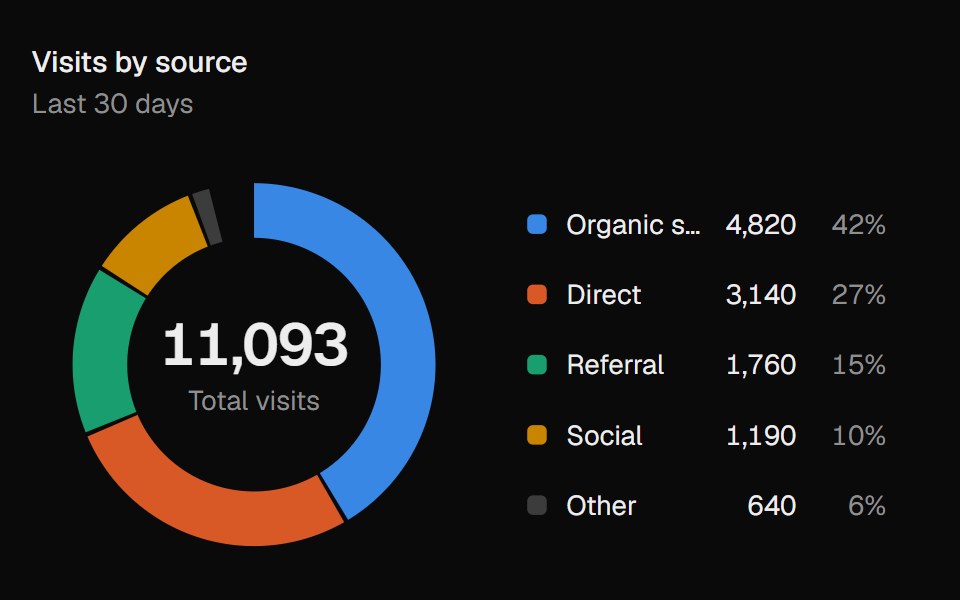 Donut ChartUI Lab · ReactDraws itself in, then lifts whichever slice you point at.
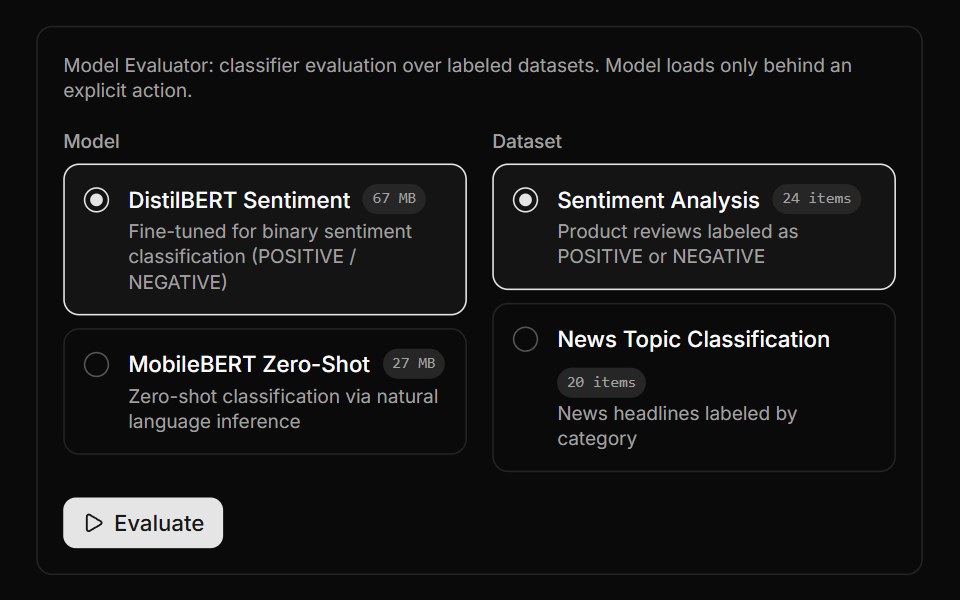 Model Evaluator BlockLocalMode · ReactEvaluate a selected classifier over a selected labeled dataset via useEvaluateModel, reporting accuracy plus macro…
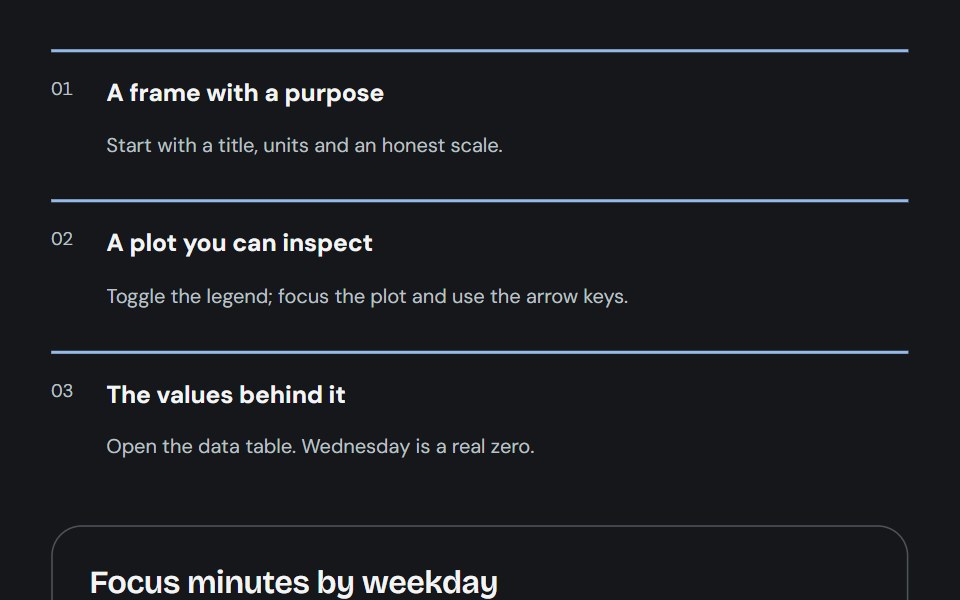 ChartCojeev UI · ReactCompose an understandable chart from a frame, labelled series, inspectable plot and accessible values.
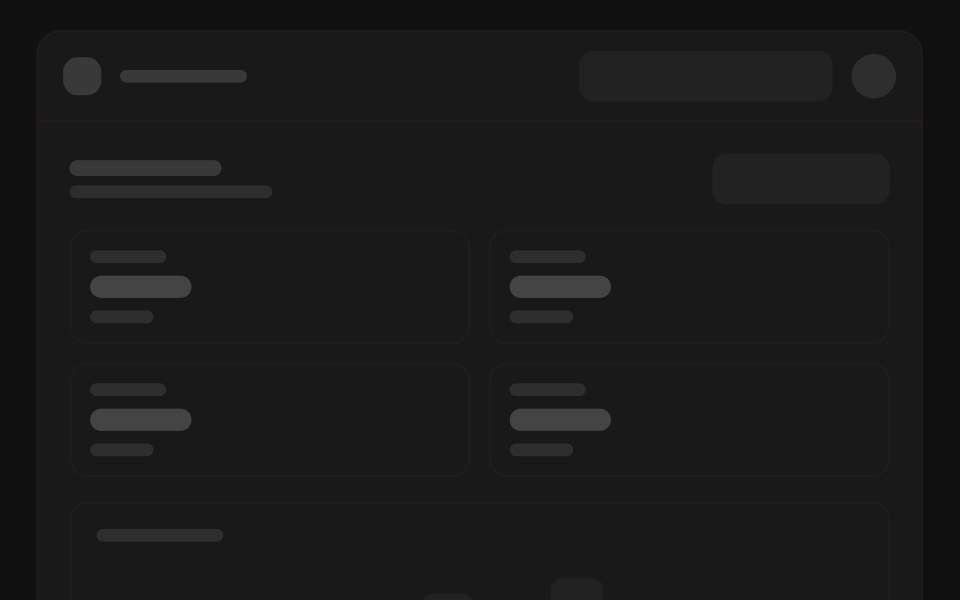 Analytics overviewFLX UI · ReactWireframe: sidebar, stat cards, chart, and a list.
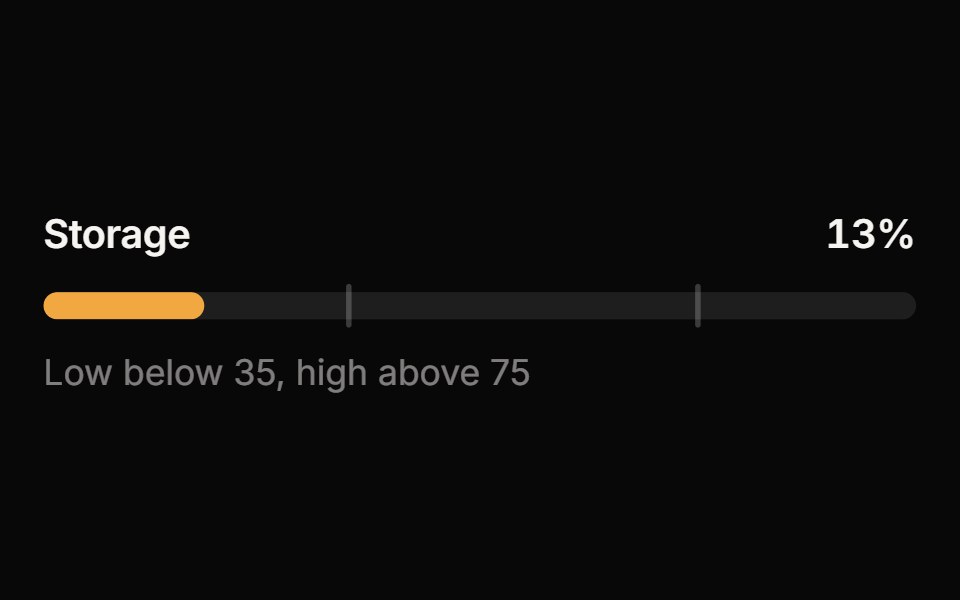 MeterReactFrame · ReactA meter for a value within a known range: bar, semicircle gauge or segmented variants with threshold zones, animated…
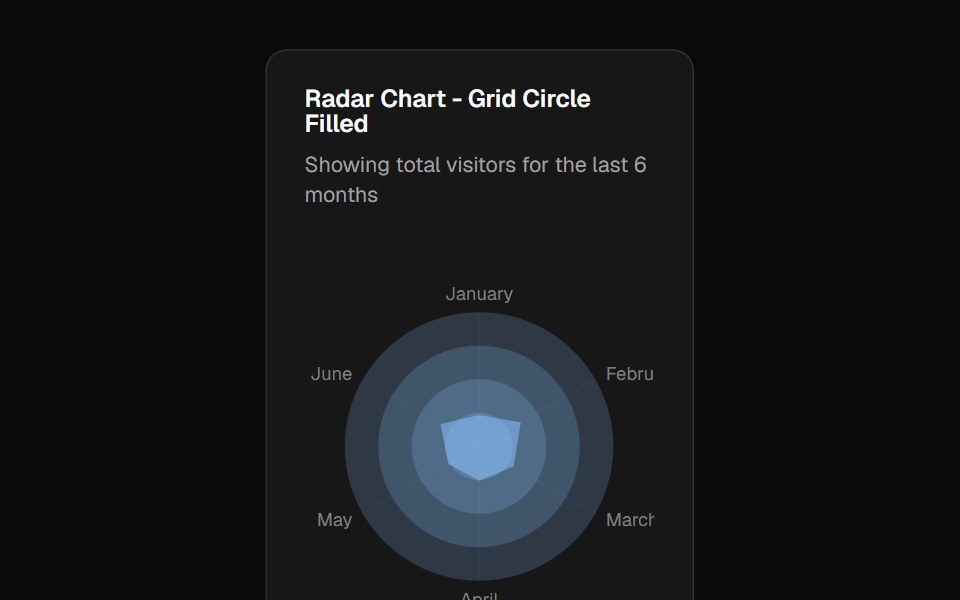 Chart Radar Grid Circle Fillshadcn/ui · ReactRadar chart example with a filled circular polar grid.
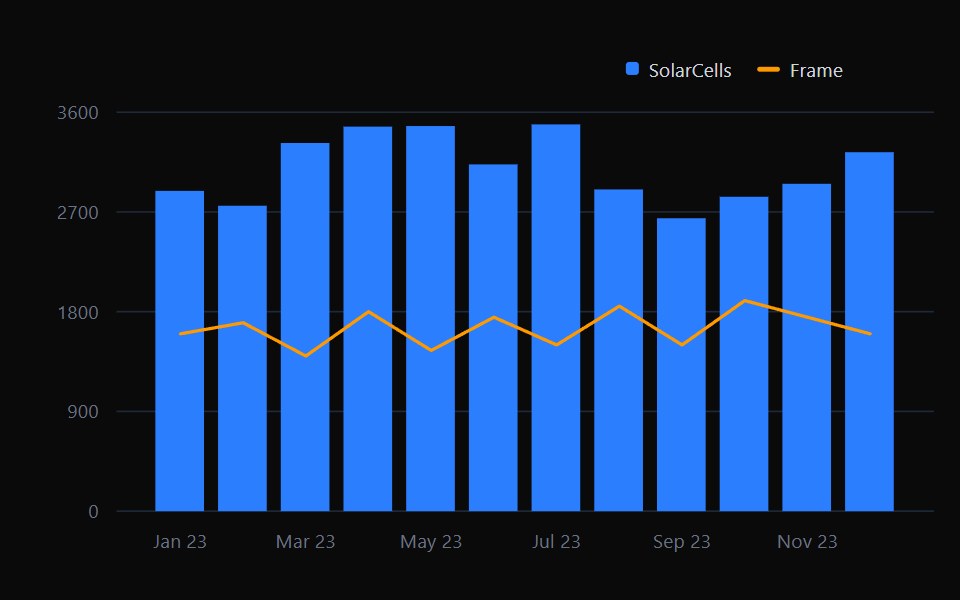 Combo ChartTremor · React
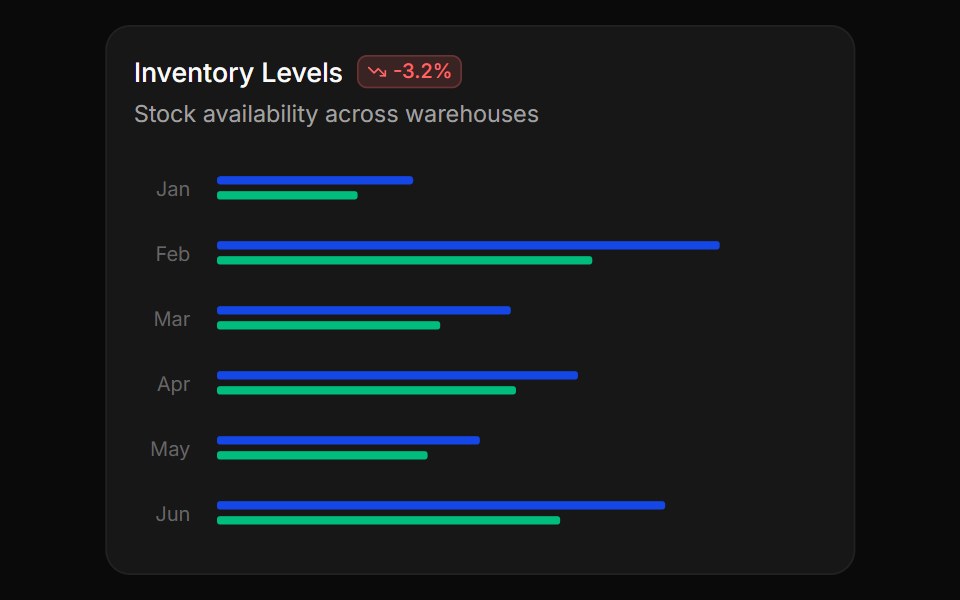 Vertical bar chartReUI · ReactVertical bar chart
 Segmented Arc MeterAmicro Micro Transitions · ReactStepped 4-bar discrete vertical gauge with percentage readout.
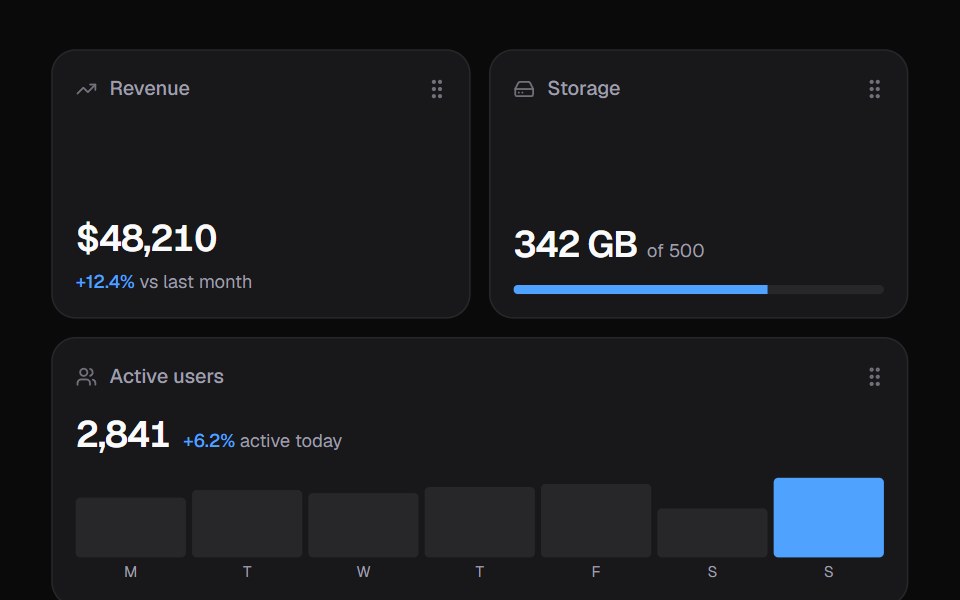 Widget GridKokonut UI · ReactDashboard widgets you lift, drag and resize on a 6-column grid, with spring physics and full keyboard support.
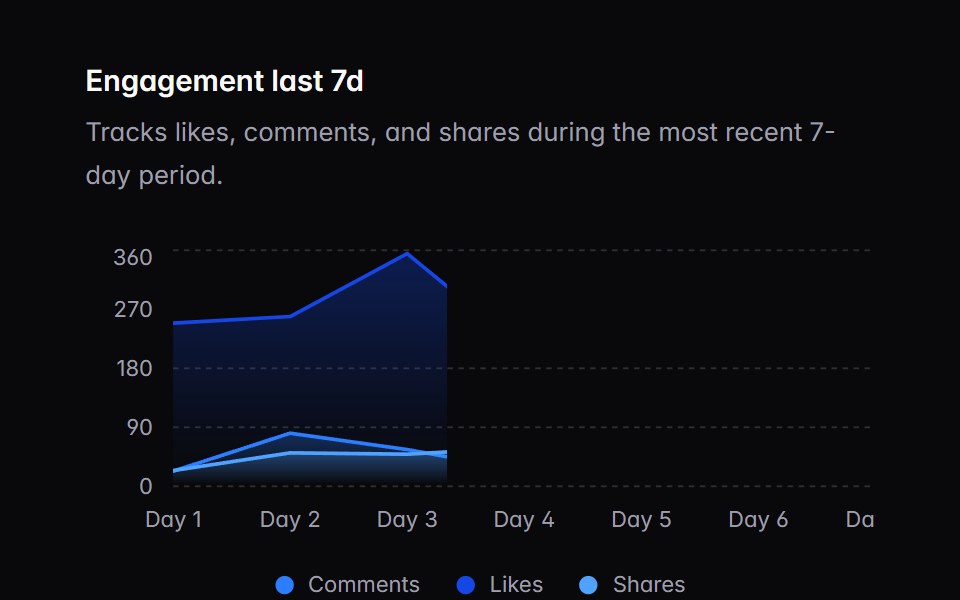 chart-01Intent UI · Reactchart-01
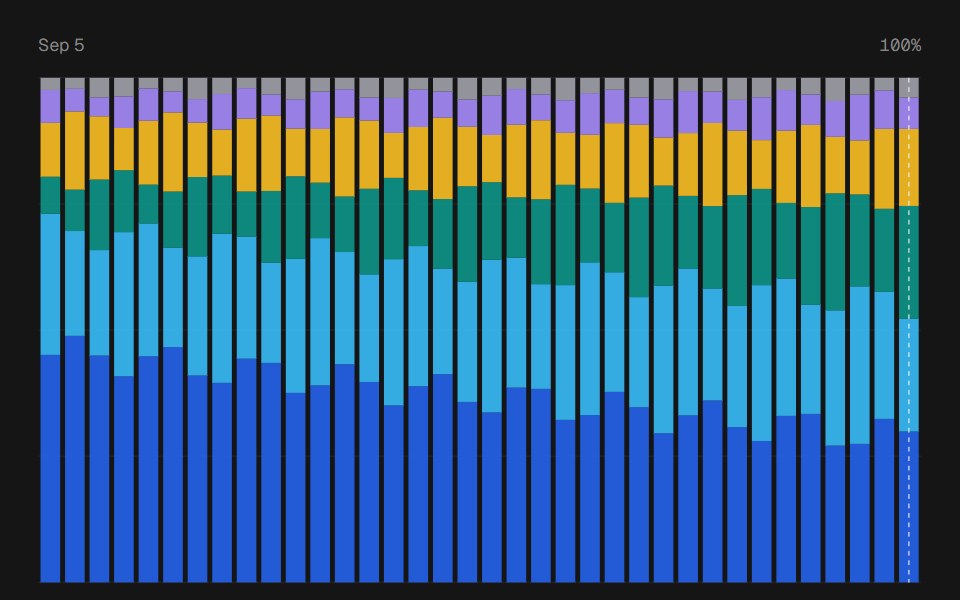 Composition ChartbeUI · ReactStacked bar and area shares with period tooltips and a compact interactive legend.
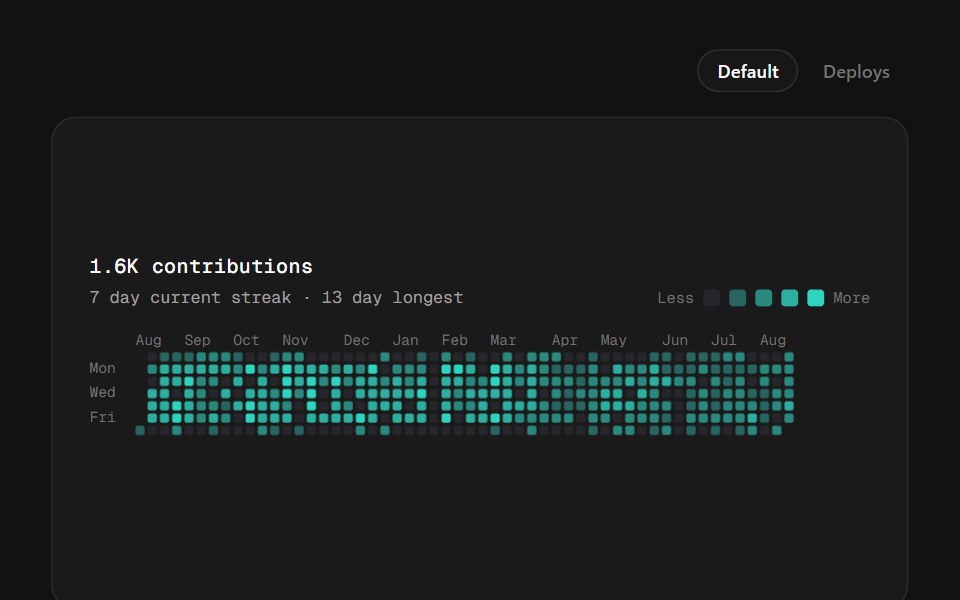 Calendar HeatmapSpectrum UI · ReactA year of daily values as week columns — the contributions grid, with five quantised intensity steps, streak stats…
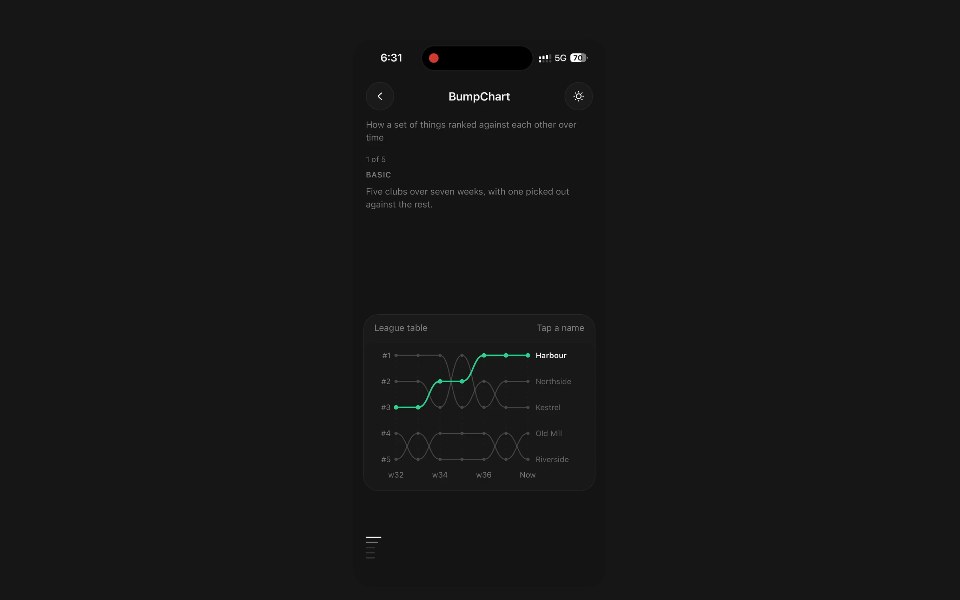 Bump ChartPanel UI · React NativeHow a set of things ranked against each other over time.
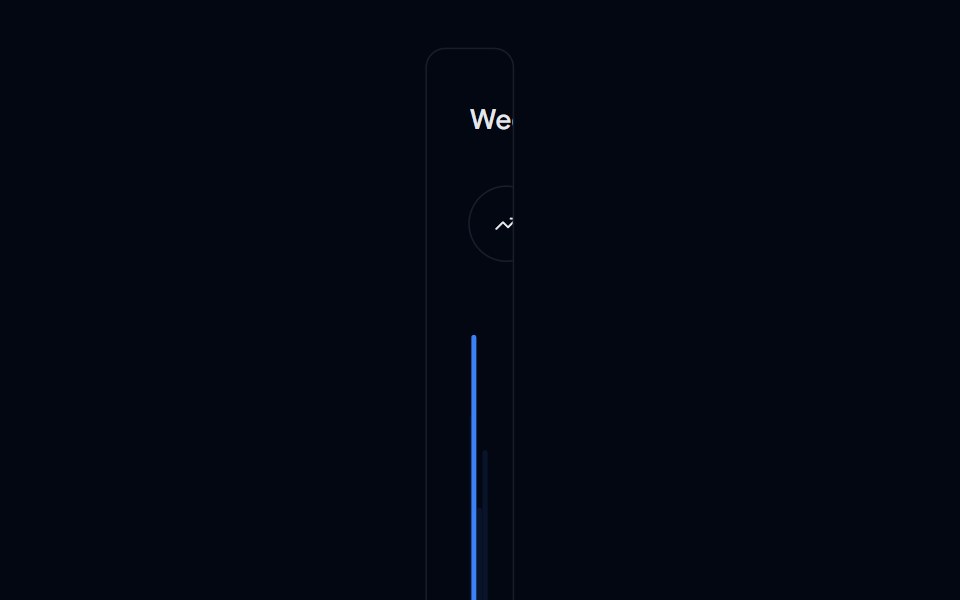 Chart 04 - Weekly SalesShadcn Space · ReactA compact bar chart widget showing daily sales for the past week with trend indicator, perfect for dashboards to…
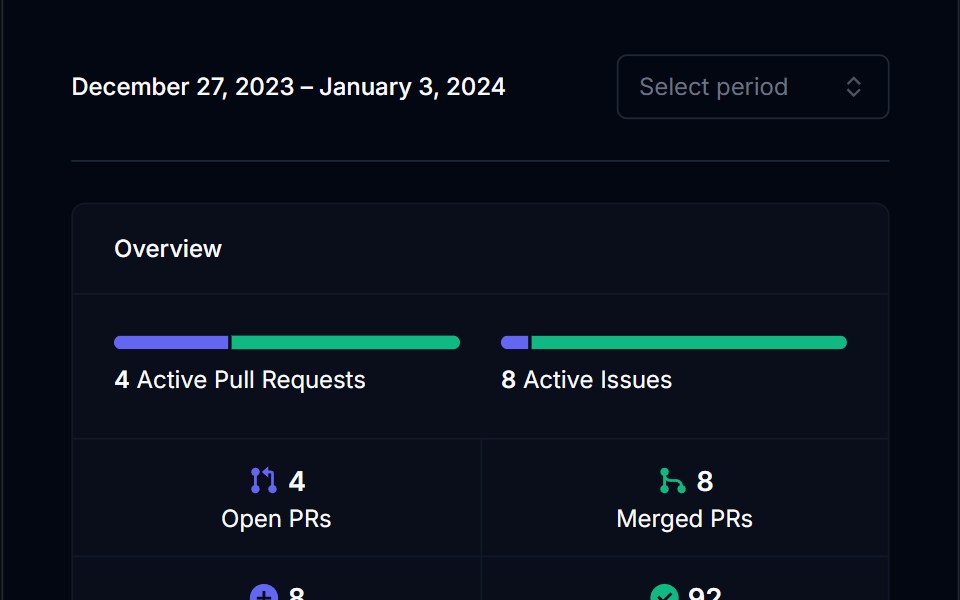 Category BarTremor Blocks · ReactSingle horizontal bar split into coloured segments, with threshold labels and an optional marker for the current value.
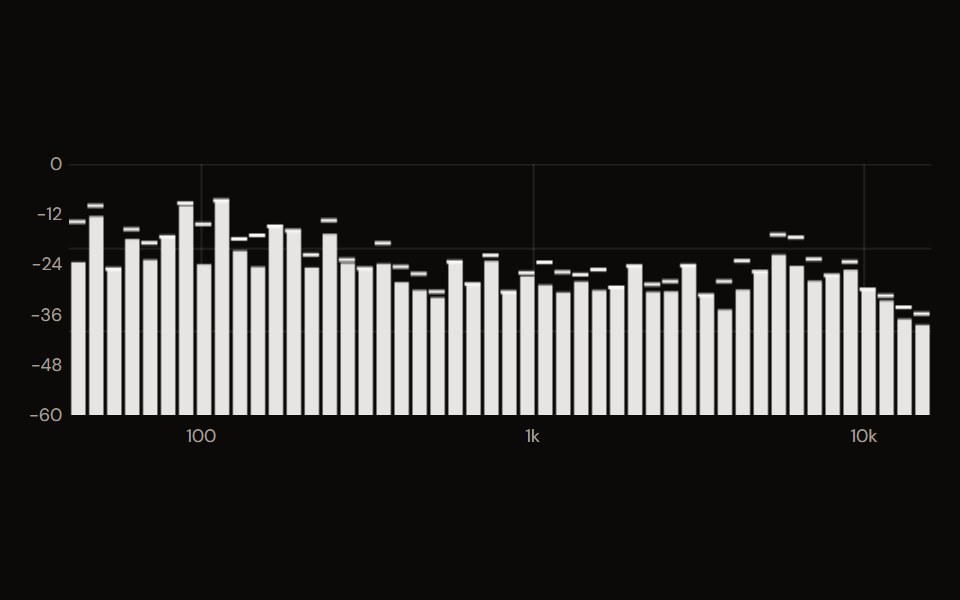 Spectrumaudiocn · ReactA frequency spectrum analyser drawn on canvas as bars, a line or an area, with peak hold, a grid and frequency and…
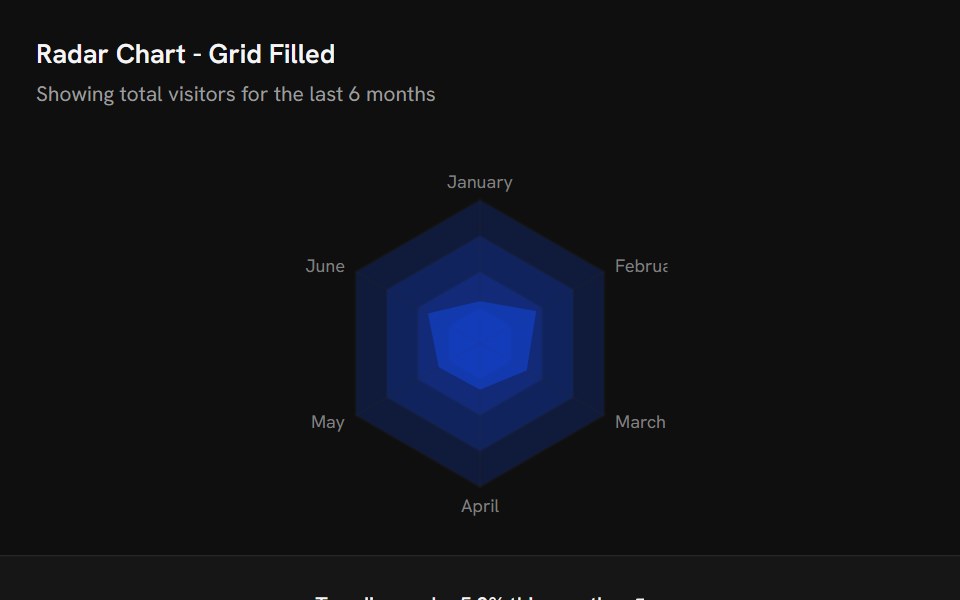 Chart Radar Grid FillShark UI · ReactRadar chart example with a filled polygon grid.
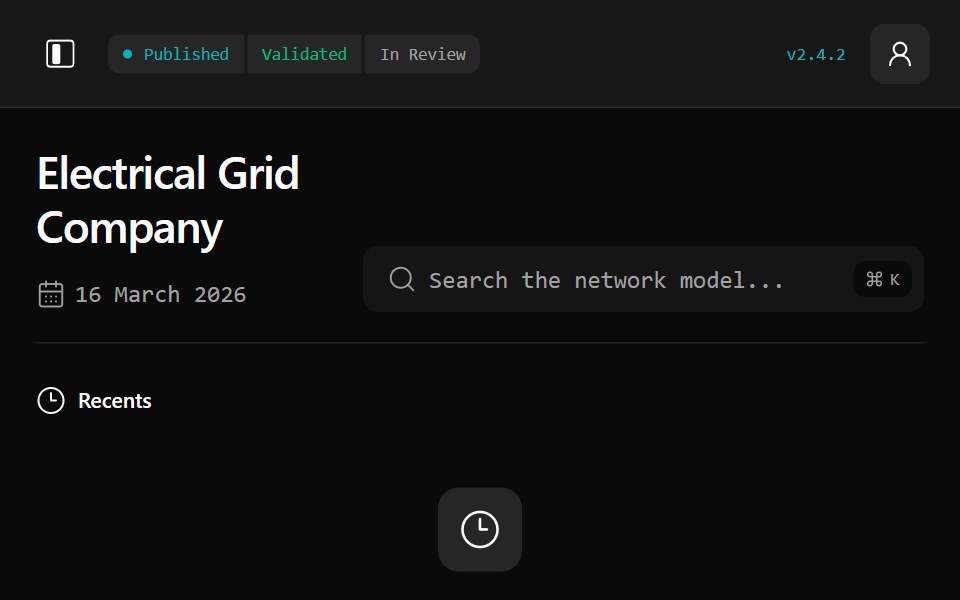 Gridline DashboardWatermelon UI · ReactA responsive electrical-grid workspace for network modelling, asset flexibility, planning, operations, and stakeholder…
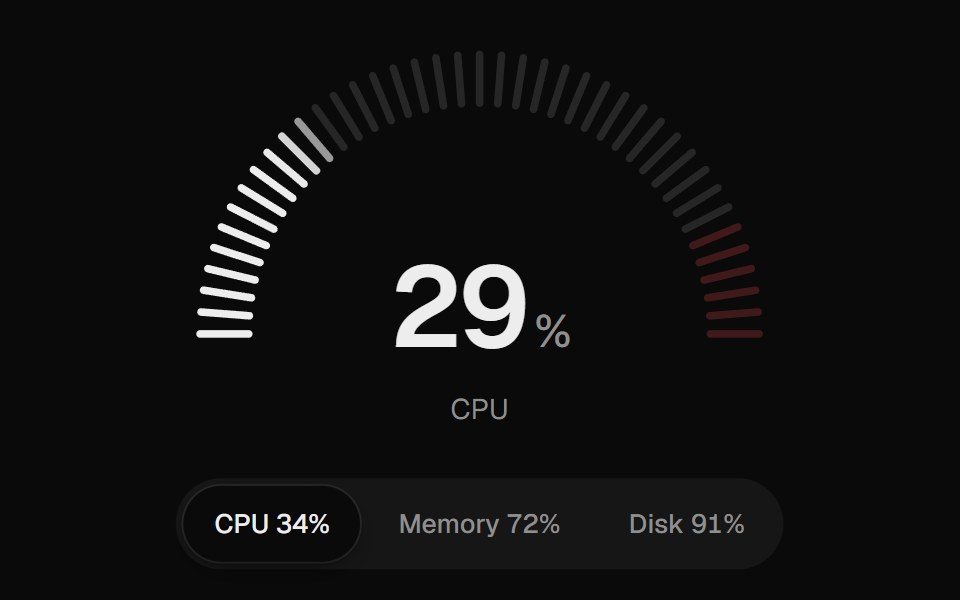 GaugeUI Lab · ReactTicks light up as the value sweeps in, and a peak marker holds where it was before falling.
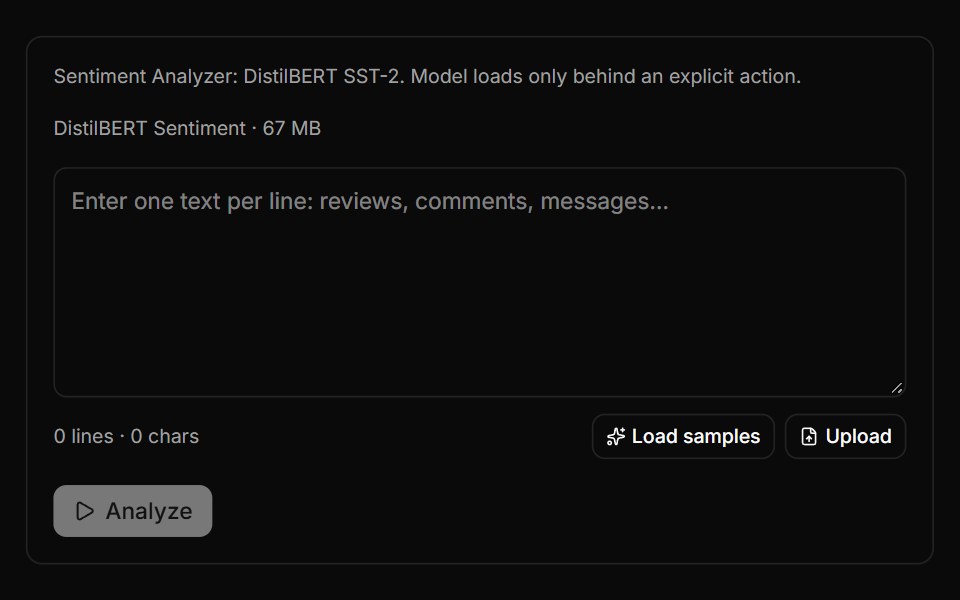 Sentiment Analyzer BlockLocalMode · ReactClassify one text or thousands with DistilBERT SST-2 (one item per line, or a .txt/.csv first column) via…
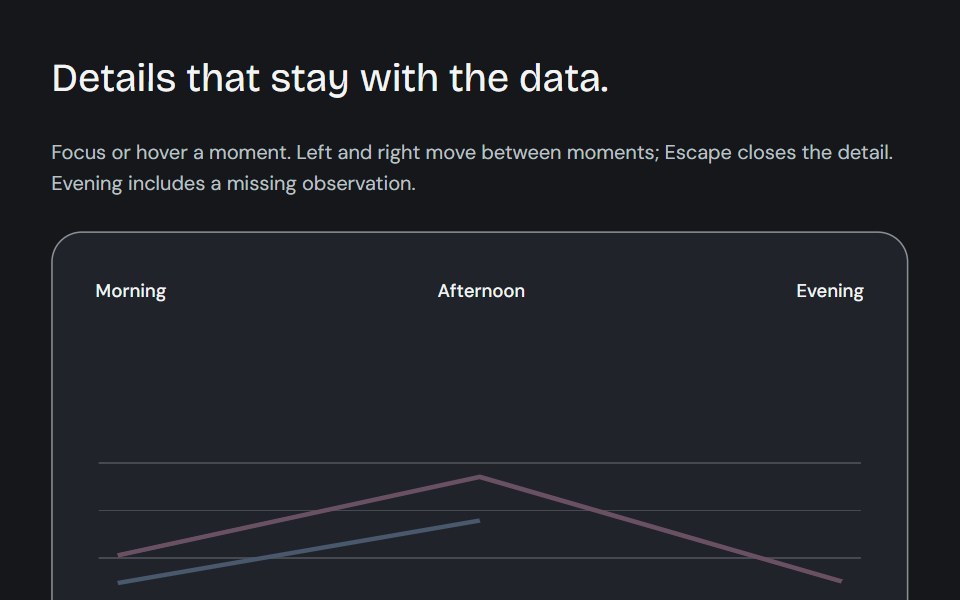 Dynamic chart tooltipCojeev UI · ReactCompare a point, read its known subtotal or rank its series. Values update in place and keep their series colours.
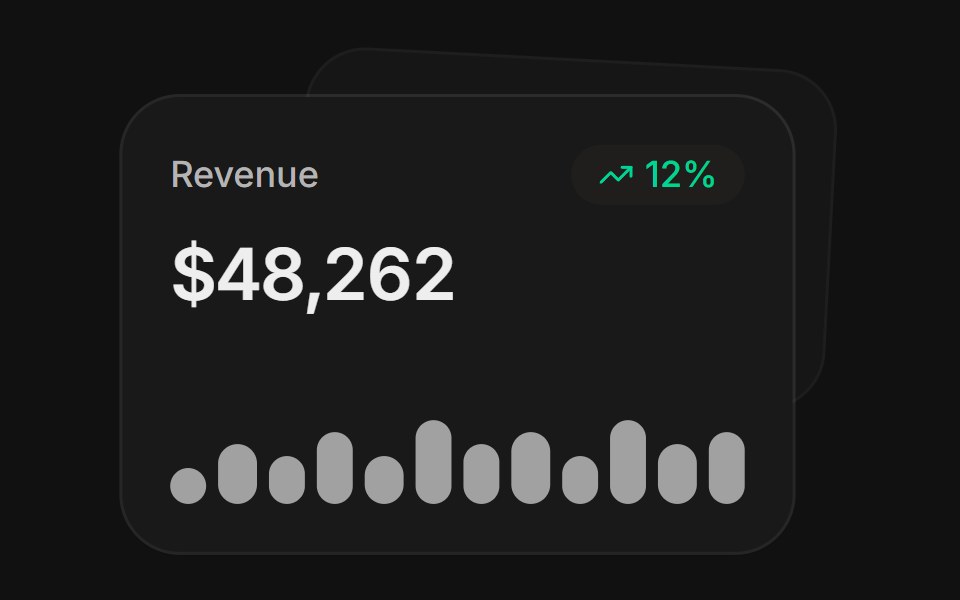 MetricsFLX UI · ReactA stat card with trend and sparkline, layered over a second.
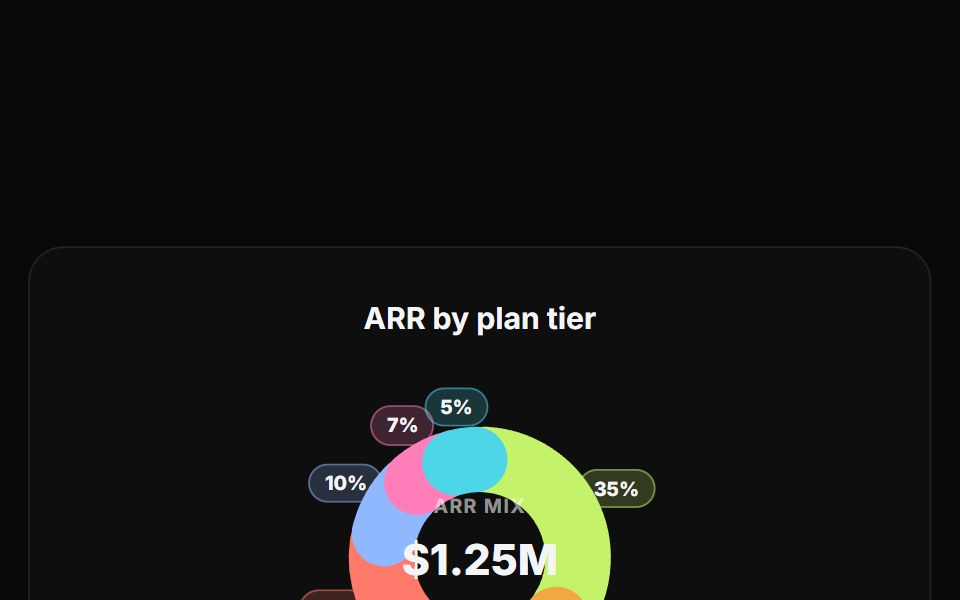 Pie ChartReactFrame · ReactA donut-style pie chart with a live center total, click-to-toggle legend, percentage callouts around the ring, and a…
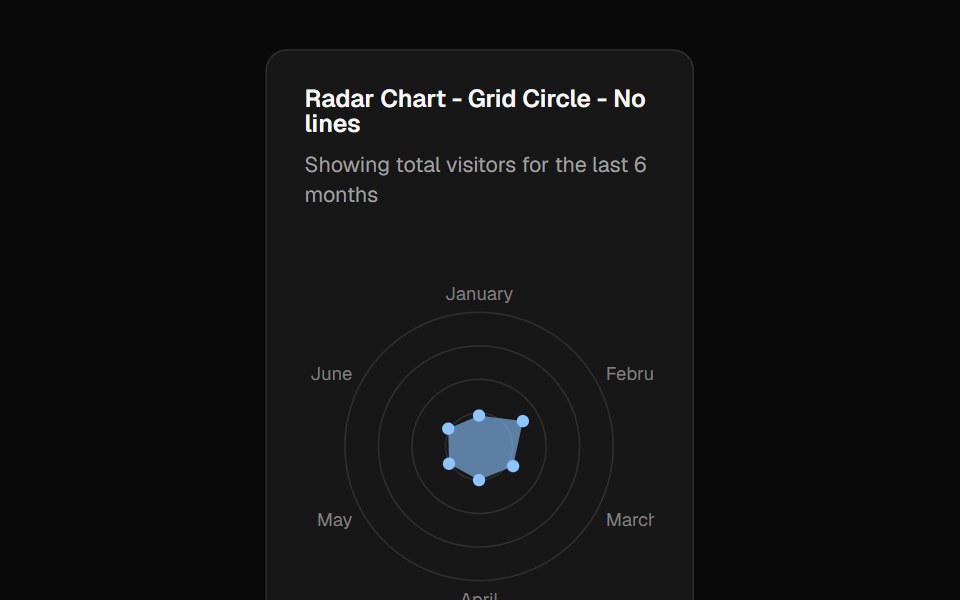 Chart Radar Grid Circle No Linesshadcn/ui · ReactRadar chart example with a circular polar grid and no radial lines.
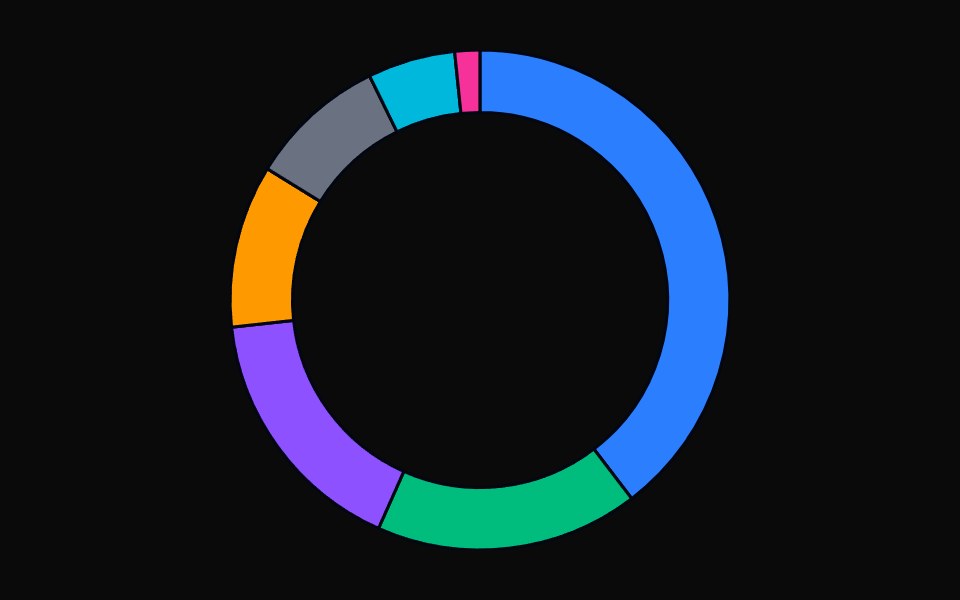 Donut ChartTremor · React
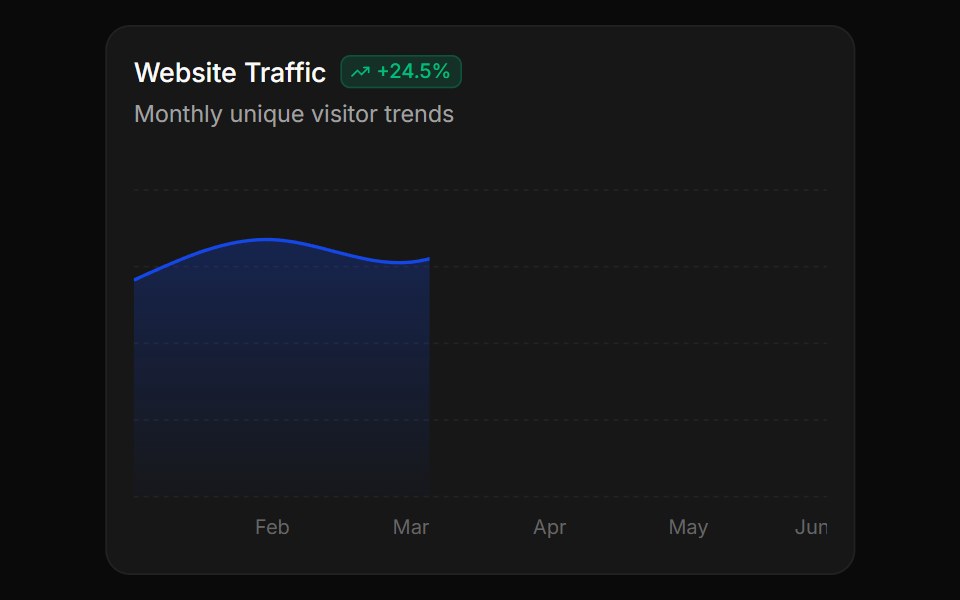 Gradient area chart with stripe overlayReUI · ReactGradient area chart with stripe overlay
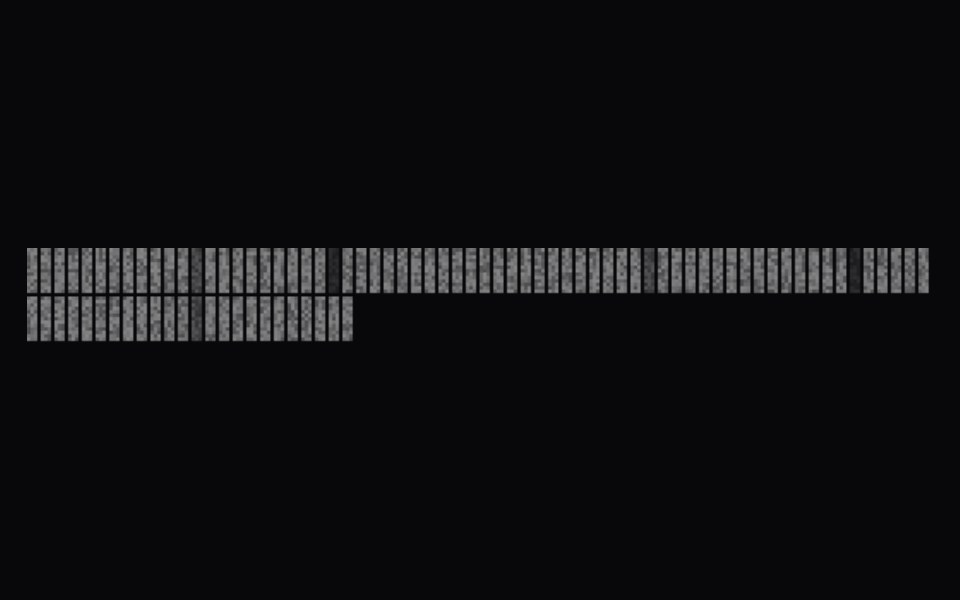 Uptime Dither Bar ChartAmicro Micro Transitions · ReactContinuous uptime bar chart with dithered matrix animation.
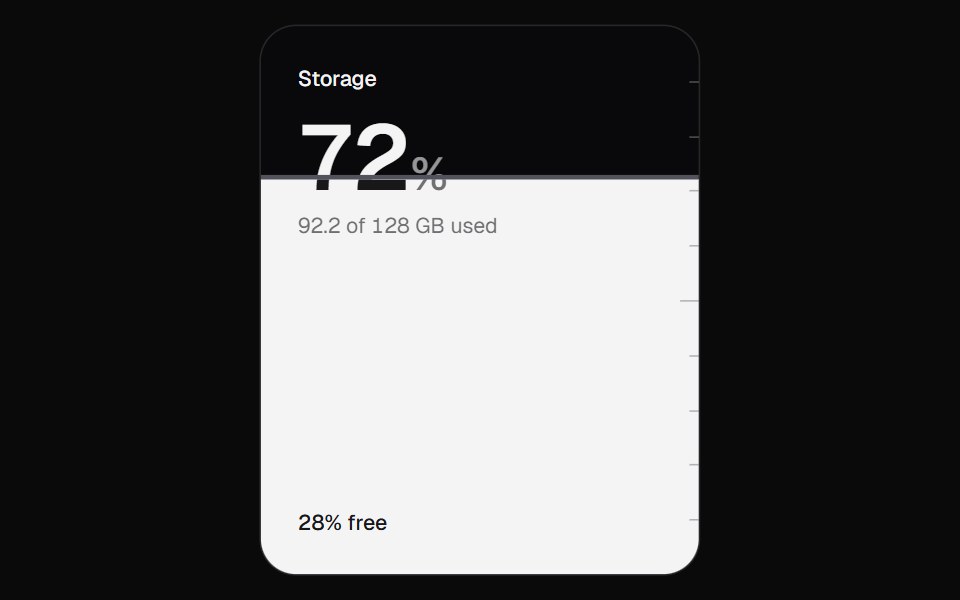 Liquid GaugeKokonut UI · ReactA usage meter filled with liquid that sloshes, ripples and bubbles, built with React and a wave simulation.
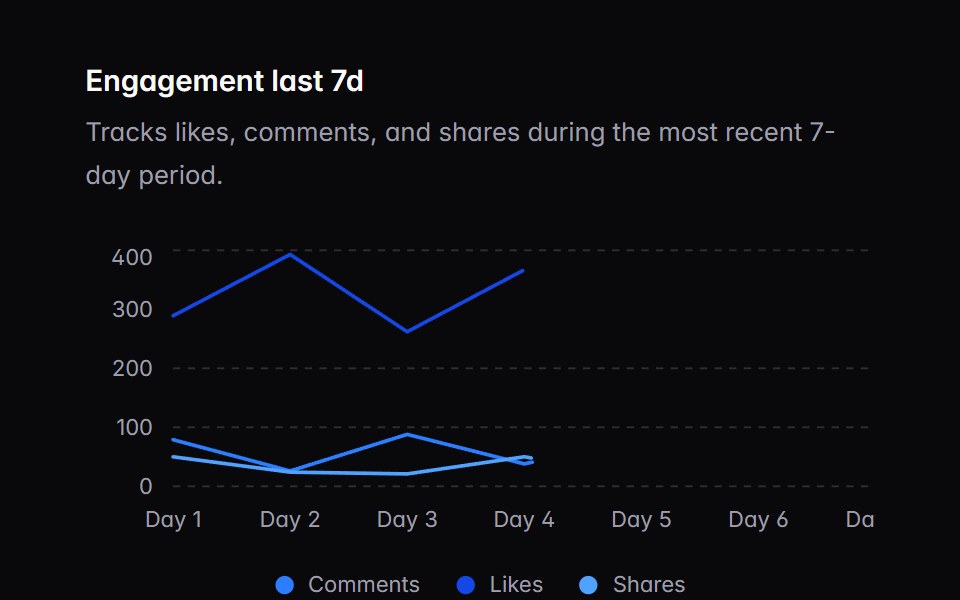 chart-02Intent UI · Reactchart-02
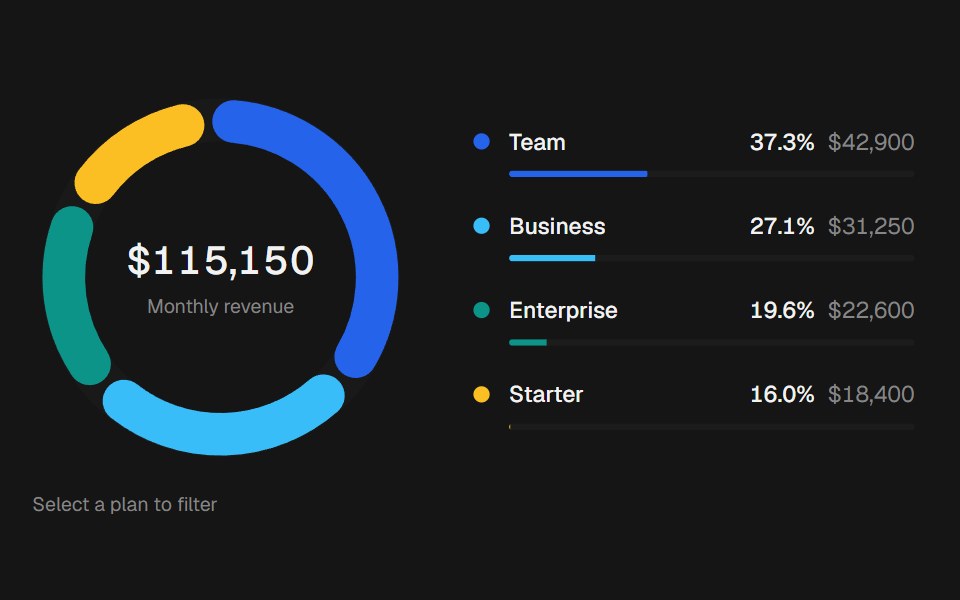 Donut ChartbeUI · ReactRounded share segments with a linked center readout and legend.
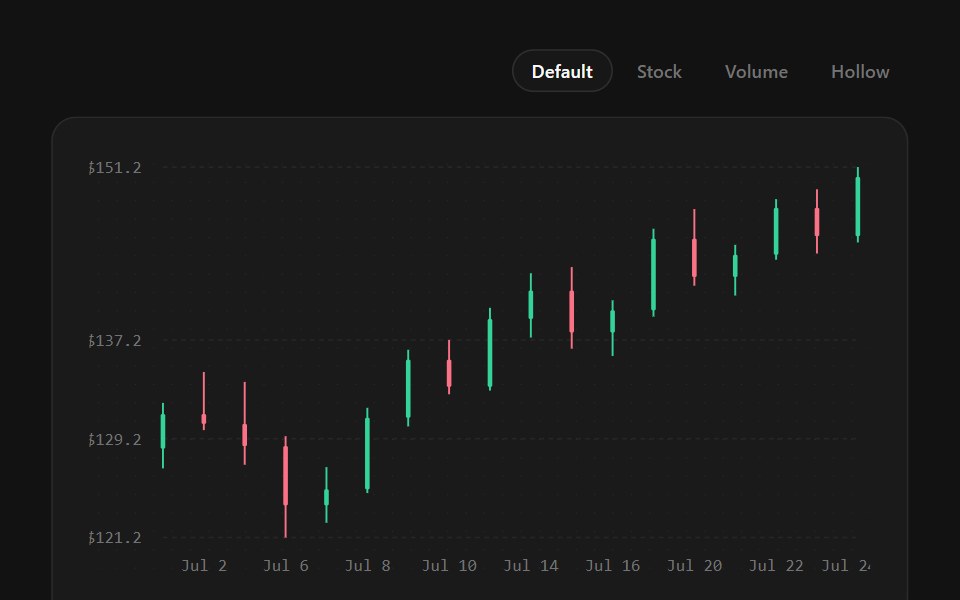 Candlestick ChartSpectrum UI · ReactOHLC candles with optional volume and hollow-up bodies — for stocks, SOL, and any market pair.
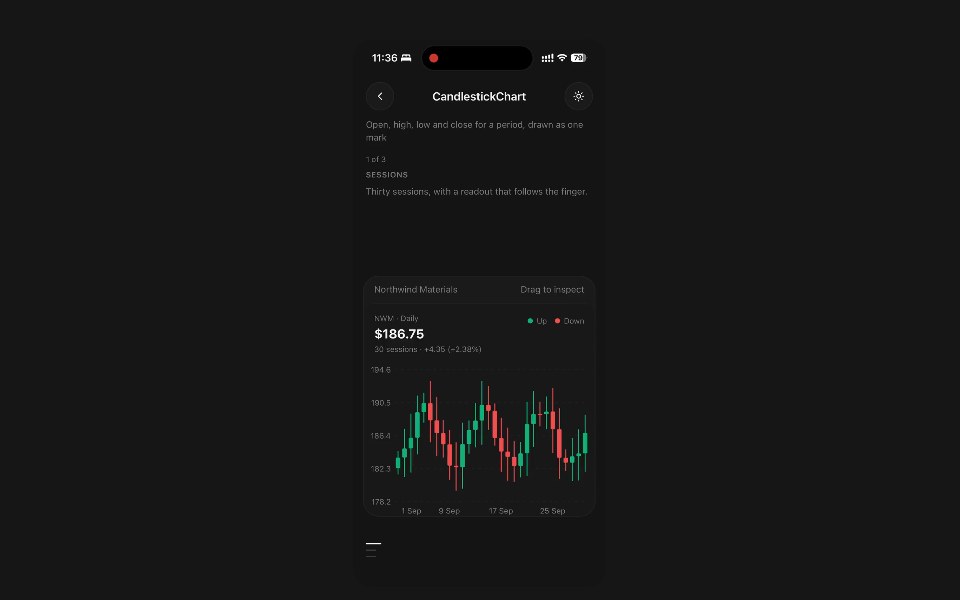 Candlestick ChartPanel UI · React NativeOpen, high, low and close for a period, drawn as one mark.
 Spinner 06 - BarsShadcn Space · ReactThree vertical bars with staggered grow animation.
 Combo ChartTremor Blocks · ReactThe base combined chart (Recharts): bars and lines in the same plot, optionally with two Y axes.
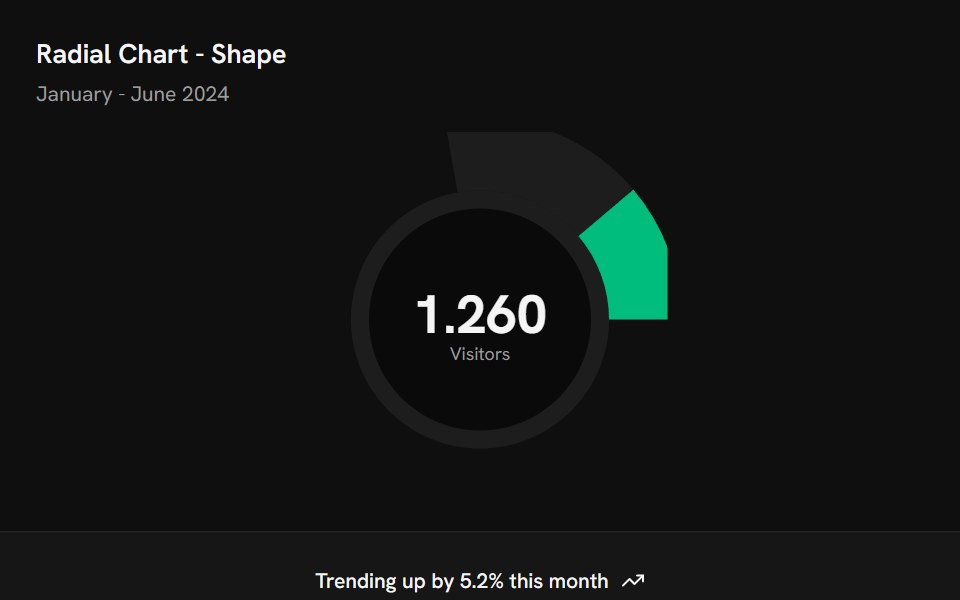 Chart Radial ShapeShark UI · ReactRadial chart example where the single bar has rounded ends and a large number in the centre.
Libraries with Tailwind CSS chart components
Related categories
- Chart Components
- React Chart Components
- Animated Chart Components
- shadcn/ui Chart Components
- Tailwind CSS Data Display Components
- Tailwind CSS Card Components
- Tailwind CSS Table Components
- Tailwind CSS Avatar Components
- Tailwind CSS Stat Components
- Tailwind CSS List Components
- Tailwind CSS Calendar Components
- Tailwind CSS Accordion Components
- Tailwind CSS Data Table Components
- Tailwind CSS Carousel Components
- Tailwind CSS Collapsible Components
- Tailwind CSS Avatar Group Components
- Tailwind CSS Stat Card Components
- Tailwind CSS Bar Chart Components
- Tailwind CSS Tree View Components
- Tailwind CSS Card Stack Components