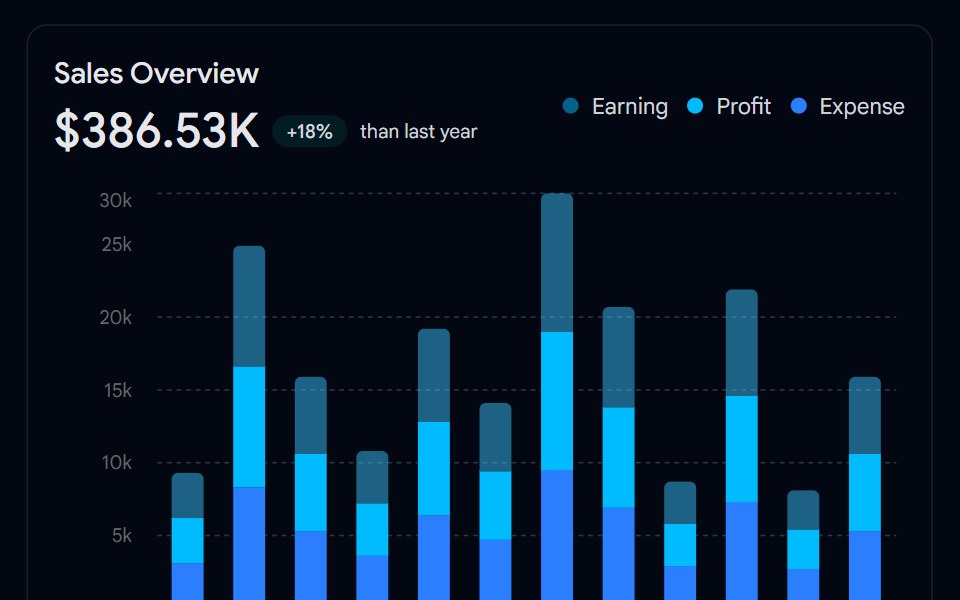
Chart 01 - Sales Performance Bar Chart
An interactive stacked bar chart displaying monthly earnings, profit, and expenses, ideal for admin dashboards to visualize financial trends, track growth, and support data-driven business decisions.
- Library
- Shadcn Space
- Framework
- React
- Type
- block
- License
- MIT
- Dependencies
- recharts
- Files
src/components/shadcn-space/blocks/chart-01/page.tsxsrc/components/shadcn-space/blocks/chart-01/chart.tsxsrc/components/ui/card.tsxsrc/components/ui/chart.tsxsrc/components/ui/badge.tsxsrc/lib/utils.tssrc/config.ts
- Source
- https://github.com/shadcnspace/shadcnspace
Categories
- Bar Chart Components
- Tailwind CSS Bar Chart Components
- Animated Bar Chart Components
- Chart Components
- React Chart Components
- Tailwind CSS Chart Components
- Animated Chart Components
- shadcn/ui Chart Components
- Data Display Components
- React Data Display Components
- Tailwind CSS Data Display Components
- Animated Data Display Components
More from Shadcn Space
- Chart 02 - Earnings Pie Chart
- Chart 03 - Yearly Sales Comparison
- Chart 04 - Weekly Sales
- Spinner 06 - Bars
- Toggle Group 06 - Chart Time Range
- About Us 01 - Impact Metrics
- Accordion-01 - Default
- Accordion-02 - Multi-level
- Accordion-03 - Numbered FAQ
- Accordion-04 - Card
- Accordion-05 - Media
- Accordion-06 - Filled Trigger