 Dev Design Library
Heatmap Chart Components
Dev Design Library indexes 21 heatmap chart components from 12 open-source UI libraries, with the most coming from Spectrum UI, beUI, Amicro Micro Transitions, OpenSourceUI and Panel UI. Each one links to its page with the source code, a live preview where available, the library license and the install command. Heatmap chart components belong to the Data display group.
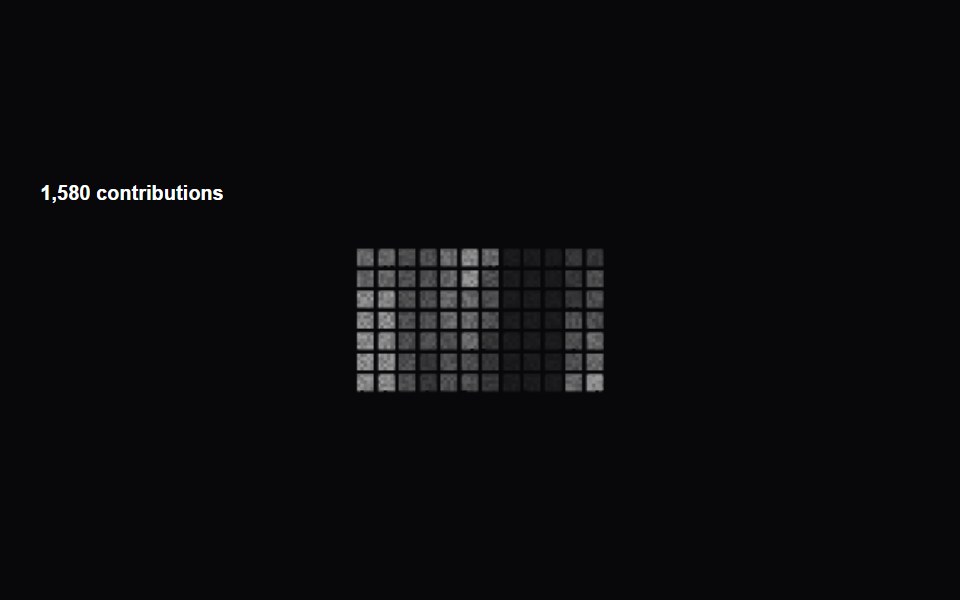 Activity Dither HeatmapAmicro Micro Transitions · ReactGitHub-style activity heatmap with interactive dither dots.
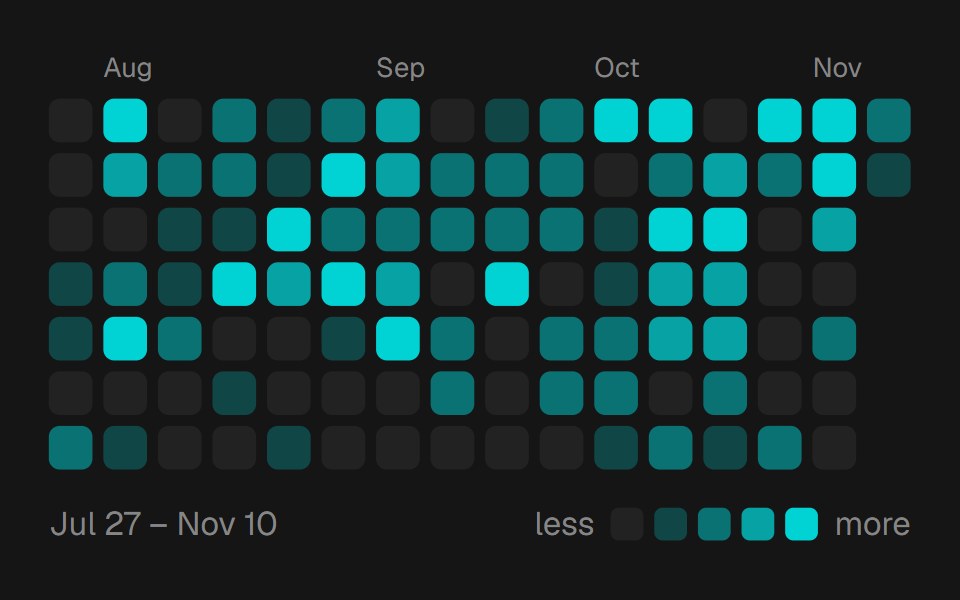 Heat CalendarbeUI · ReactCompose Grid, Tooltip and Legend, or omit children for the complete chart.
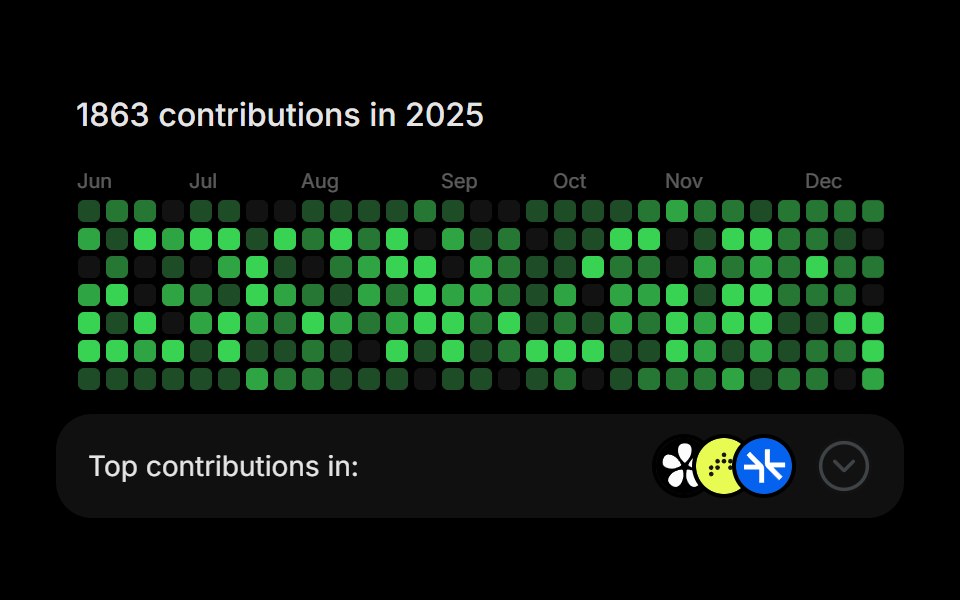 GitHub ActivityRare UI · ReactA contribution heatmap with a footer panel that expands over the grid to rank your top repositories.
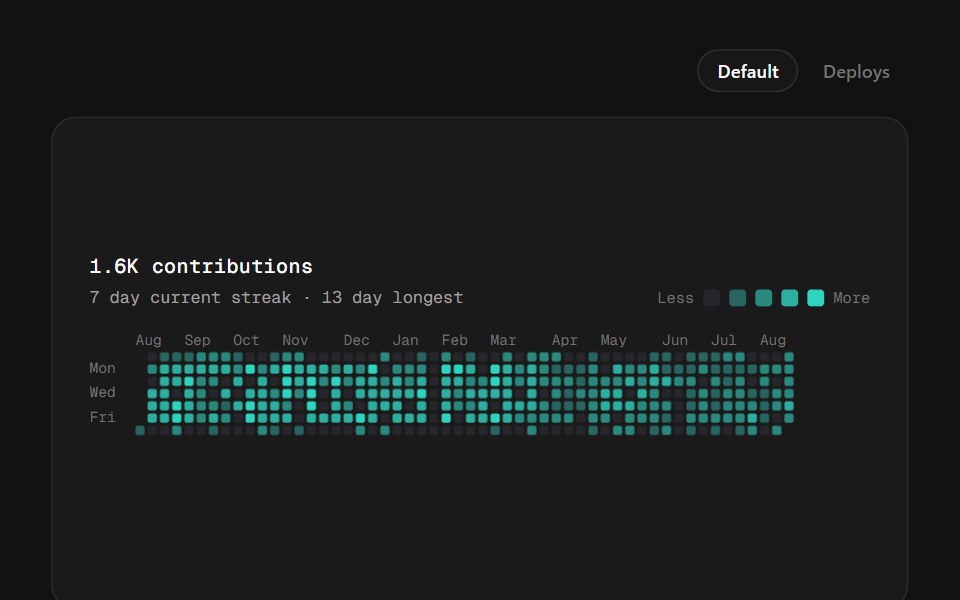 Calendar HeatmapSpectrum UI · ReactA year of daily values as week columns — the contributions grid, with five quantised intensity steps, streak stats…
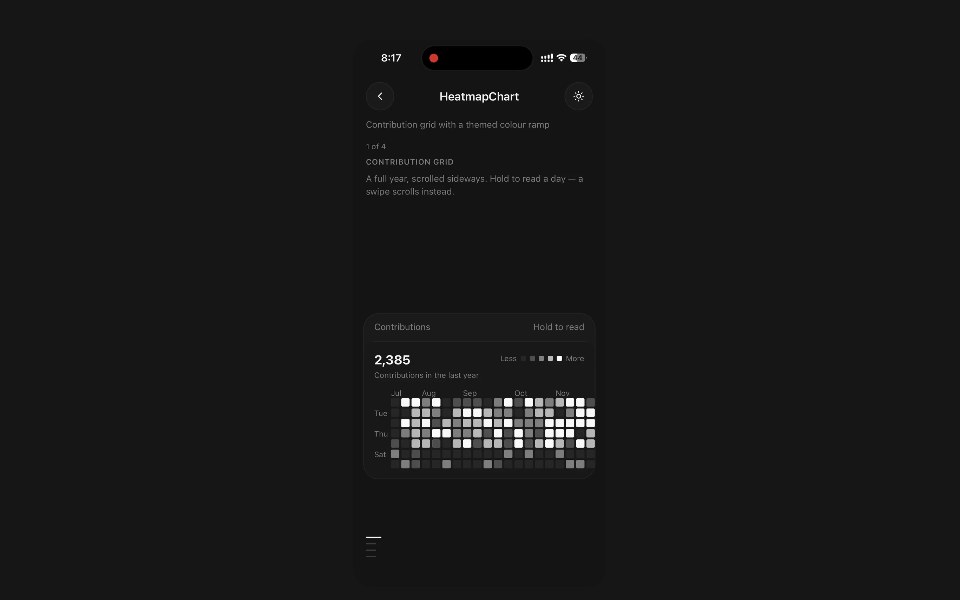 Heatmap ChartPanel UI · React NativeContribution grid with a themed colour ramp and a readout.
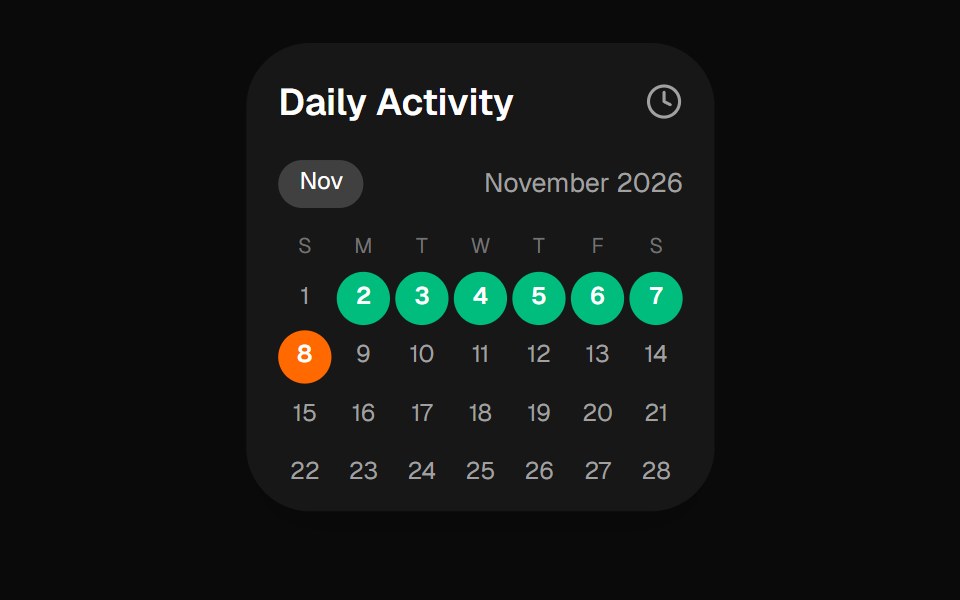 Daily Activity Calendar WidgetOpenSourceUI · React
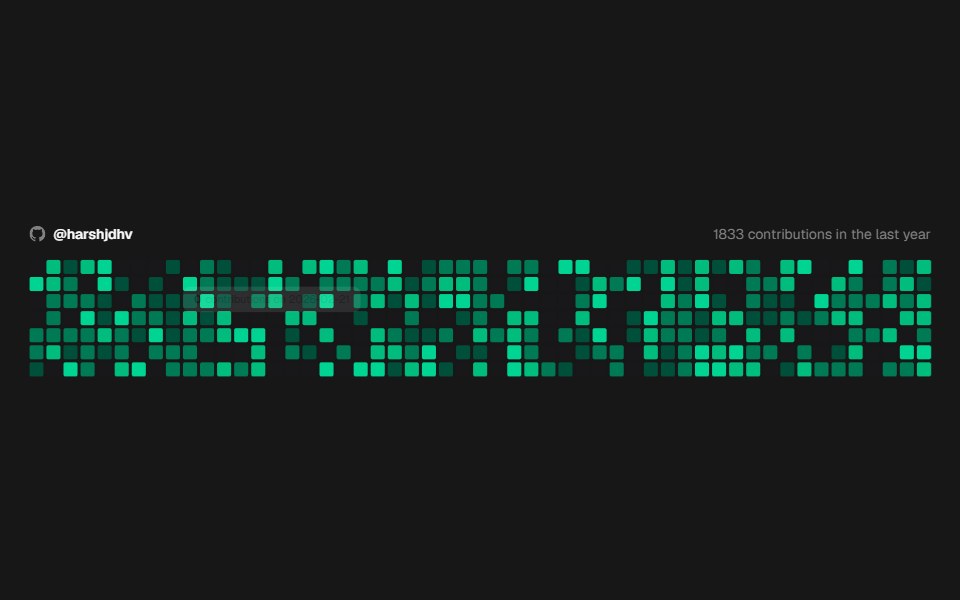 Github CalendarComponentry · ReactGitHub-style contribution calendar heatmap.
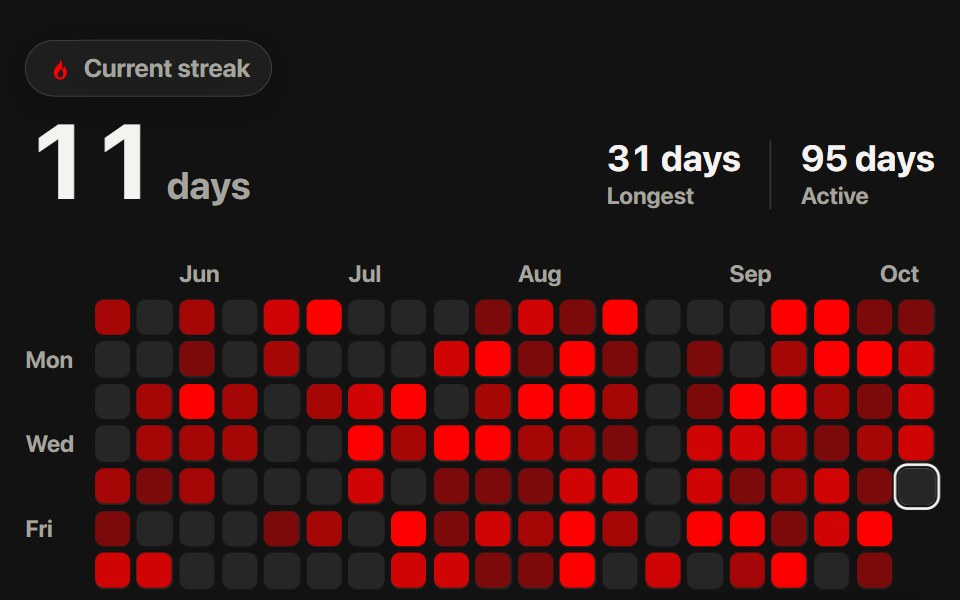 Activity HeatmapSwiftPieces · SwiftUIA streak calendar in steps of red with a glass streak chip, and a scrub that lifts each day with a callout and a…
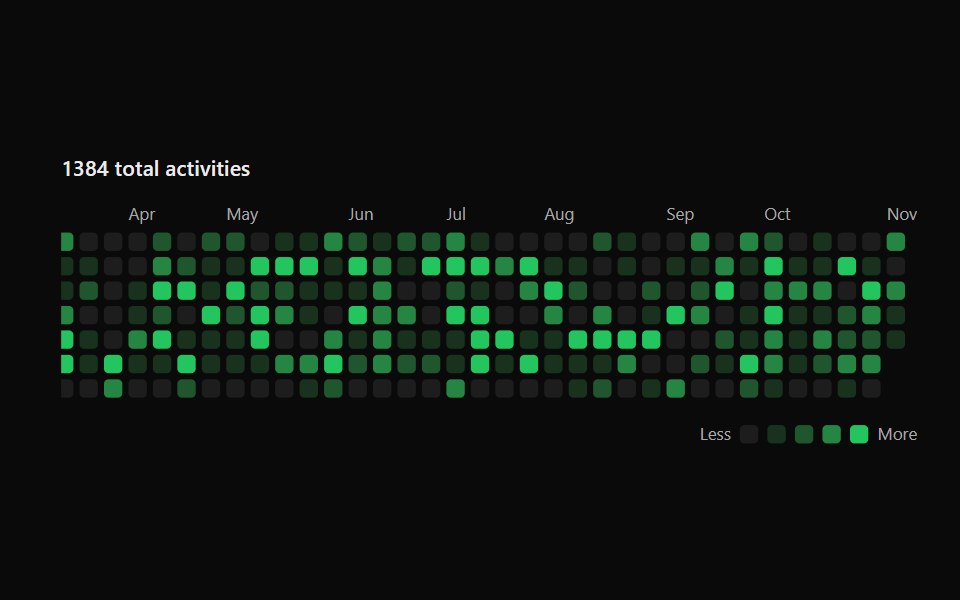 Activity GraphSona UI · ReactA keyboard-accessible calendar heatmap with normalized intensity levels and an interruptible shared focus surface.
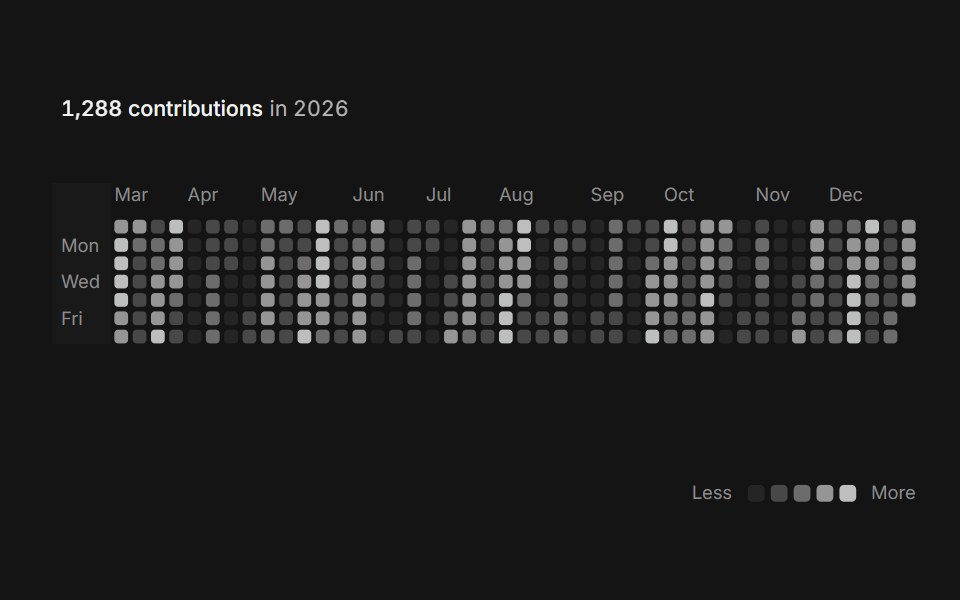 Activity heatmapArc Library · ReactSee a year of activity at a glance, one square per day.
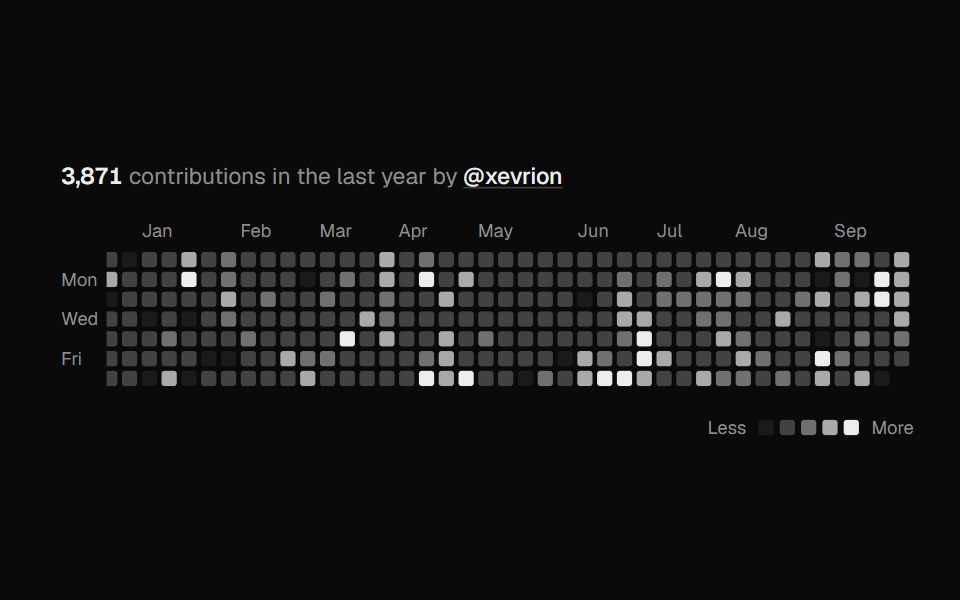 Contribution HeatmapUI Lab · ReactA year of activity at a glance, sweeping in week by week.
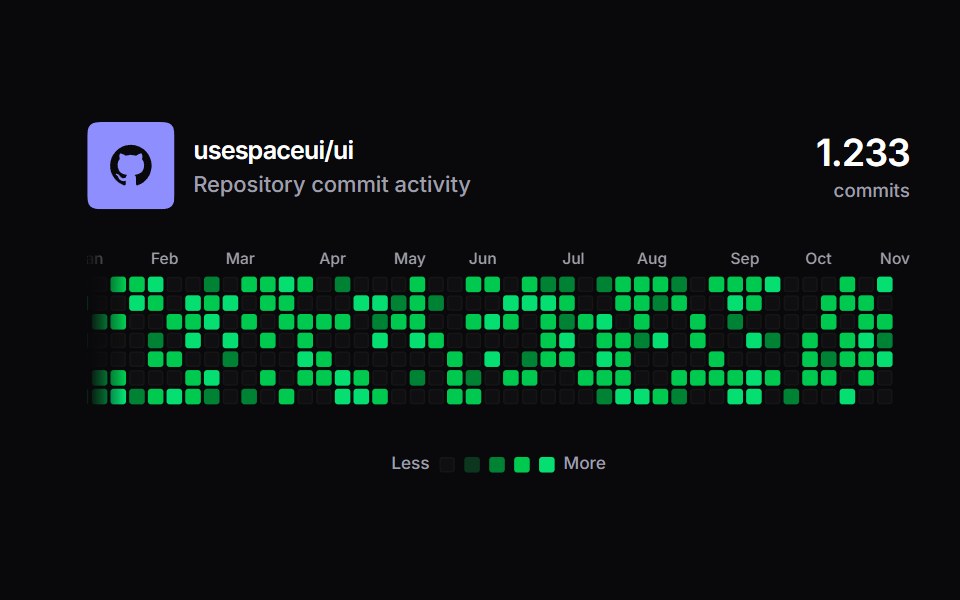 Github ActivitySpaceUI · ReactAn interactive GitHub ecosystem showcase featuring pure 52-week contribution heatmap matrix content with live fetch…
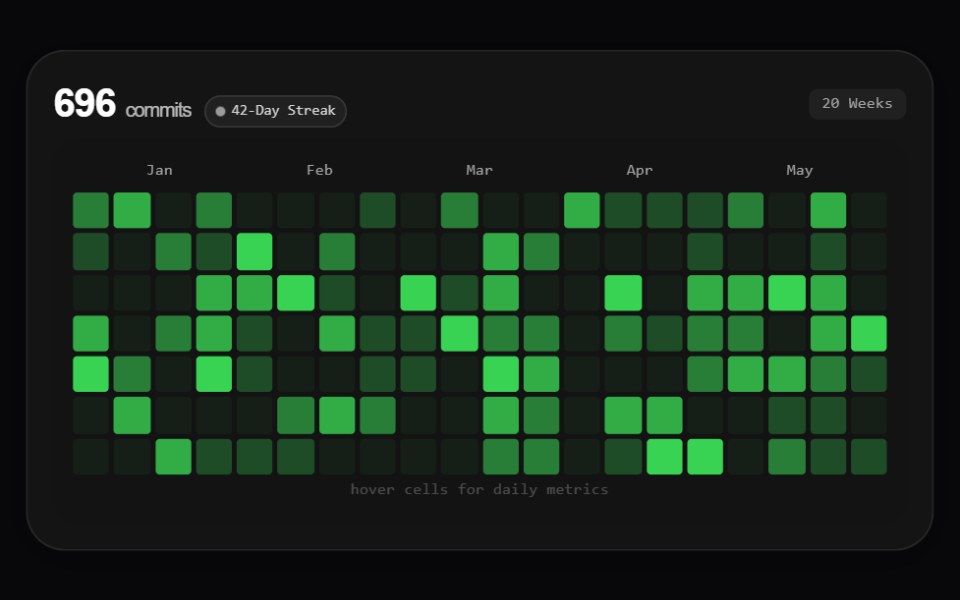 Mono Activity HeatmapAmicro Micro Transitions · React
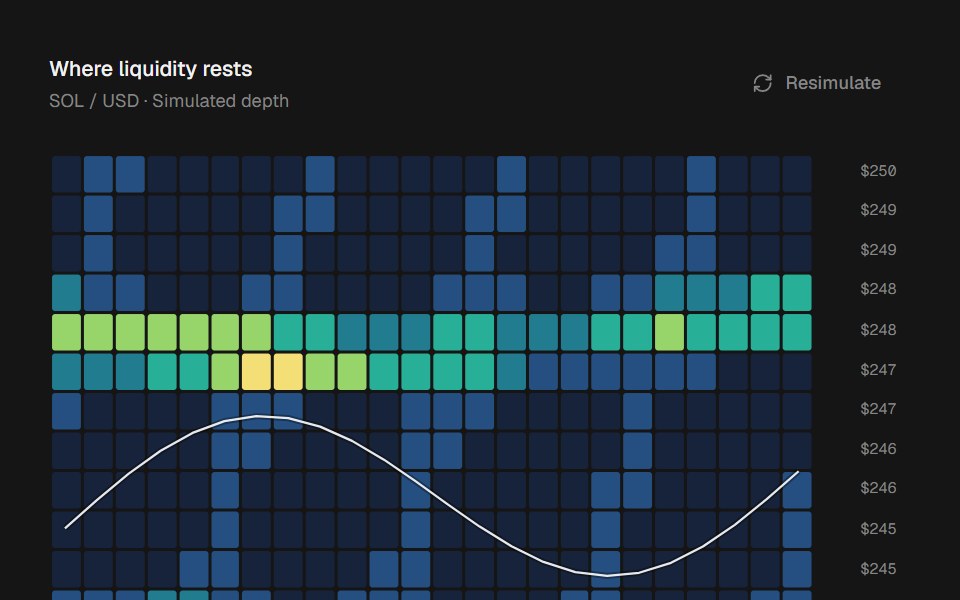 Liquidity HeatmapbeUI · ReactAnimated liquidity bands across price and time, with a price trace and depth tooltips.
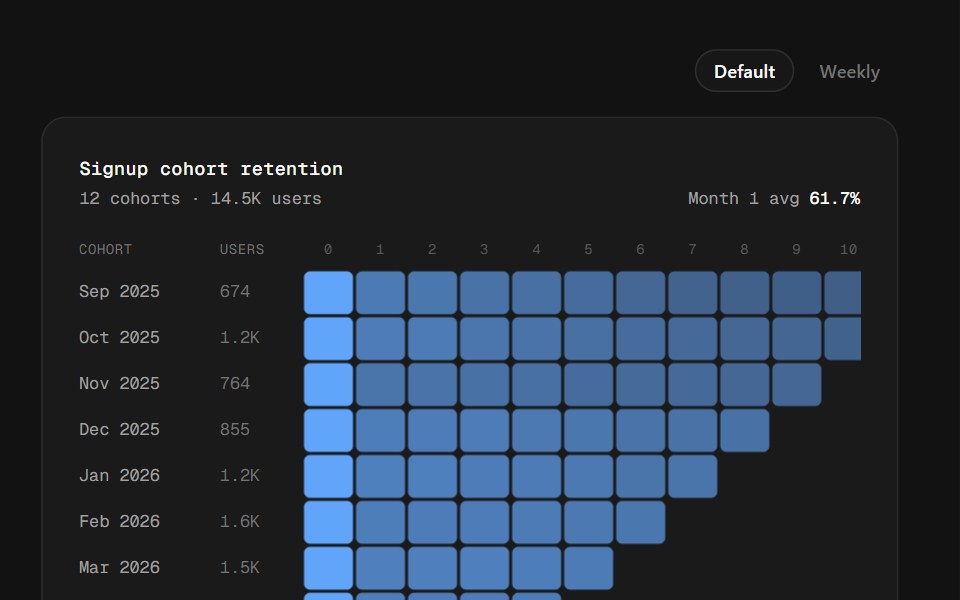 Cohort RetentionSpectrum UI · ReactThe retention triangle: cohorts down, periods across, intensity by share retained, with a row and column crosshair and…
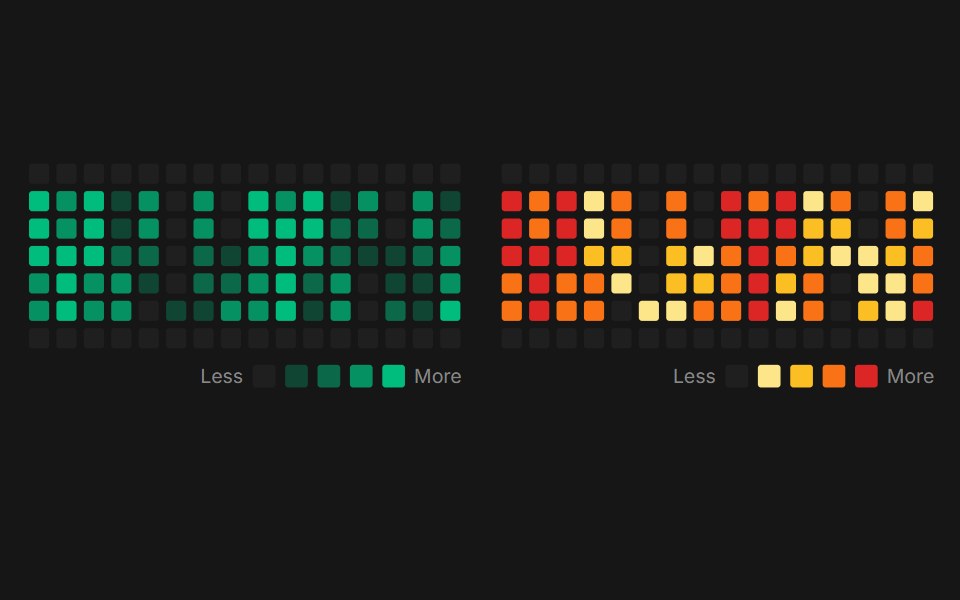 Web Heatmap ChartPanel UI · React NativeA calendar heatmap for a year of activity such as commits, deploys or spending.
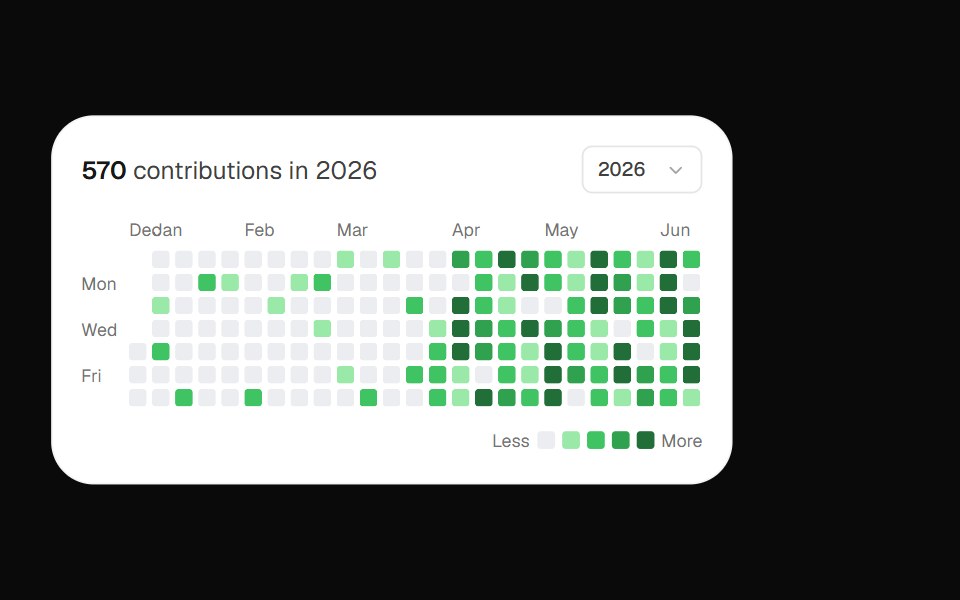 Github ContributionOpenSourceUI · React
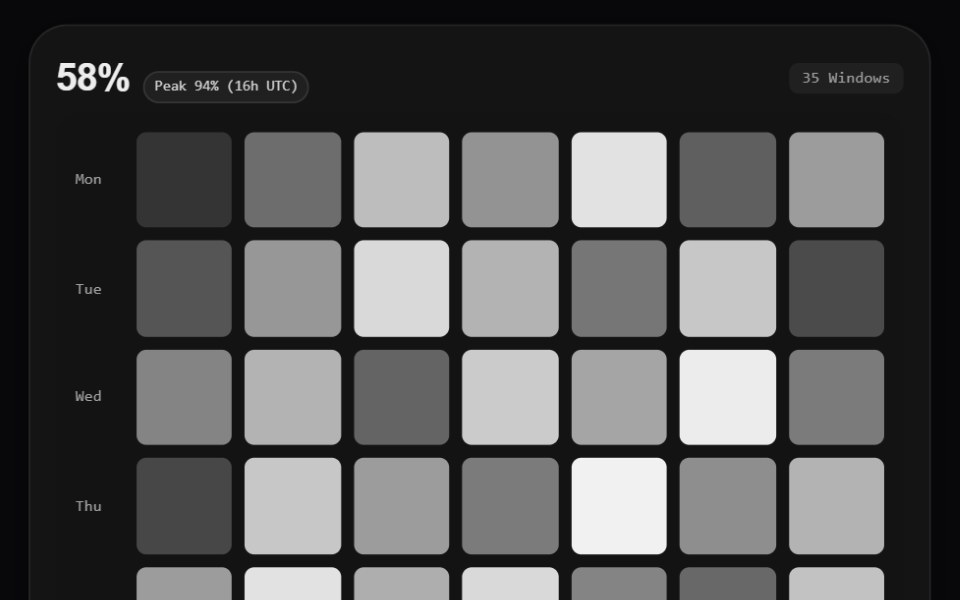 Mono Rounded Heatmap ChartAmicro Micro Transitions · React
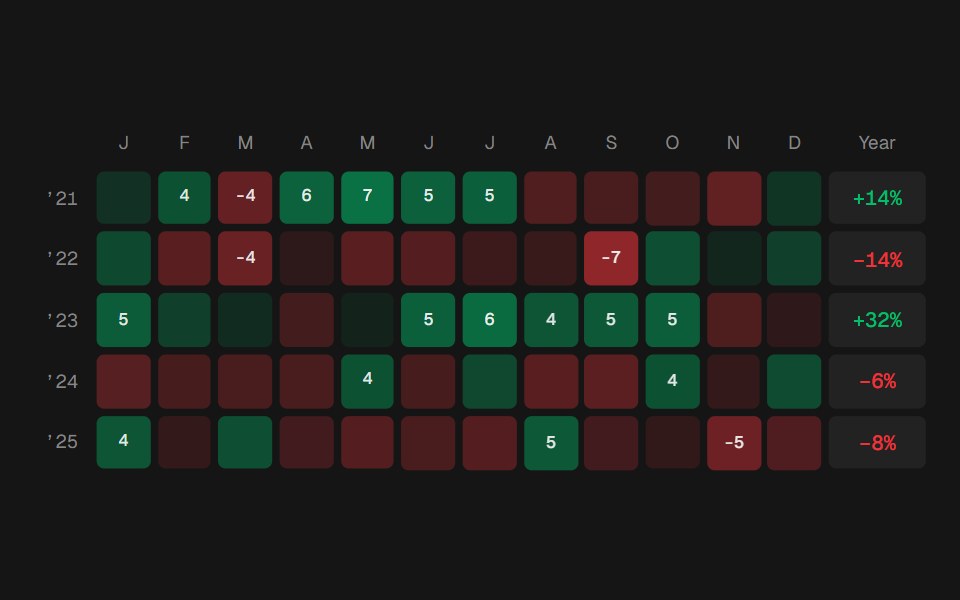 Returns CalendarbeUI · ReactCompose Grid and Tooltip, or omit children for the complete chart.
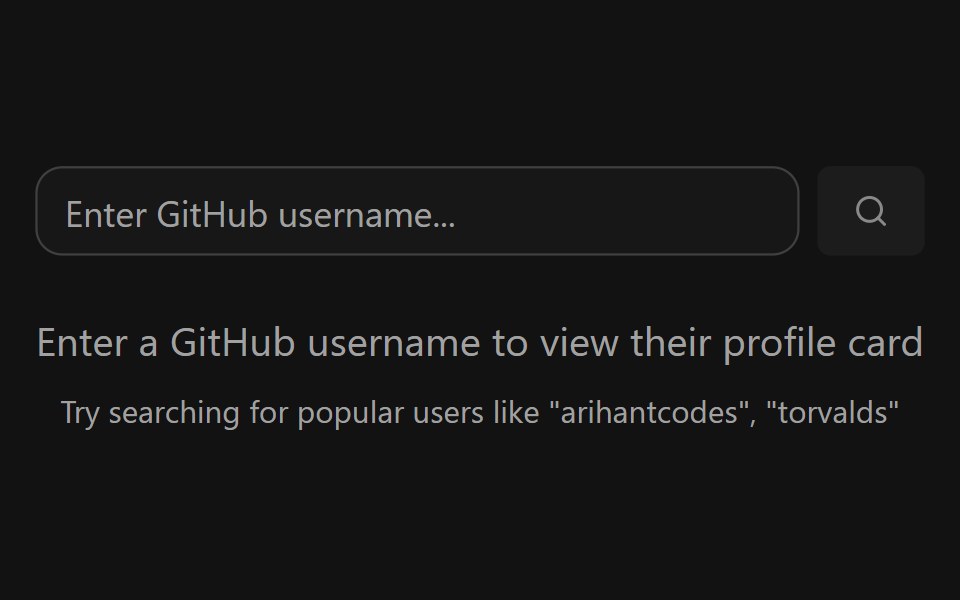 GitHub Profile CardSpectrum UI · ReactA GitHub profile card with account stats, a contribution graph, and social links.
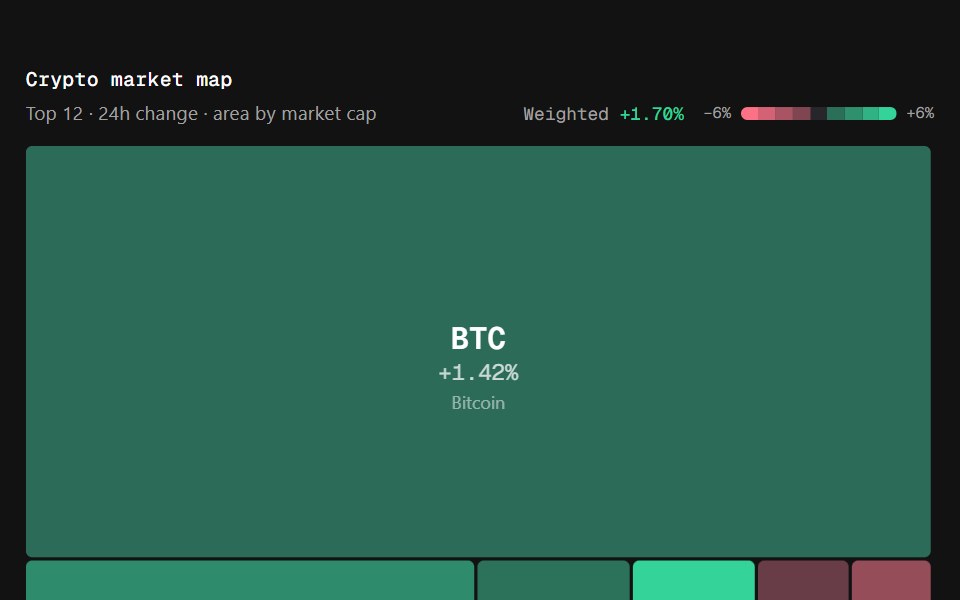 Market HeatmapSpectrum UI · ReactA squarified treemap sized by market cap and coloured on a diverging change ramp — the market map.
Libraries with heatmap chart components
Related categories
- React Heatmap Chart Components
- Tailwind CSS Heatmap Chart Components
- Animated Heatmap Chart Components
- Data Display Components
- Card Components
- Chart Components
- Table Components
- Avatar Components
- List Components
- Stat Components
- Calendar Components
- Accordion Components
- Data Table Components
- Carousel Components
- Collapsible Components
- Avatar Group Components
- Stat Card Components
- Bar Chart Components
- Tree View Components