 Dev Design Library
React Native Data Display Components
Dev Design Library indexes 71 React Native data display components from 2 open-source UI libraries, with the most coming from Panel UI and ZAYX. Each one links to its page with the source code, a live preview where available, the library license and the install command. Every library in this list targets React Native.
 AccordionPanel UI · React NativeCollapsible sections with single or multiple selection.
 Crypto SwitchZAYX · React NativeA crypto swap card: pick the coin you pay and the one you receive, flip them with a spring, and send.
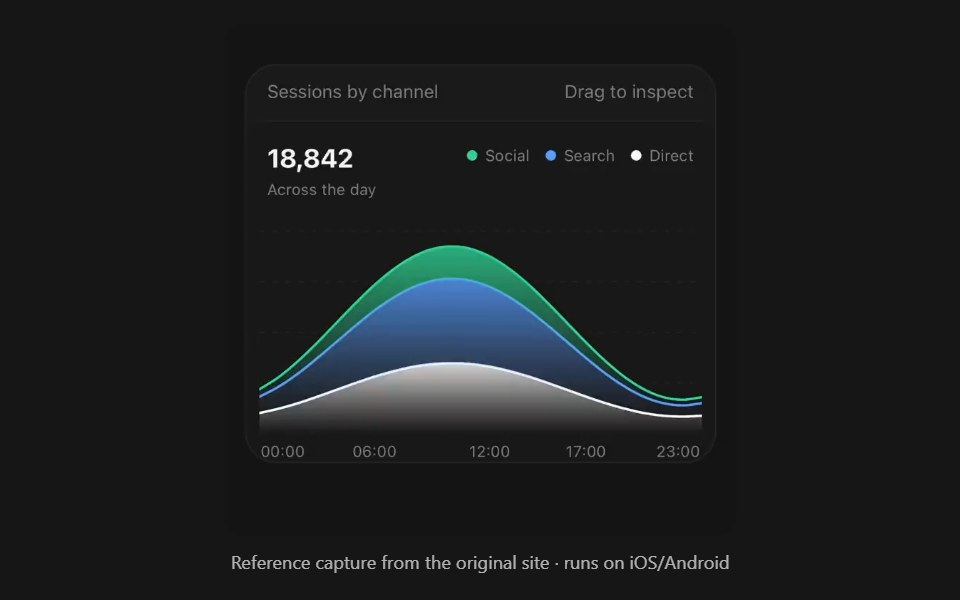 Area ChartPanel UI · React NativeFilled bands over time, stacked or overlaid.
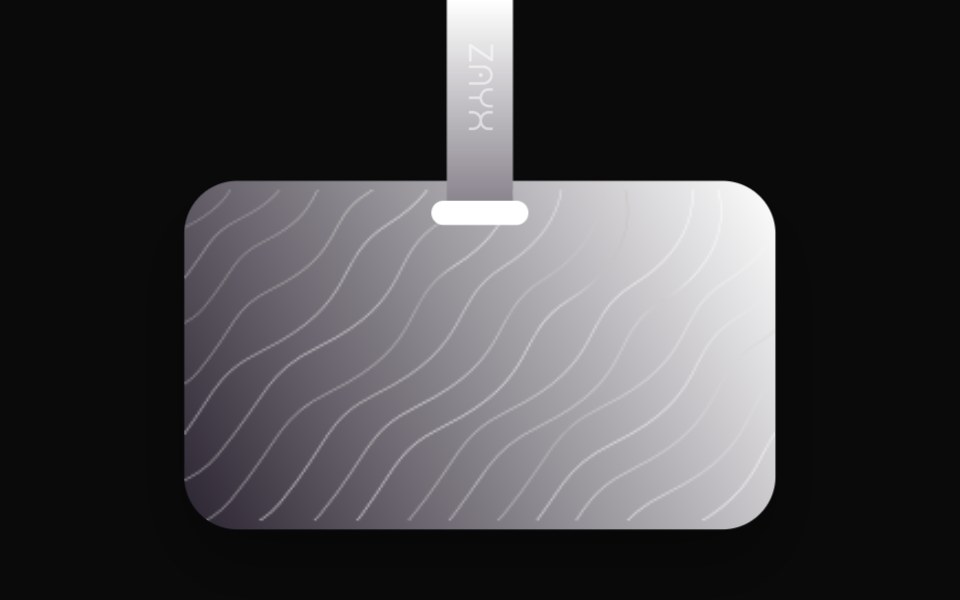 Id CardZAYX · React NativeAn identity card with a portrait and a Lottie animation, sized for mobile screens.
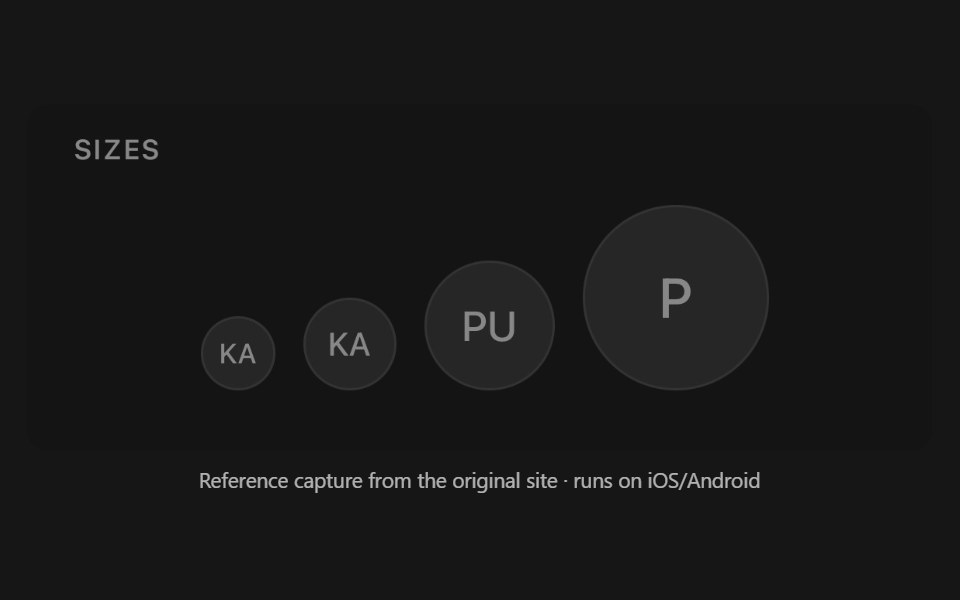 AvatarPanel UI · React NativeUser image with an initials fallback, a badge overlay, and a stack for a group of them.
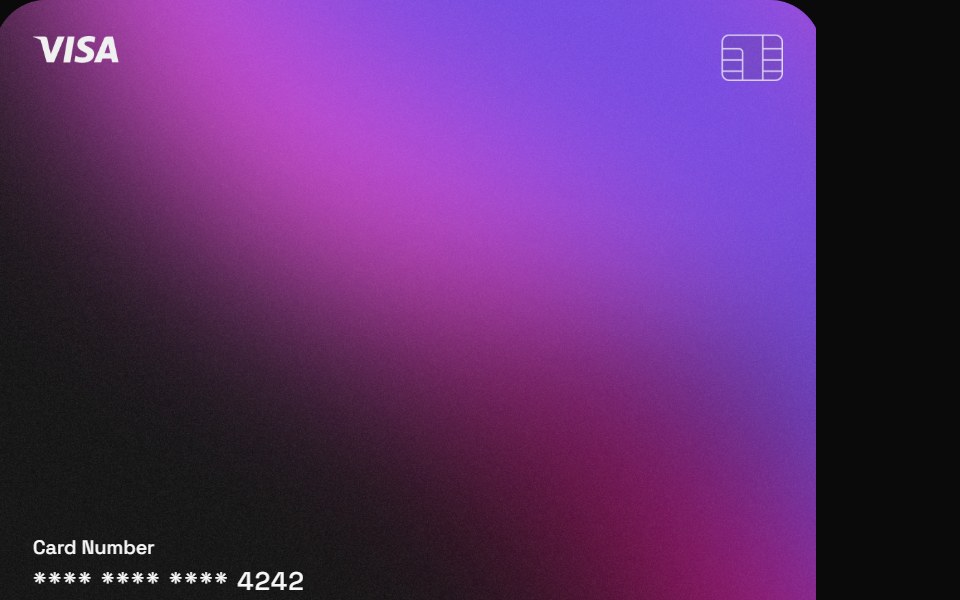 Card InsightZAYX · React Native
 Avatar CropperPanel UI · React NativeFrame a photo under a circle, and get that circle back as an image.
 Fin PanelZAYX · React Native
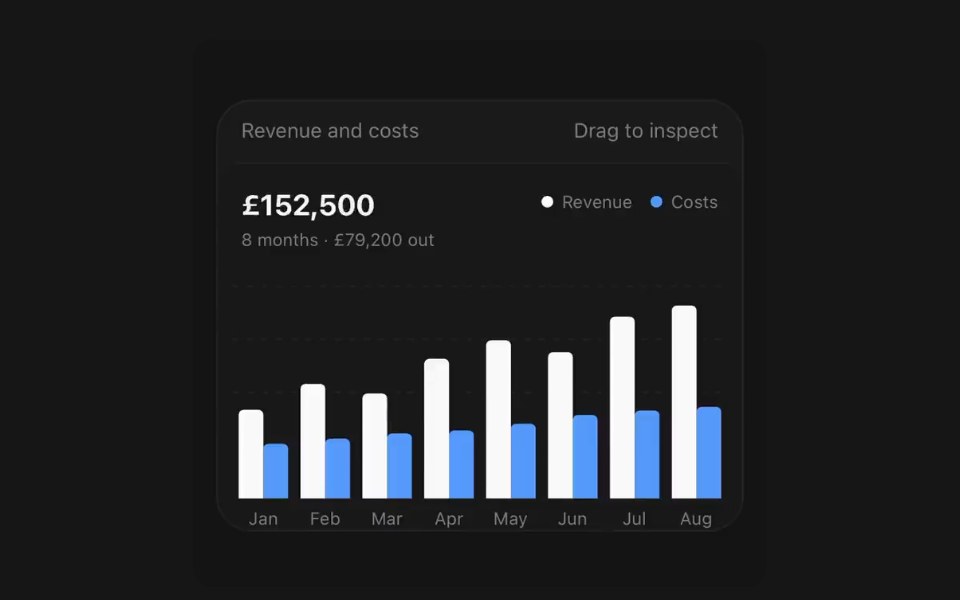 Bar ChartPanel UI · React NativeCategories compared by length, grouped or stacked.
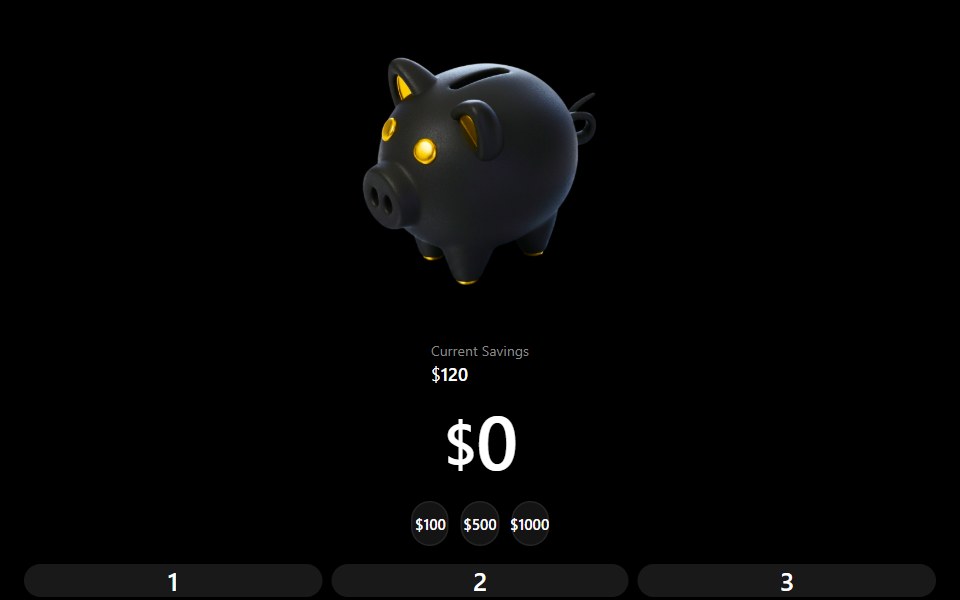 Piggy BankZAYX · React Native
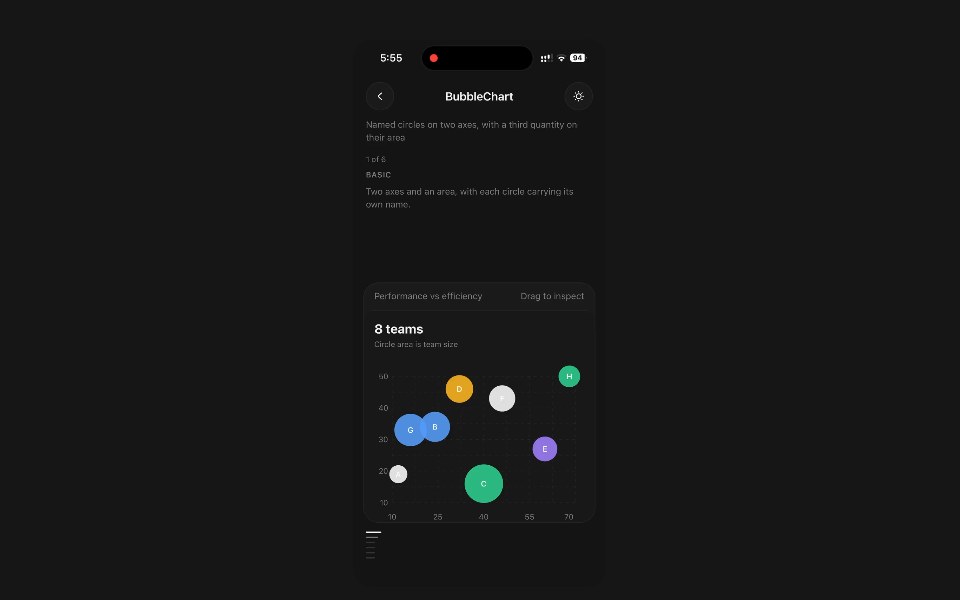 Bubble ChartPanel UI · React NativeNamed circles on two axes, with a third quantity on their area.
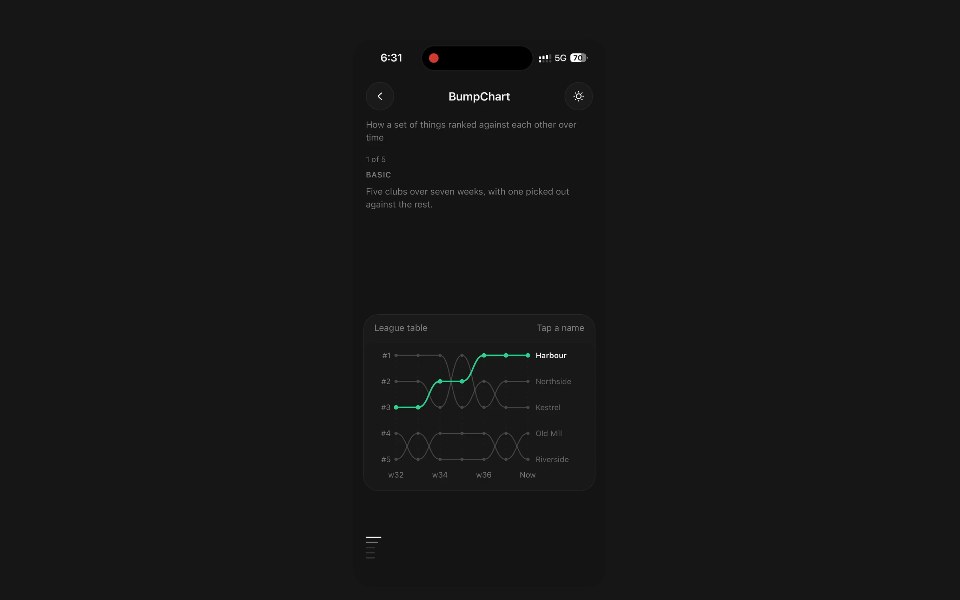 Bump ChartPanel UI · React NativeHow a set of things ranked against each other over time.
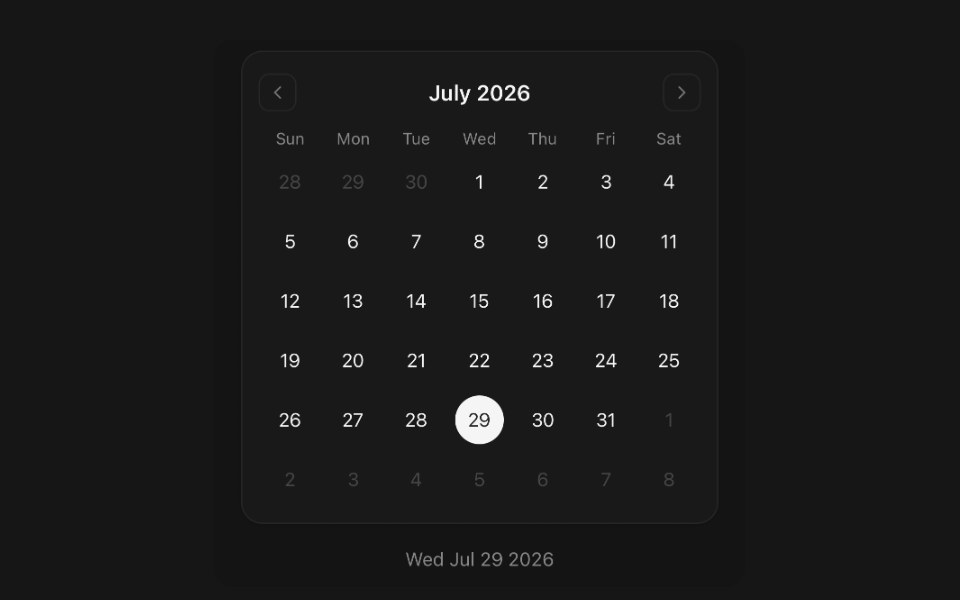 CalendarPanel UI · React NativeA month of days, for picking one, several, or a range.
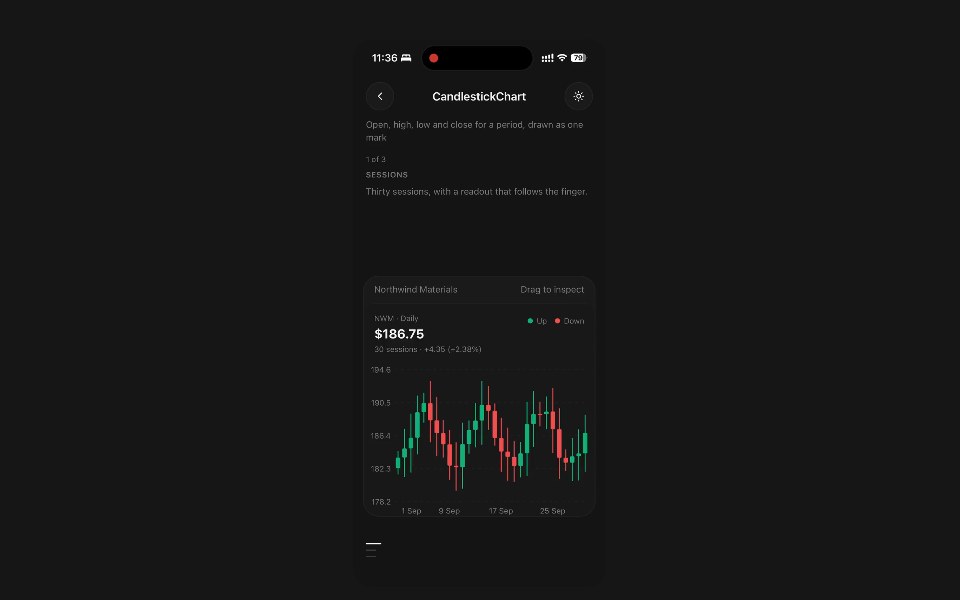 Candlestick ChartPanel UI · React NativeOpen, high, low and close for a period, drawn as one mark.
 CardPanel UI · React NativeContent surface with header, body and footer.
 CarouselPanel UI · React NativeA run of slides, one at a time, dragged with a finger.
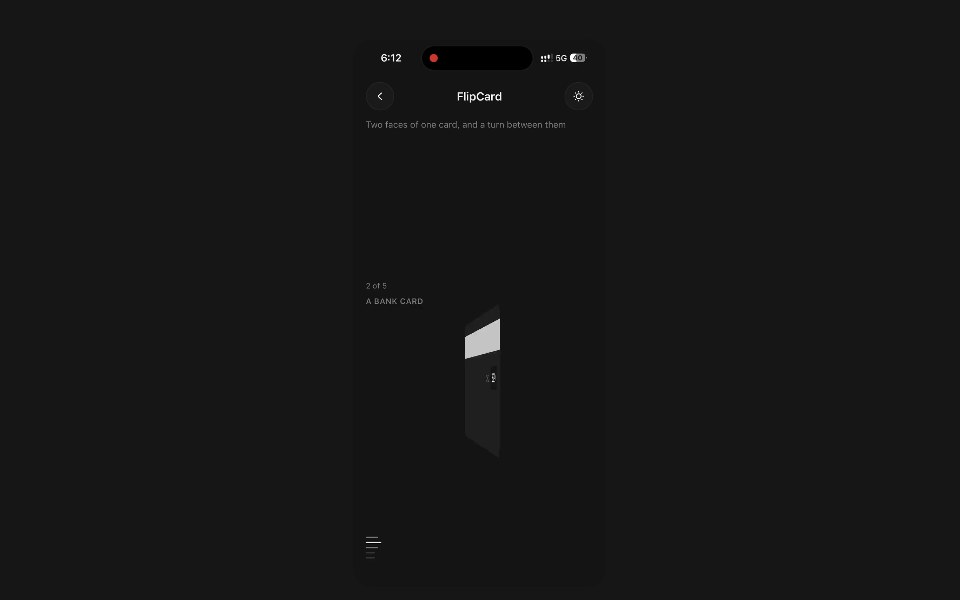 Flip CardPanel UI · React NativeTwo faces of one card, and a turn between them.
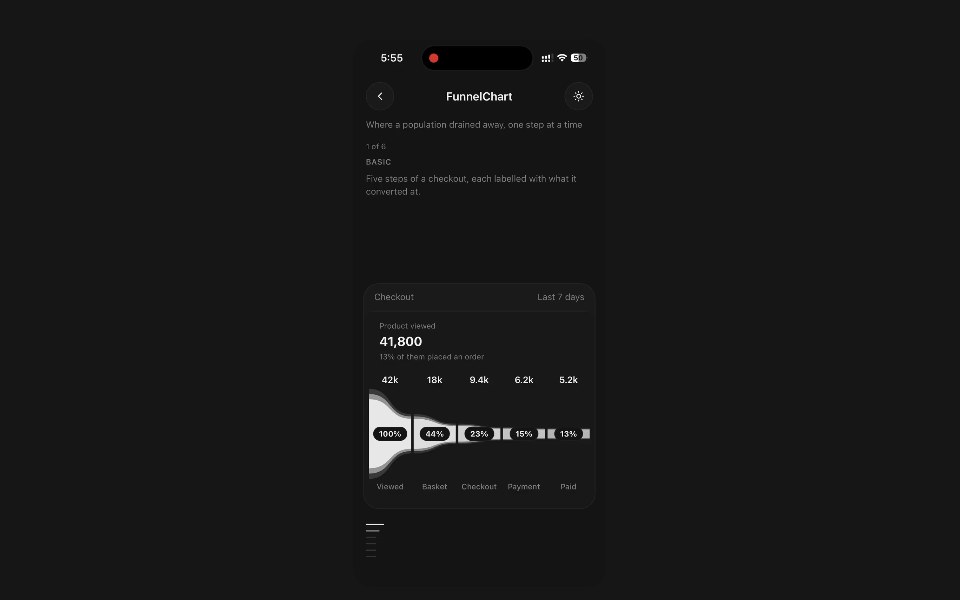 Funnel ChartPanel UI · React NativeWhere a population drained away, one step at a time.
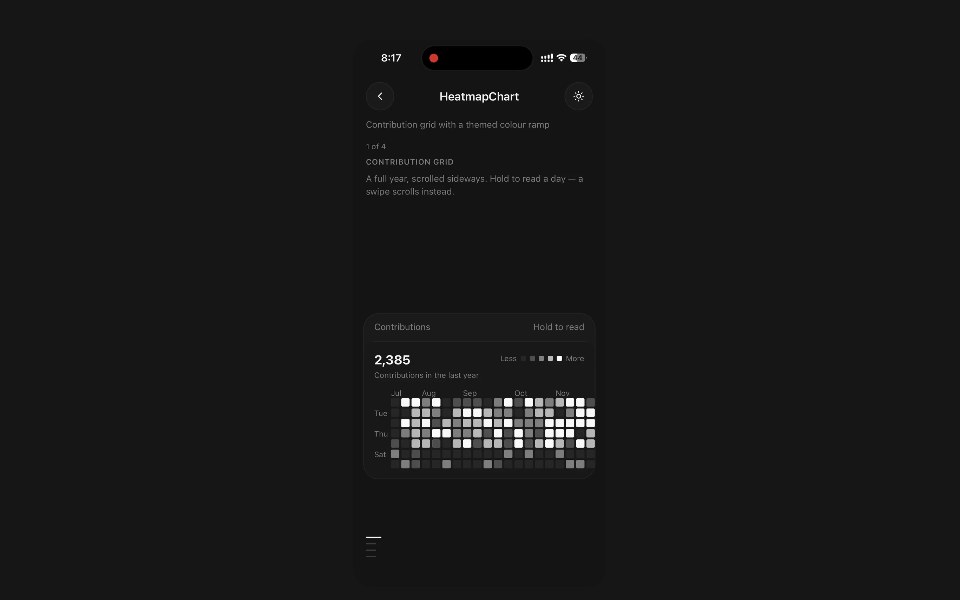 Heatmap ChartPanel UI · React NativeContribution grid with a themed colour ramp and a readout.
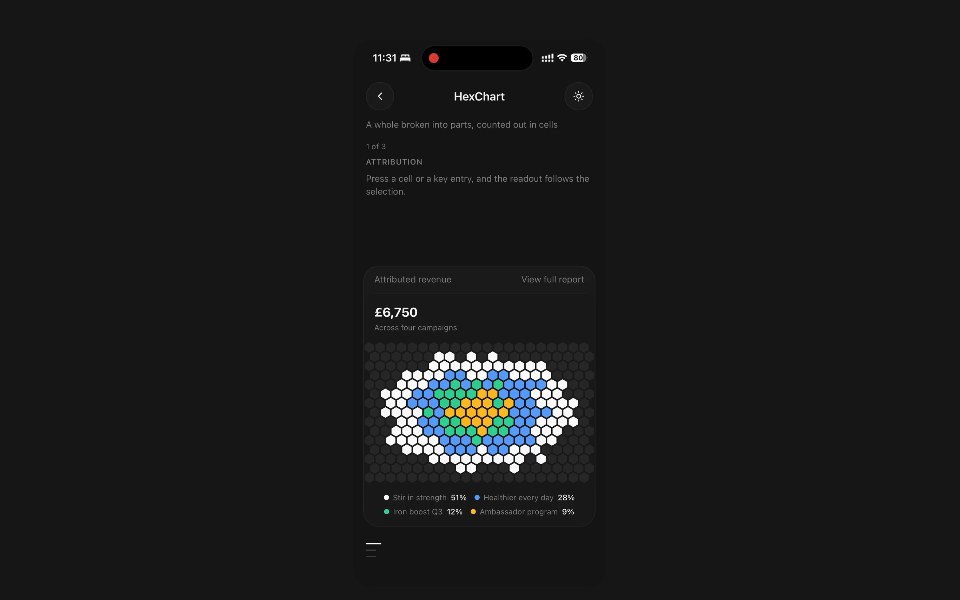 Hex ChartPanel UI · React NativeA whole broken into parts, counted out in cells.
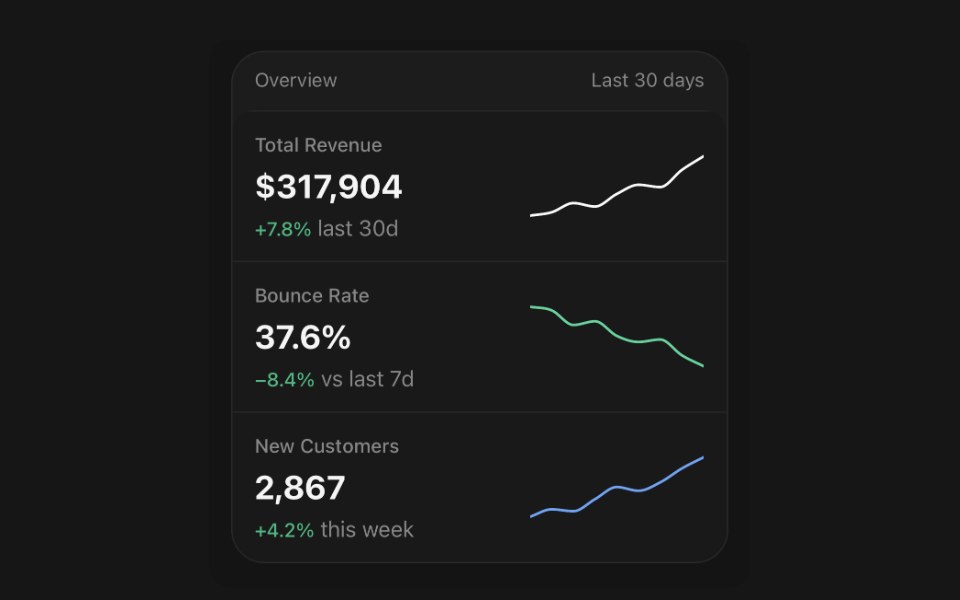 KpiPanel UI · React NativeOne number, what it is doing, and the shape it made getting there.
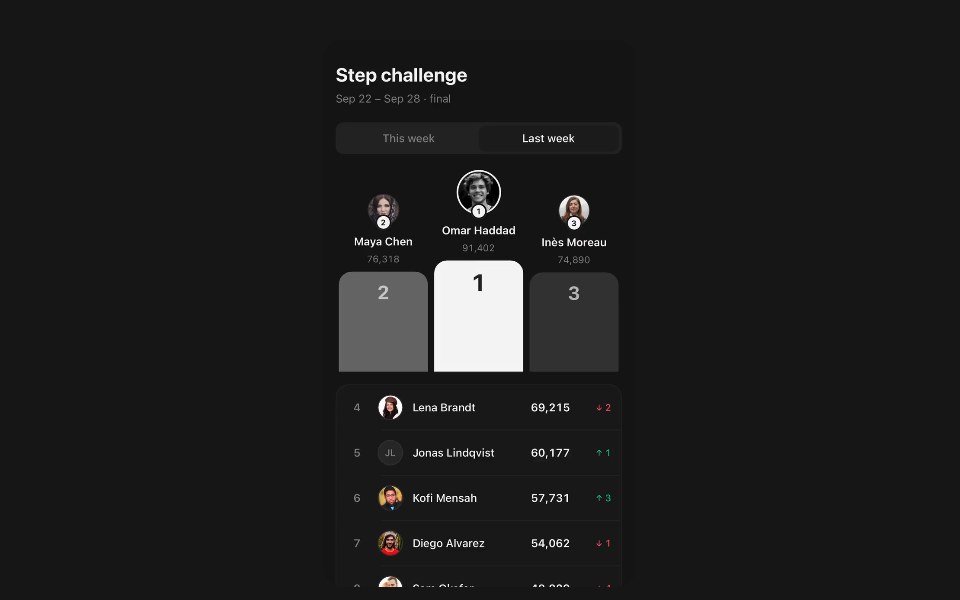 LeaderboardPanel UI · React NativeEntries ranked by a value, with the top three on a podium.
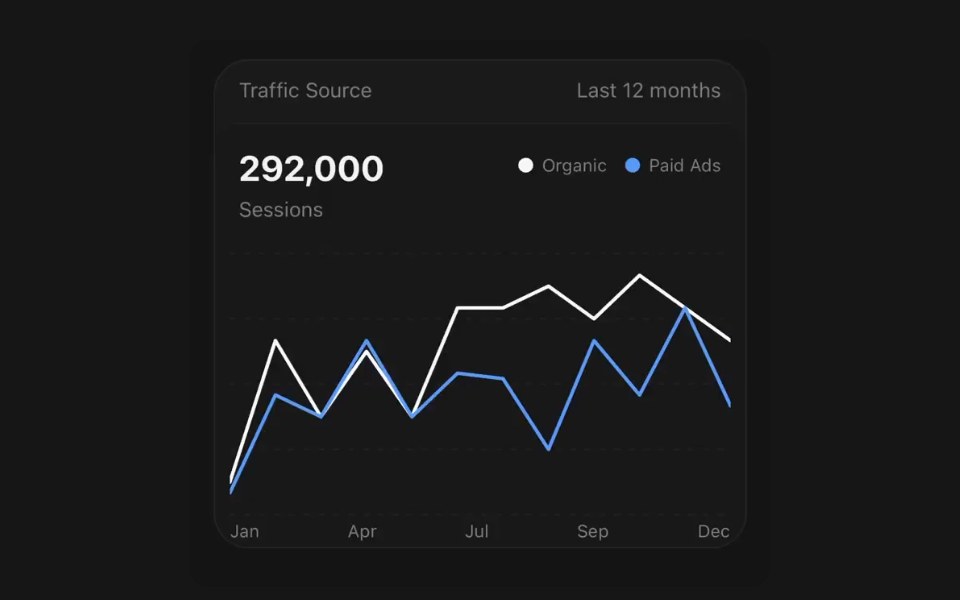 Line ChartPanel UI · React NativeAnimated time series, drawn on the UI thread.
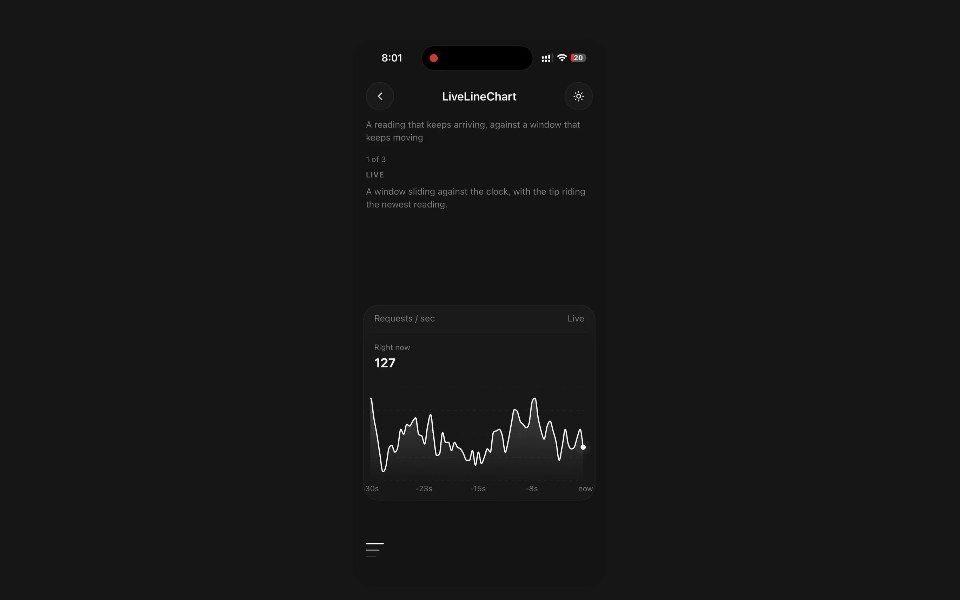 Live Line ChartPanel UI · React NativeA reading that keeps arriving, against a window that keeps moving.
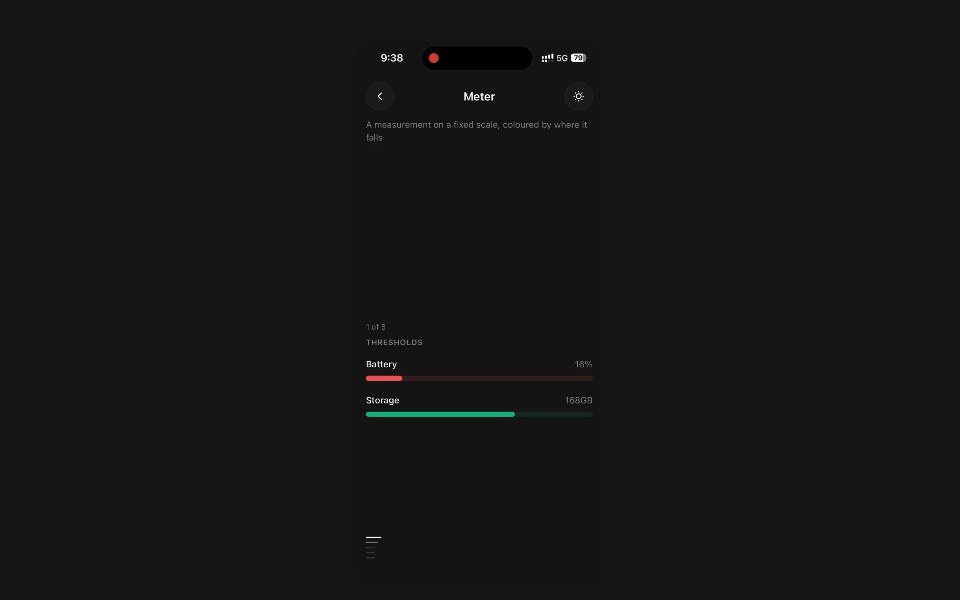 MeterPanel UI · React NativeA measurement on a fixed scale, coloured by where it falls.
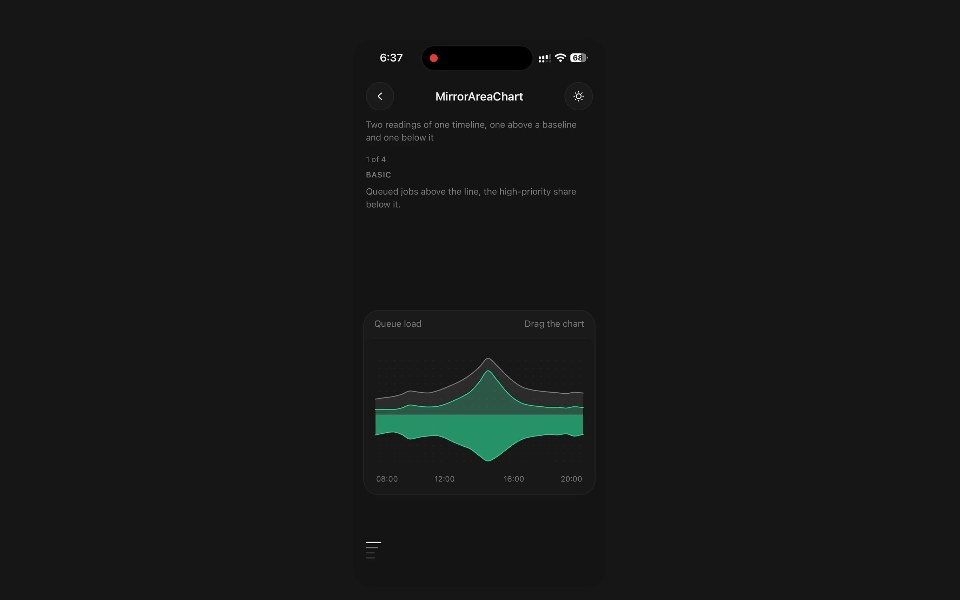 Mirror Area ChartPanel UI · React NativeTwo readings of one timeline, one above a baseline and one below it.
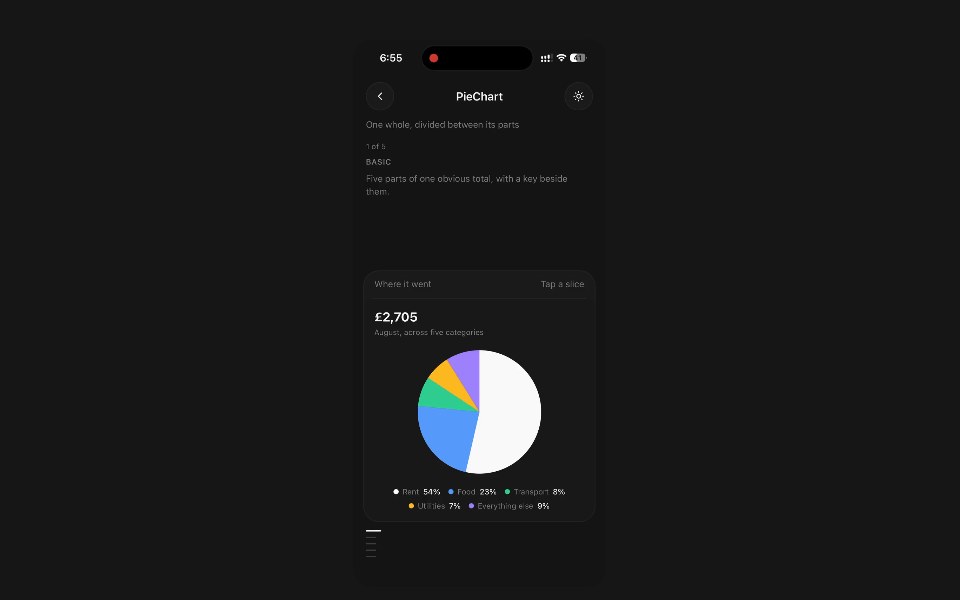 Pie ChartPanel UI · React NativeOne whole, divided between its parts.
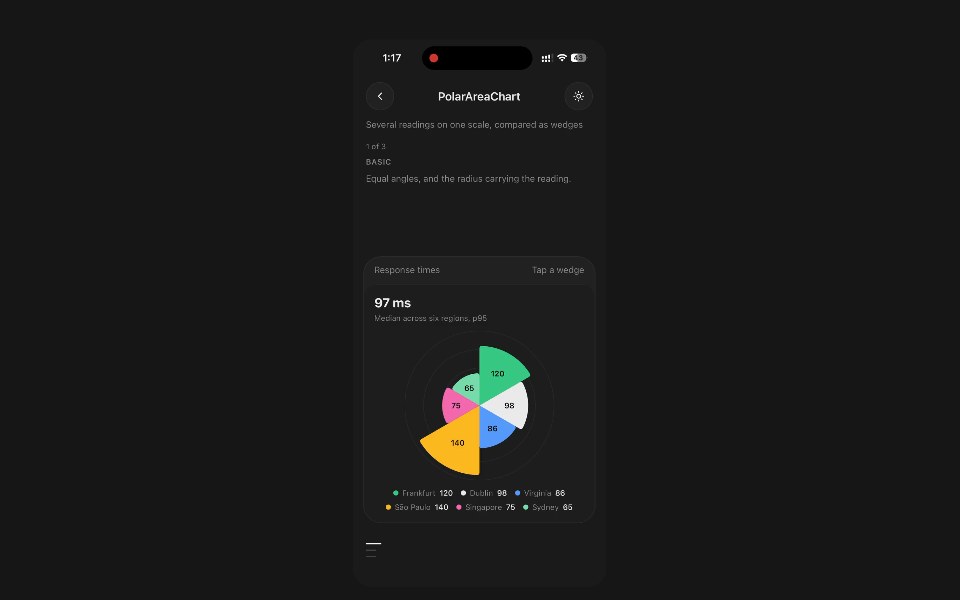 Polar Area ChartPanel UI · React NativeSeveral readings on one scale, compared as wedges.
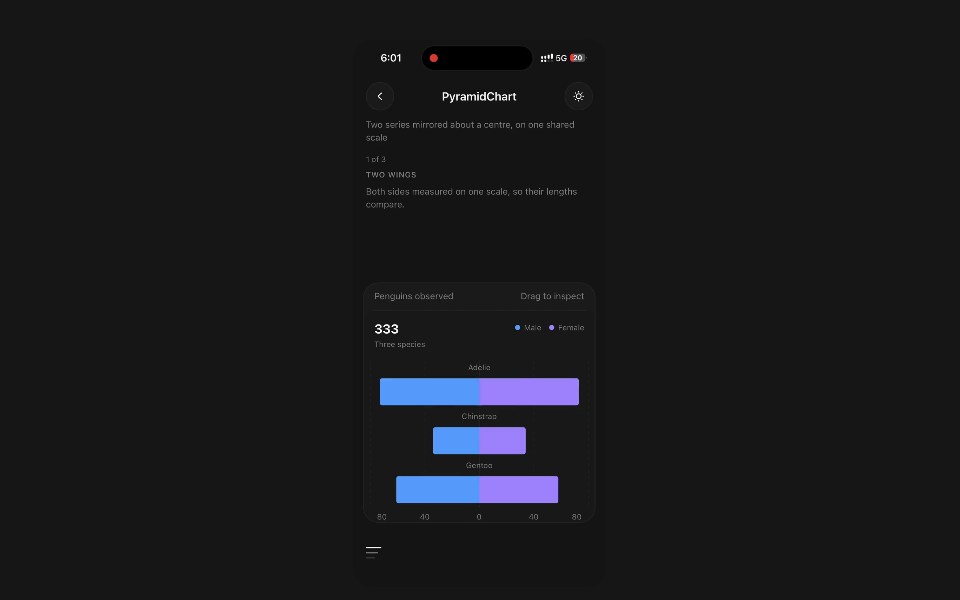 Pyramid ChartPanel UI · React NativeTwo series mirrored about a centre, on one shared scale.
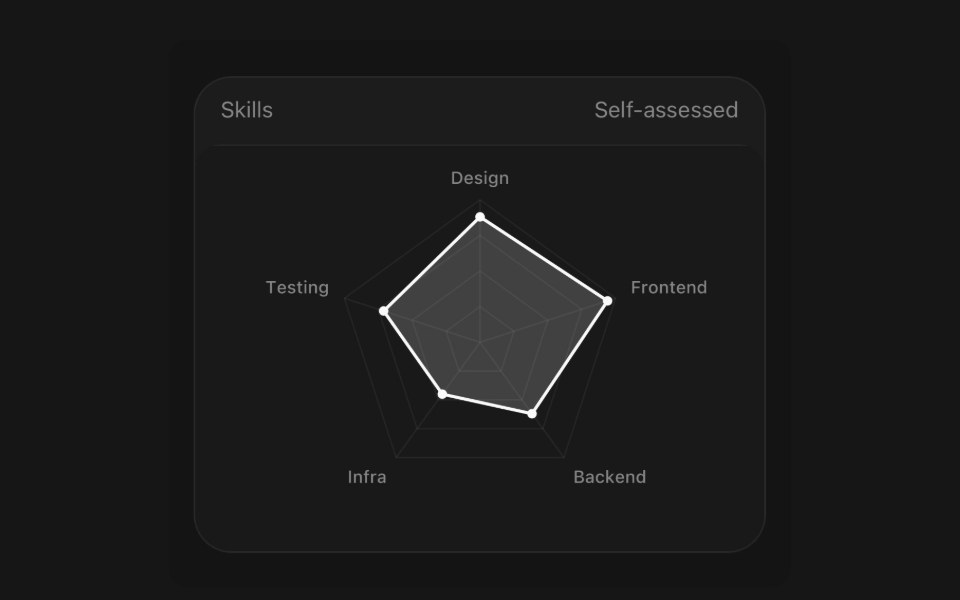 Radar ChartPanel UI · React NativeSeveral measures of one thing, drawn as one shape.
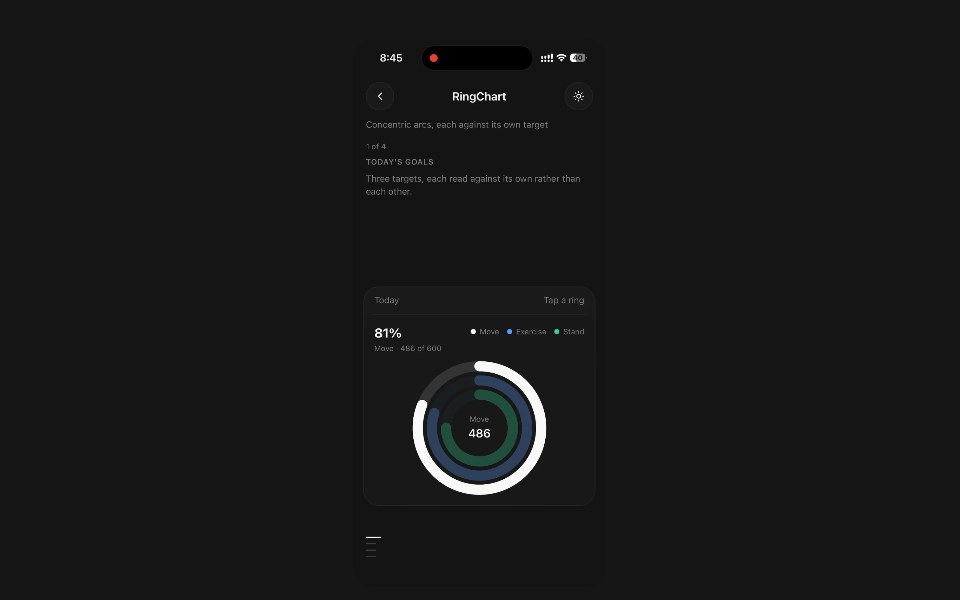 Ring ChartPanel UI · React NativeConcentric arcs, each measured against its own target.
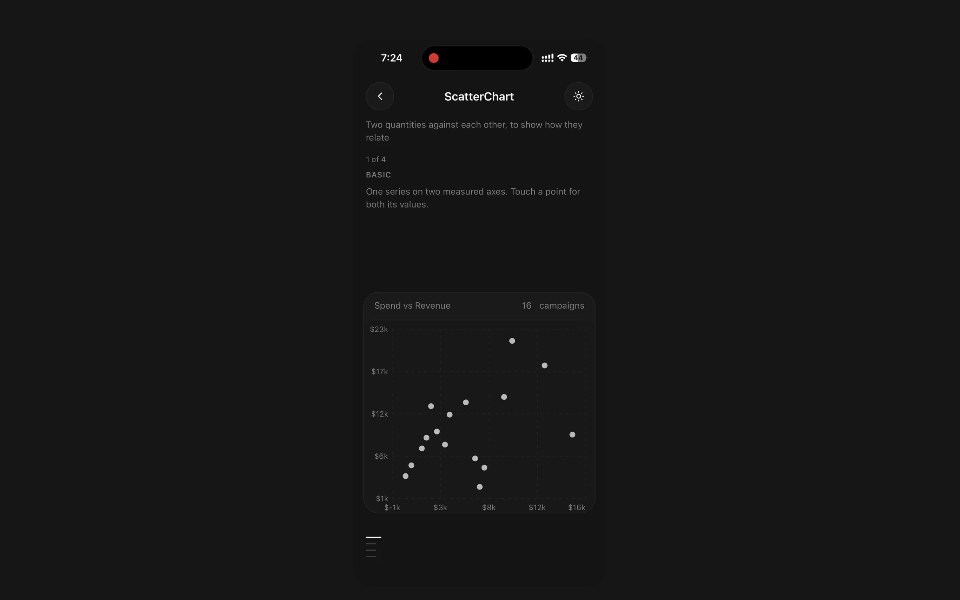 Scatter ChartPanel UI · React NativeTwo quantities against each other, to show how they relate.
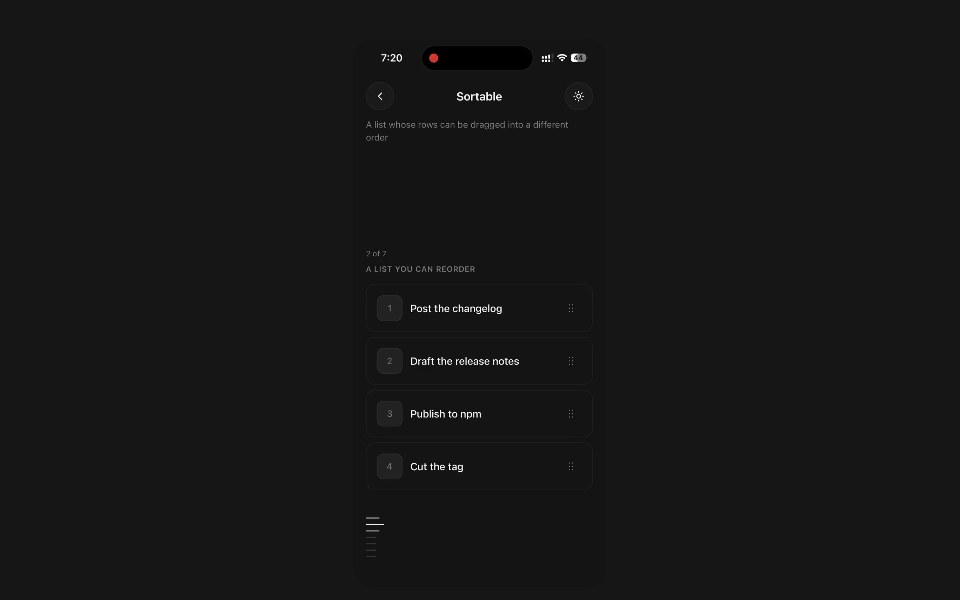 SortablePanel UI · React NativeA list whose rows can be dragged into a different order.
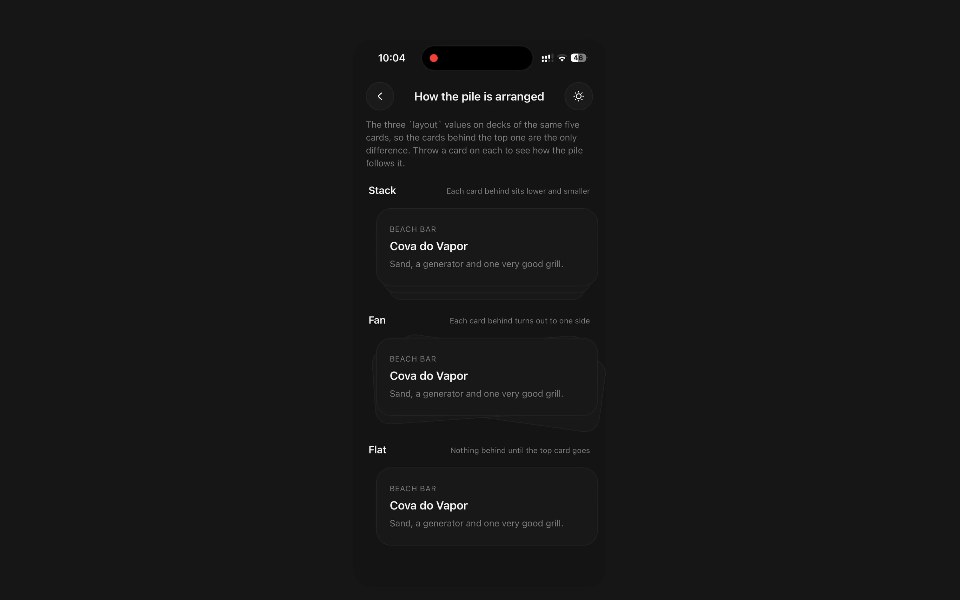 Stack CardPanel UI · React NativeA pile of cards, taken one at a time by throwing the top one off.
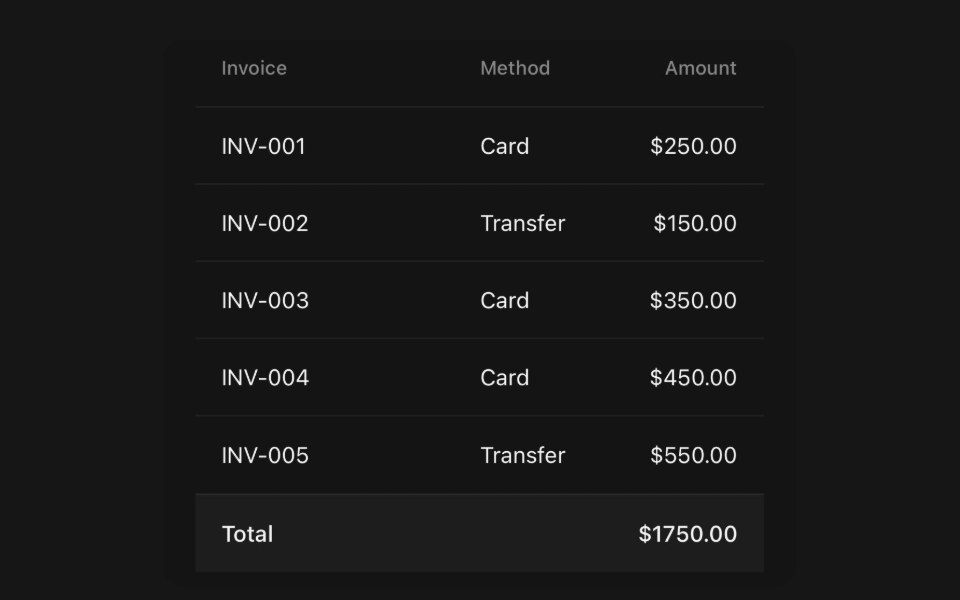 TablePanel UI · React NativeRows and columns that stay lined up, with sortable headers.
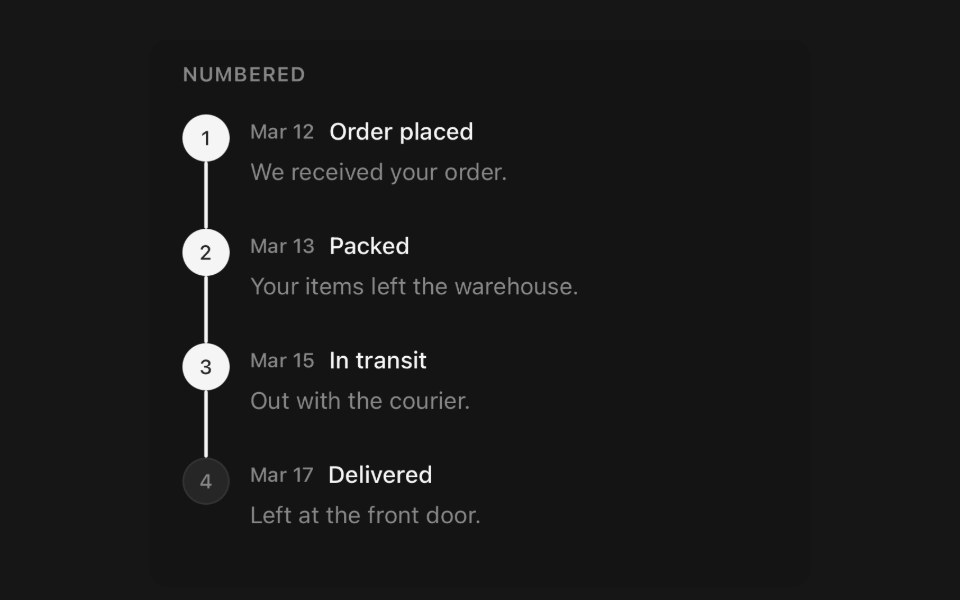 TimelinePanel UI · React NativeA sequence of events, vertical or swiped sideways.
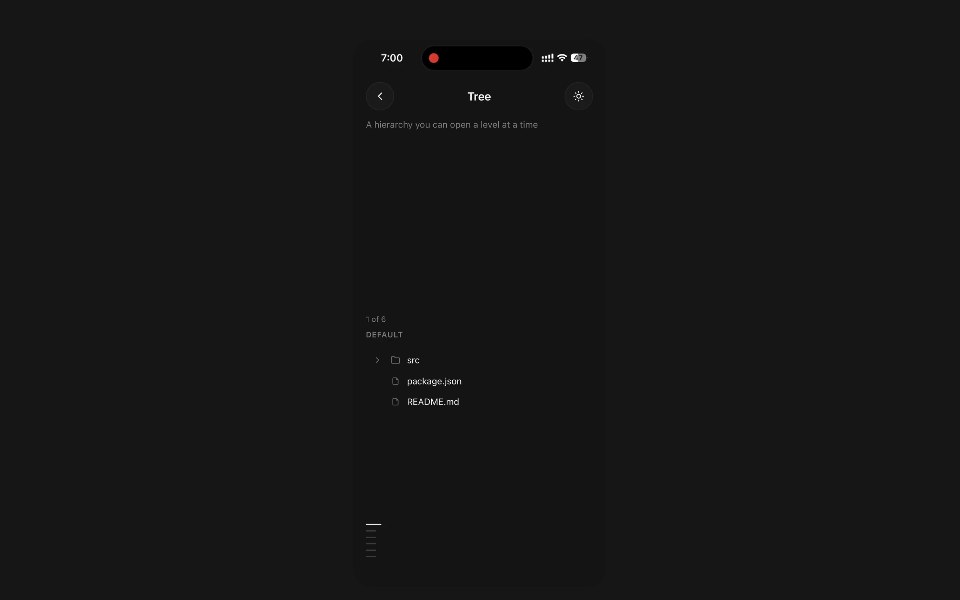 TreePanel UI · React NativeA hierarchy you can open a level at a time.
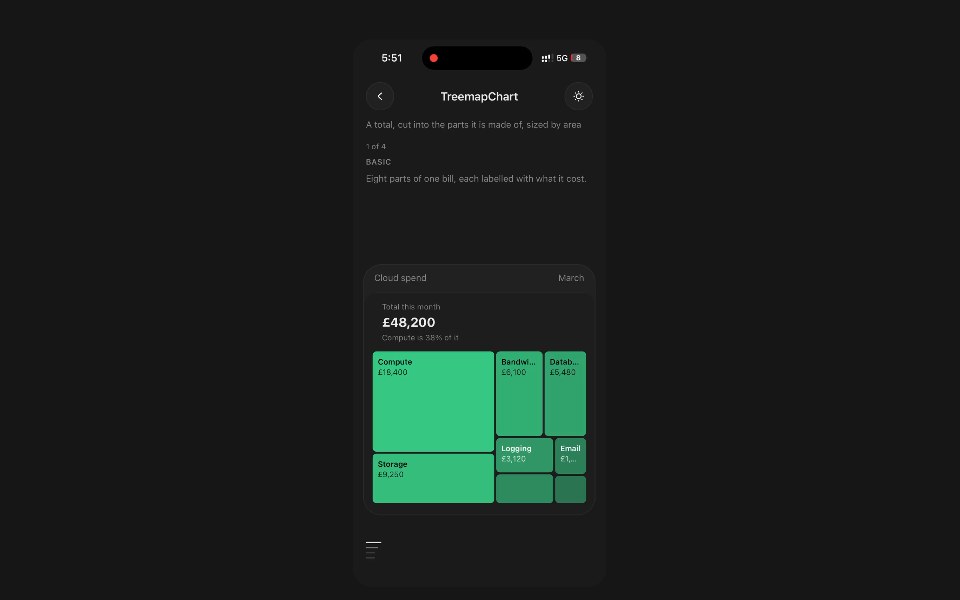 Treemap ChartPanel UI · React NativeA total, cut into the parts it is made of, sized by area.
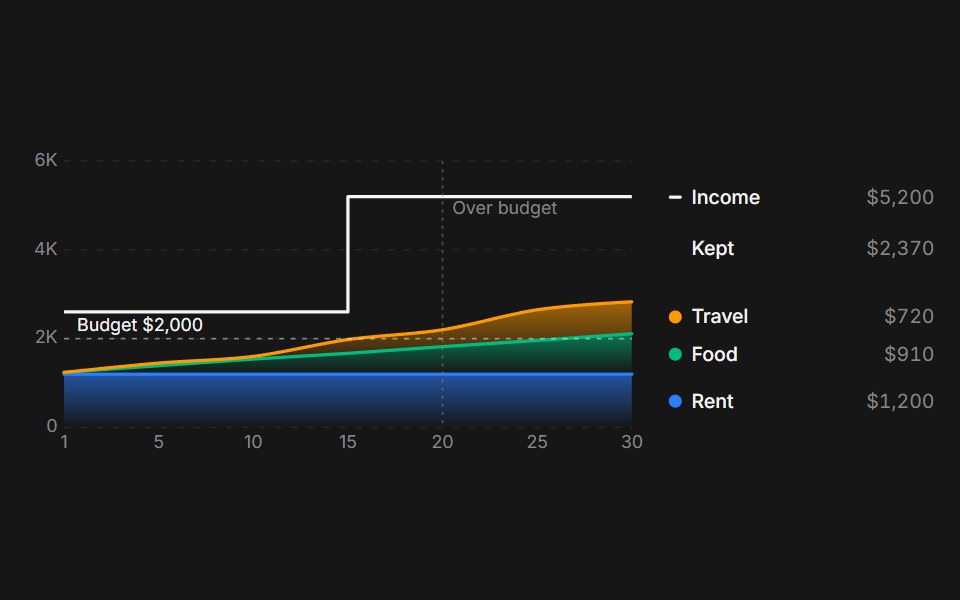 Web Area ChartPanel UI · React NativeArea charts with replay, hover readout and variants such as budget lines and stacked series.
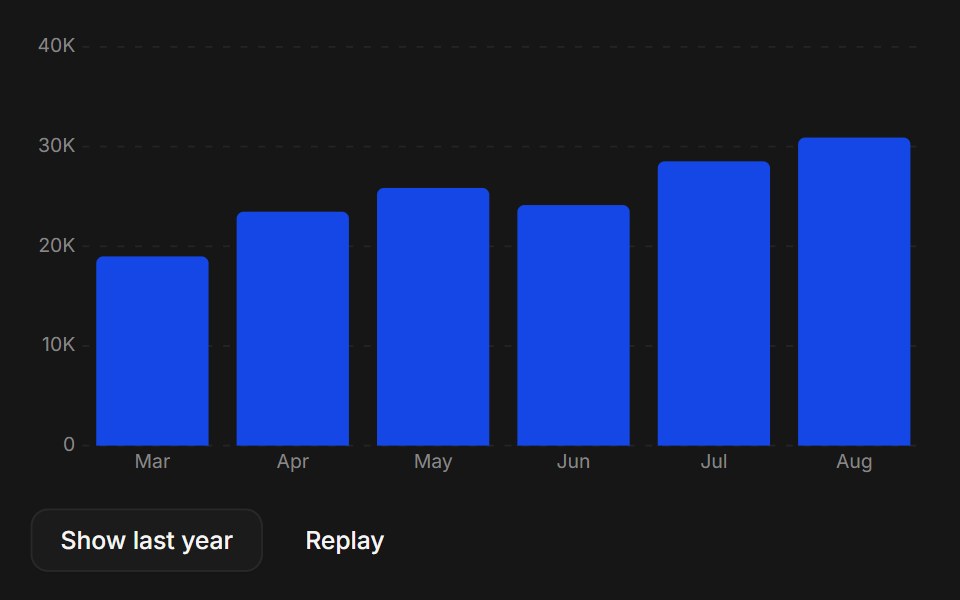 Web Bar ChartPanel UI · React NativeBar charts with replay, keyboard reading and grouped or horizontal variants.
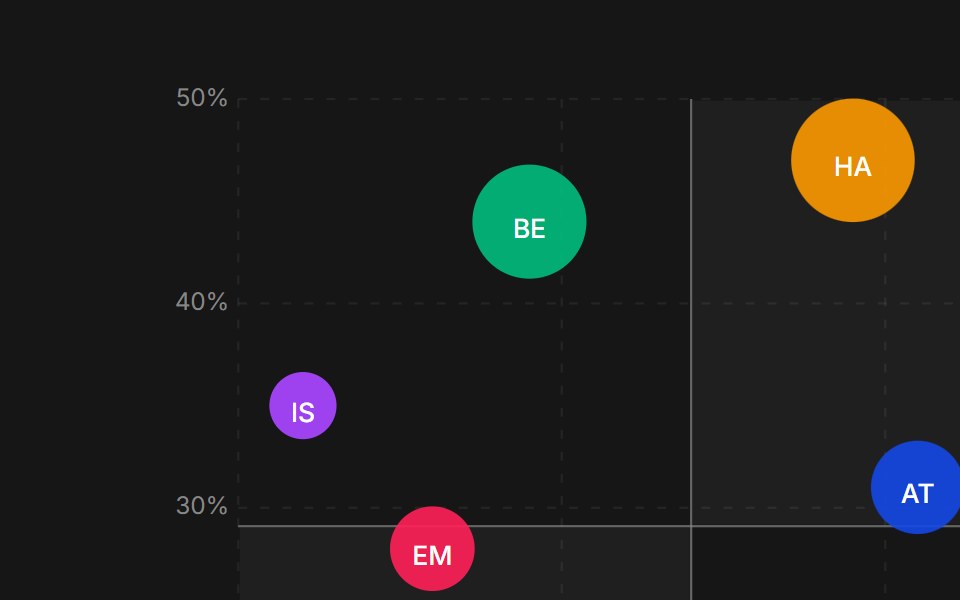 Web Bubble ChartPanel UI · React NativeA bubble chart plotting three values per point, such as growth, margin and revenue.
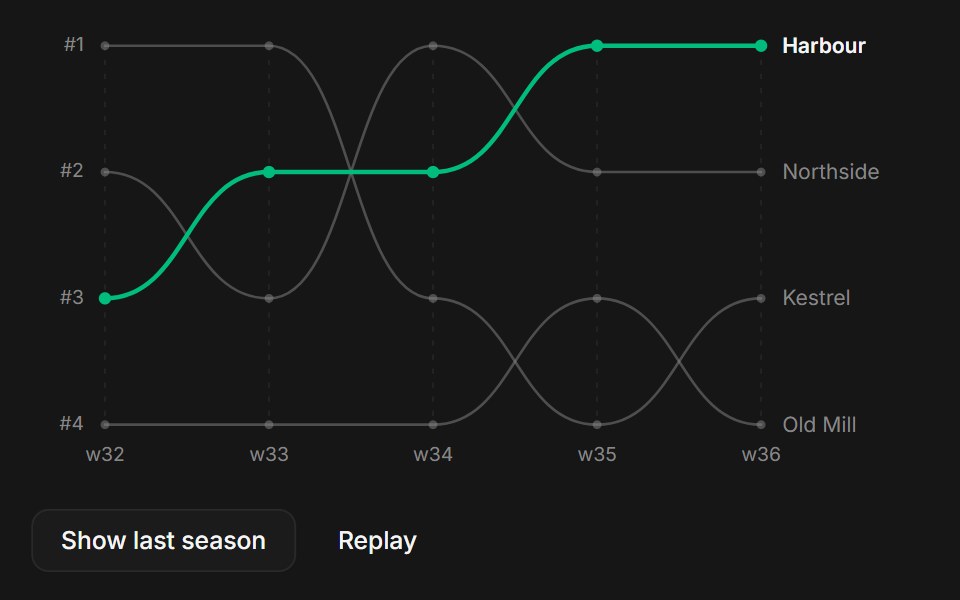 Web Bump ChartPanel UI · React NativeA bump chart that shows how rankings change over time, read by hover or keyboard.
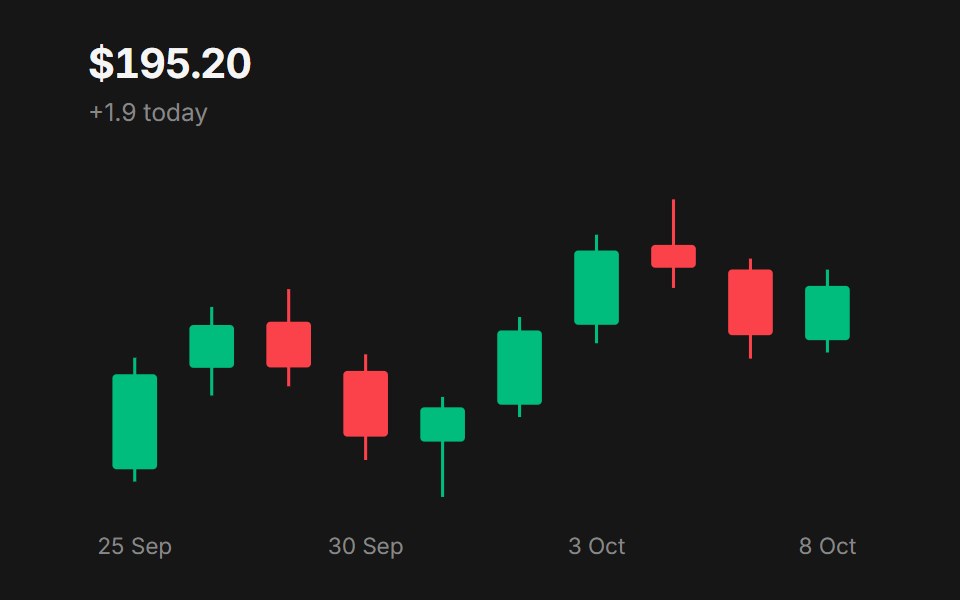 Web Candlestick ChartPanel UI · React NativeA candlestick chart for daily price data with a hover readout.
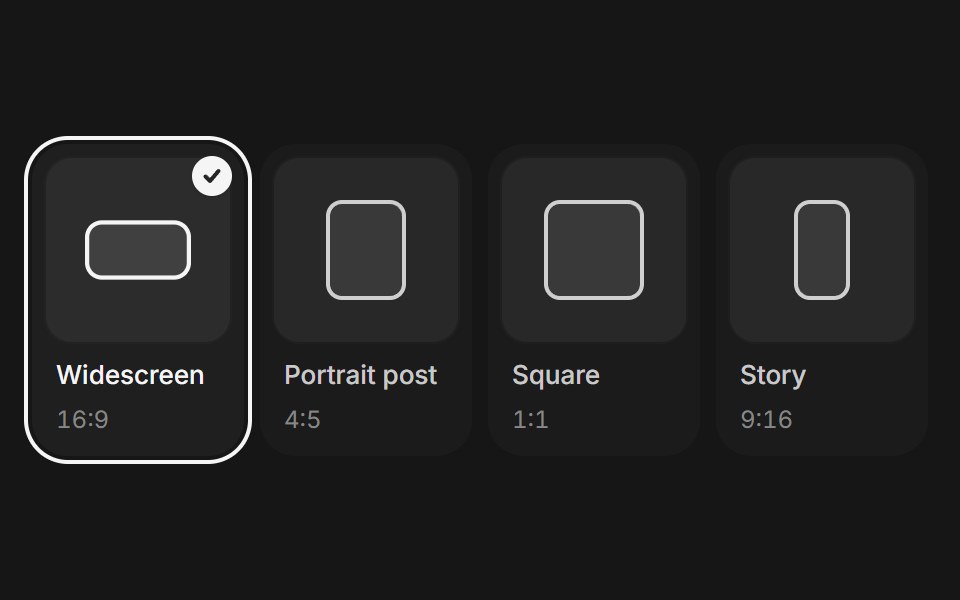 Web Choice CardsPanel UI · React NativeSelectable option cards for picking sizes, backgrounds or quality settings.
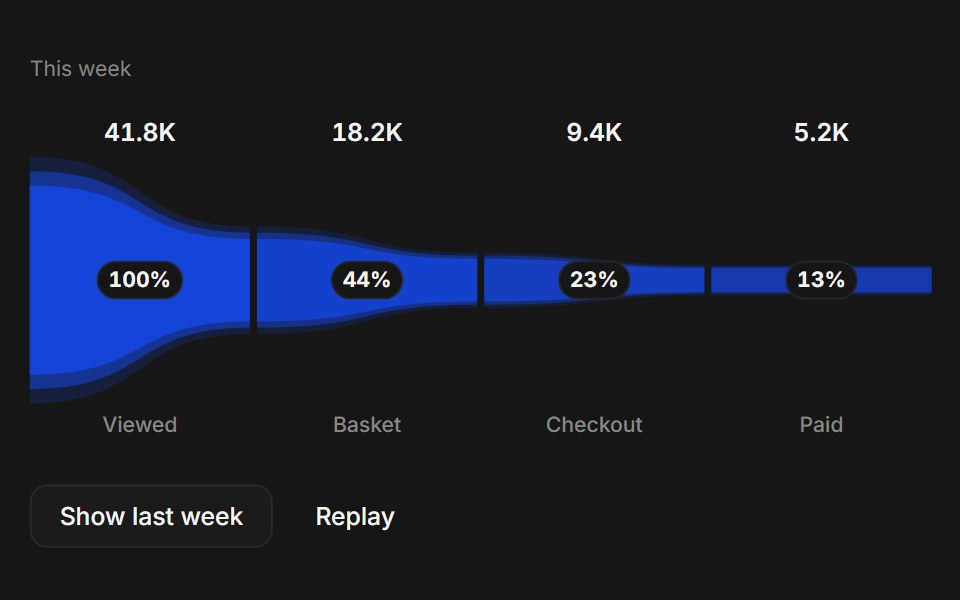 Web Funnel ChartPanel UI · React NativeA funnel chart showing conversion between stages, with share of the first and previous stage.
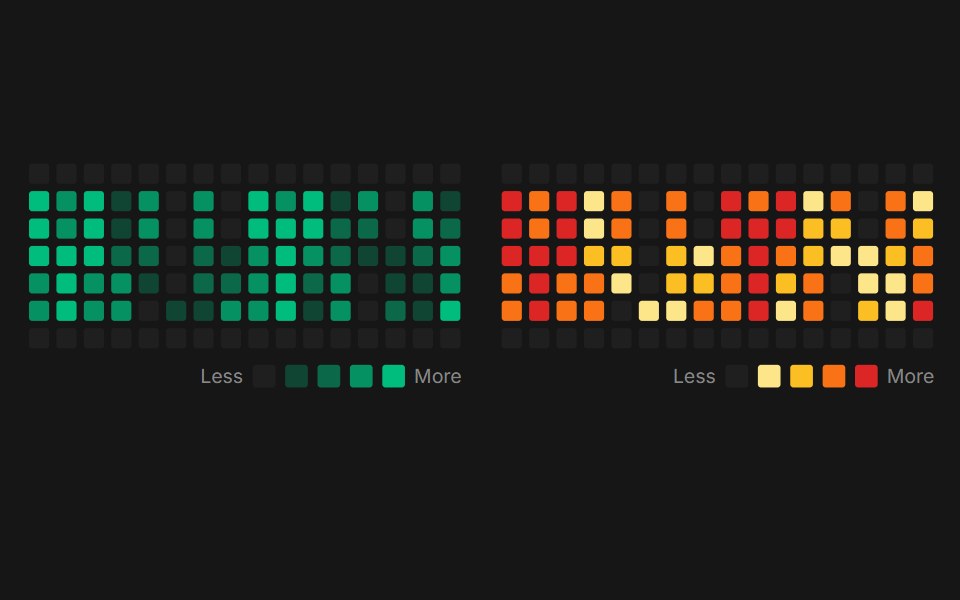 Web Heatmap ChartPanel UI · React NativeA calendar heatmap for a year of activity such as commits, deploys or spending.
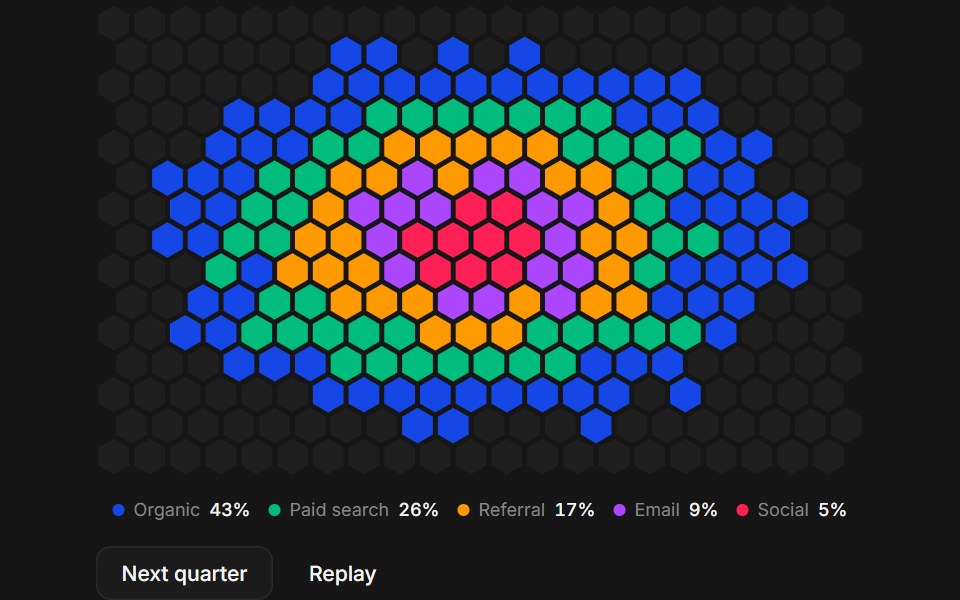 Web Hex ChartPanel UI · React NativeA hexagon grid chart for attribution and fill rates, with replay and hover.
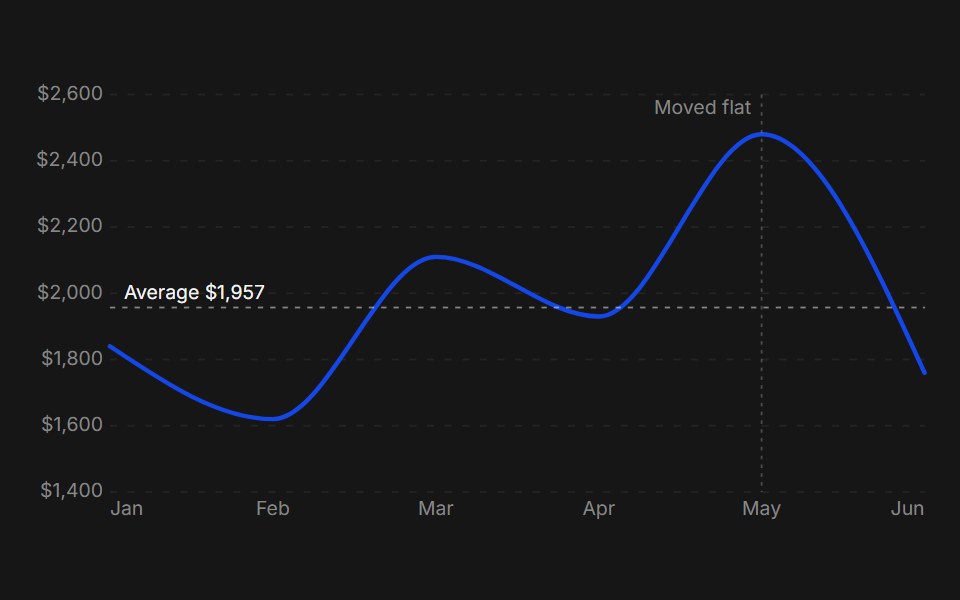 Web Line ChartPanel UI · React NativeLine charts with drag to inspect, averages and replay.
 Web Live Line ChartPanel UI · React NativeA live line chart that streams values in real time, such as requests per second.
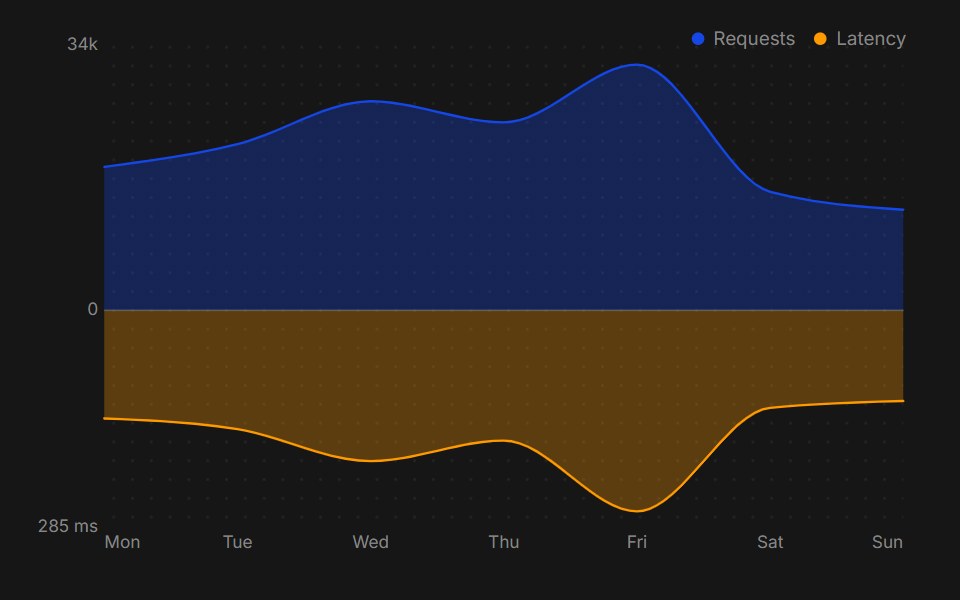 Web Mirror Area ChartPanel UI · React NativeA mirrored area chart comparing two series above and below one axis.
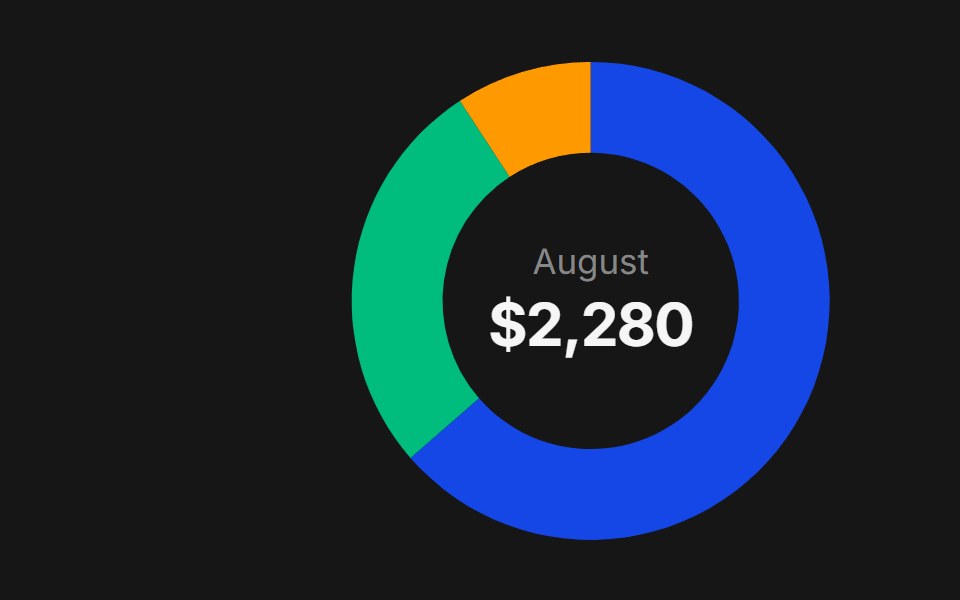 Web Pie ChartPanel UI · React NativeA pie chart with hover detail and toggles to show or hide slices.
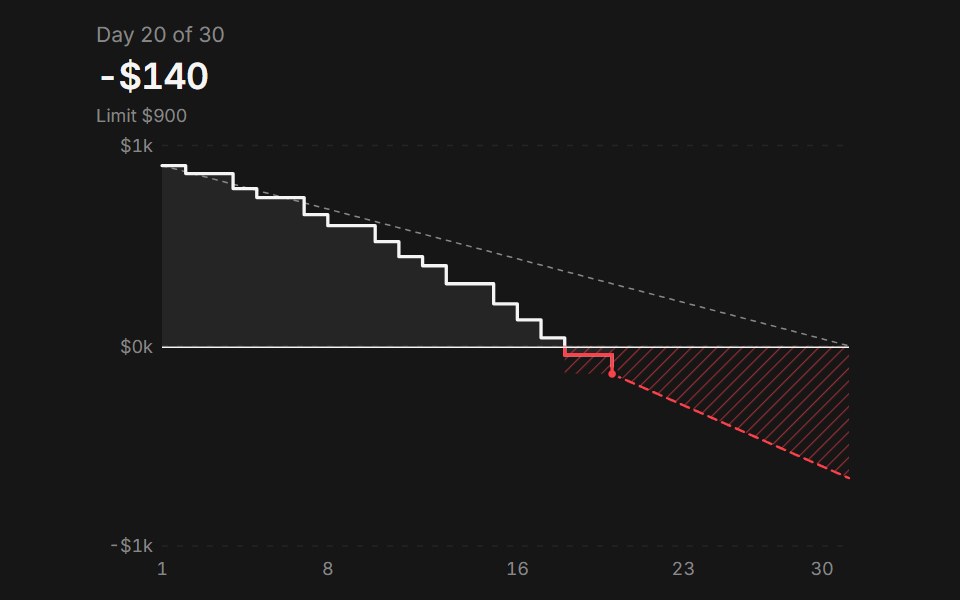 Web PlotPanel UI · React NativeA general plot for budgets and change against plan, with selectable points.
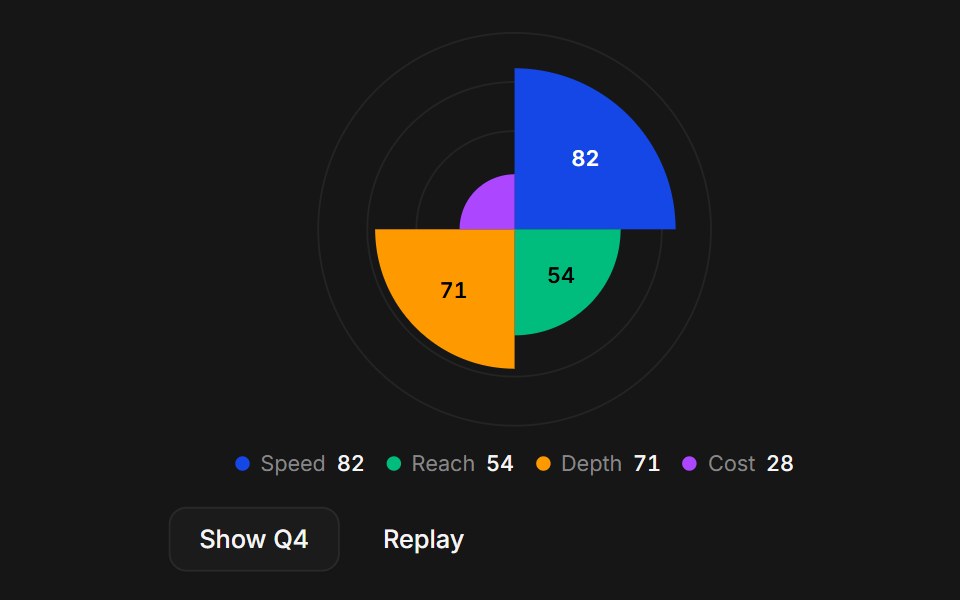 Web Polar Area ChartPanel UI · React NativeA polar area chart comparing scores across categories.
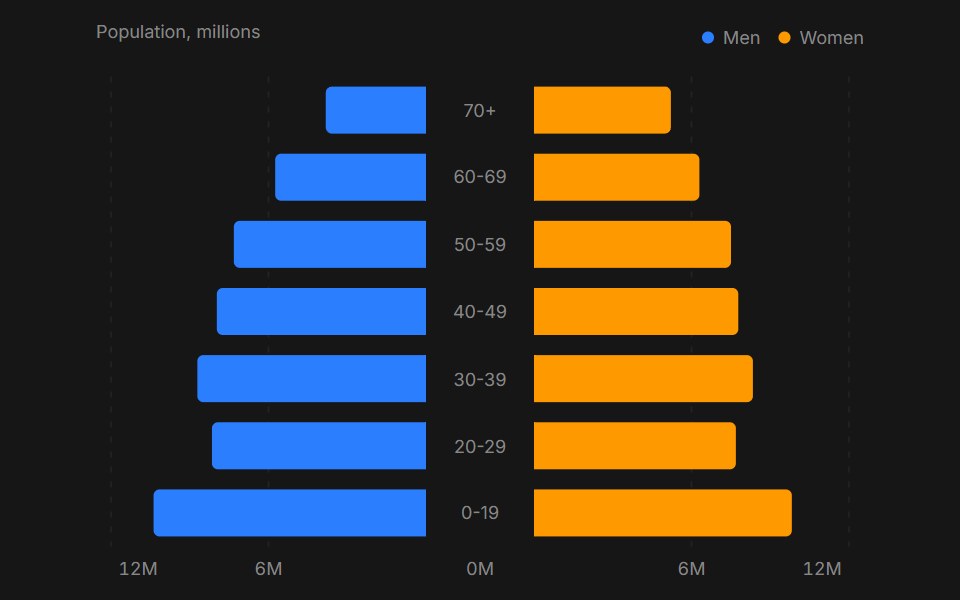 Web Pyramid ChartPanel UI · React NativeA population pyramid chart with two sides read by hover.
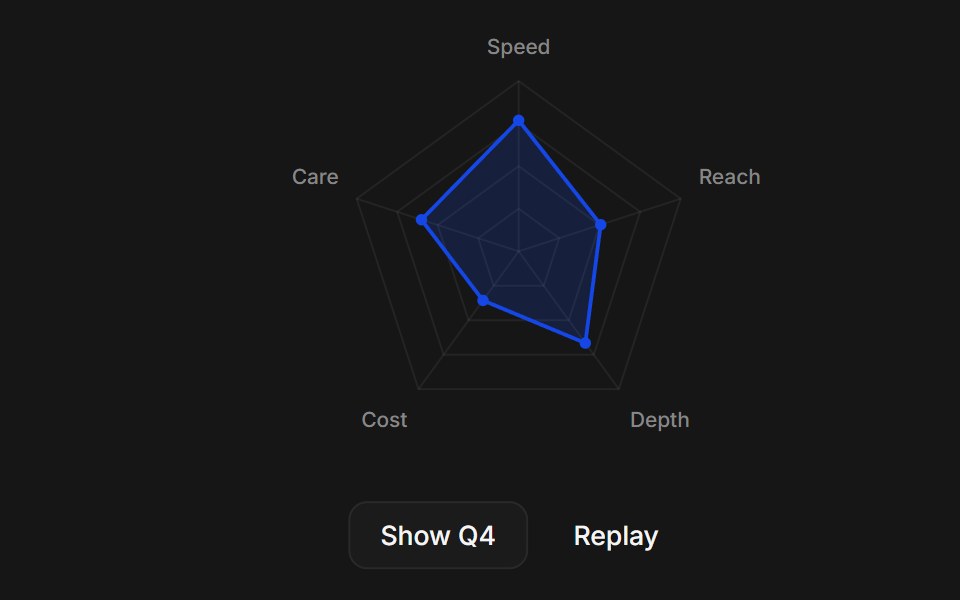 Web Radar ChartPanel UI · React NativeA radar chart comparing a profile against a team across several axes.
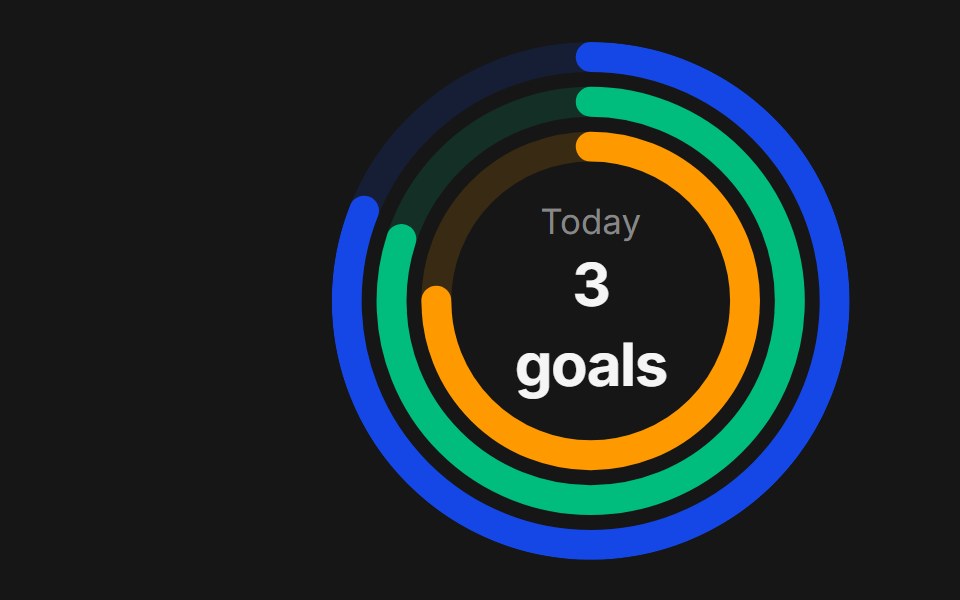 Web Ring ChartPanel UI · React NativeActivity rings that fill toward daily goals, with replay and toggles.
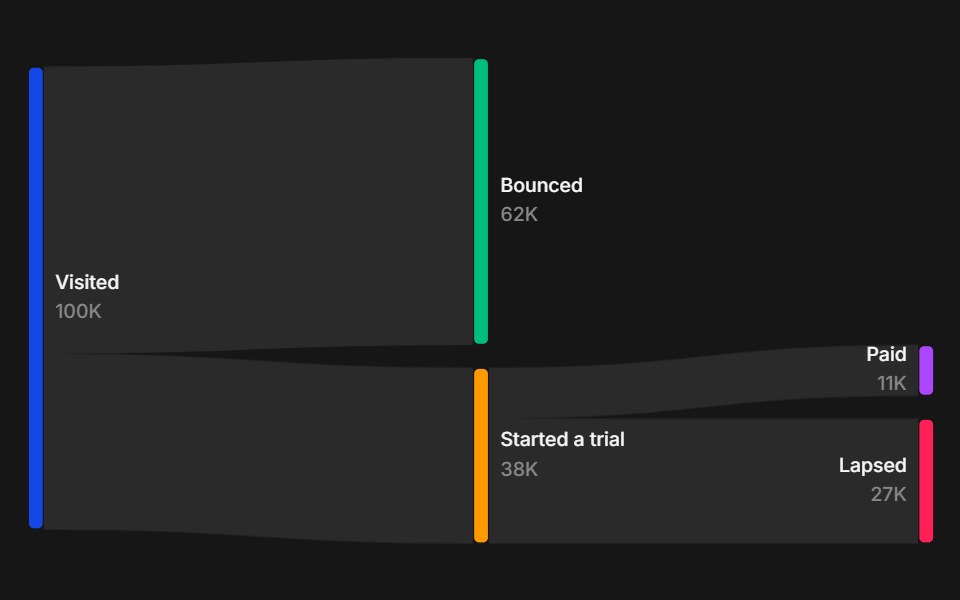 Web Sankey ChartPanel UI · React NativeA Sankey chart showing flows from sources to categories.
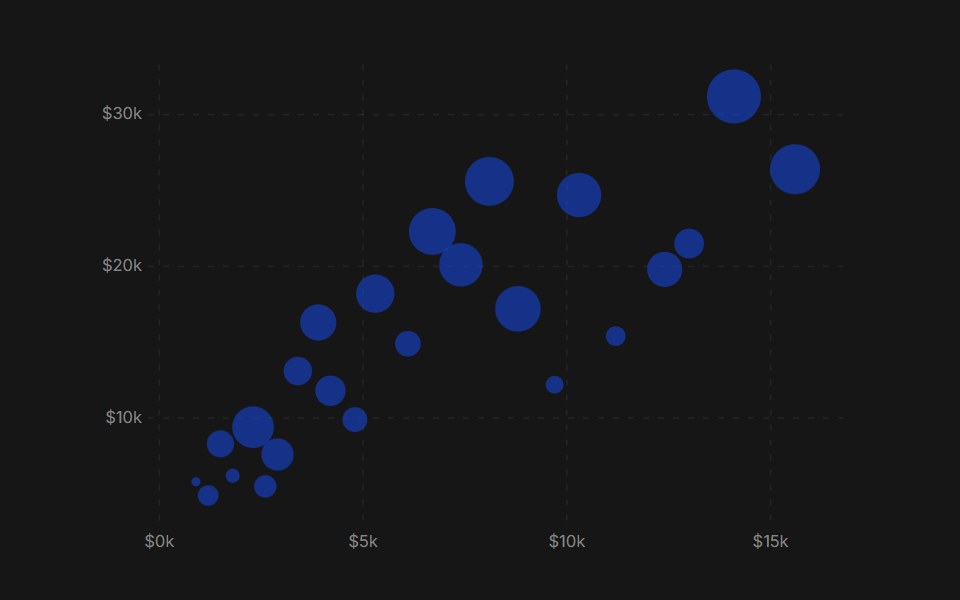 Web Scatter ChartPanel UI · React NativeA scatter chart plotting spend against revenue or dose against response.
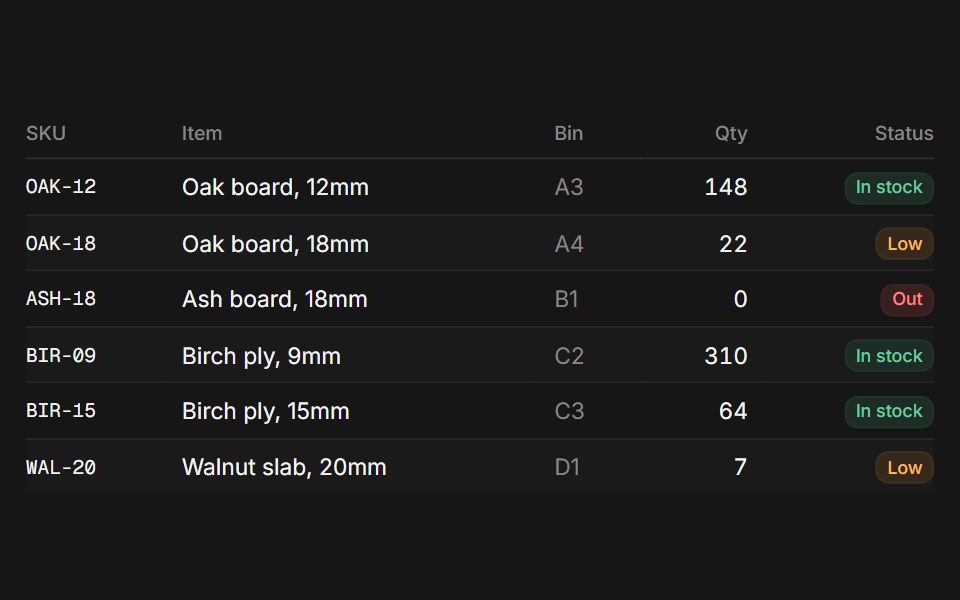 Web TablePanel UI · React NativeA plain data table for inventory and member lists.
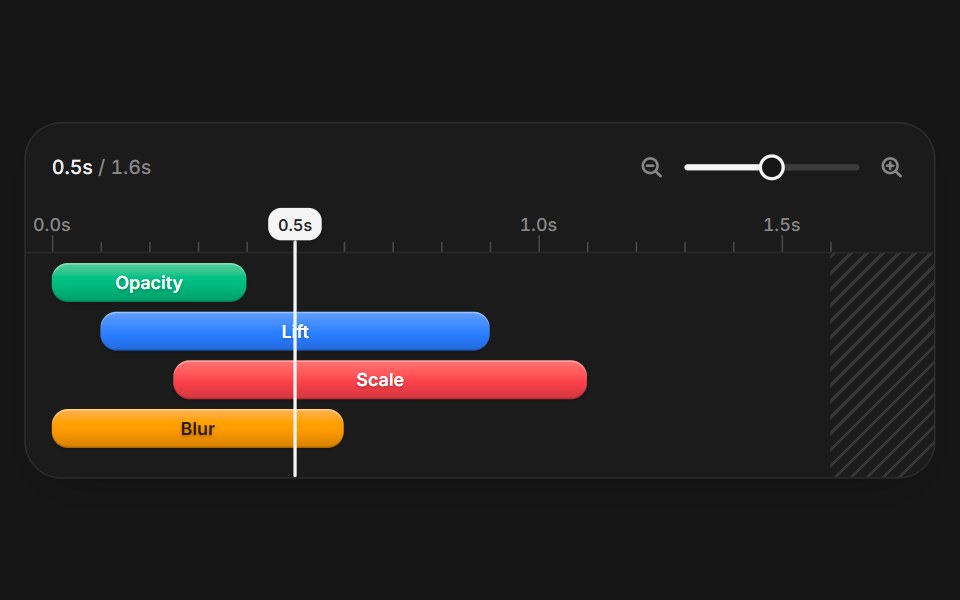 Web TimelinePanel UI · React NativeA video editing timeline with clips, playback and undo and redo.
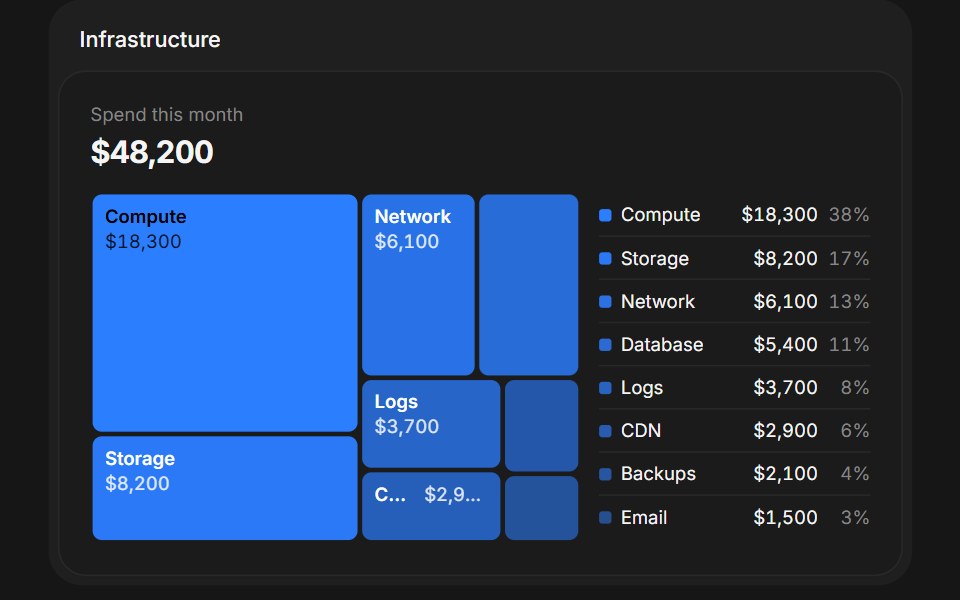 Web Treemap ChartPanel UI · React NativeA treemap of spend by category that highlights what is over budget.
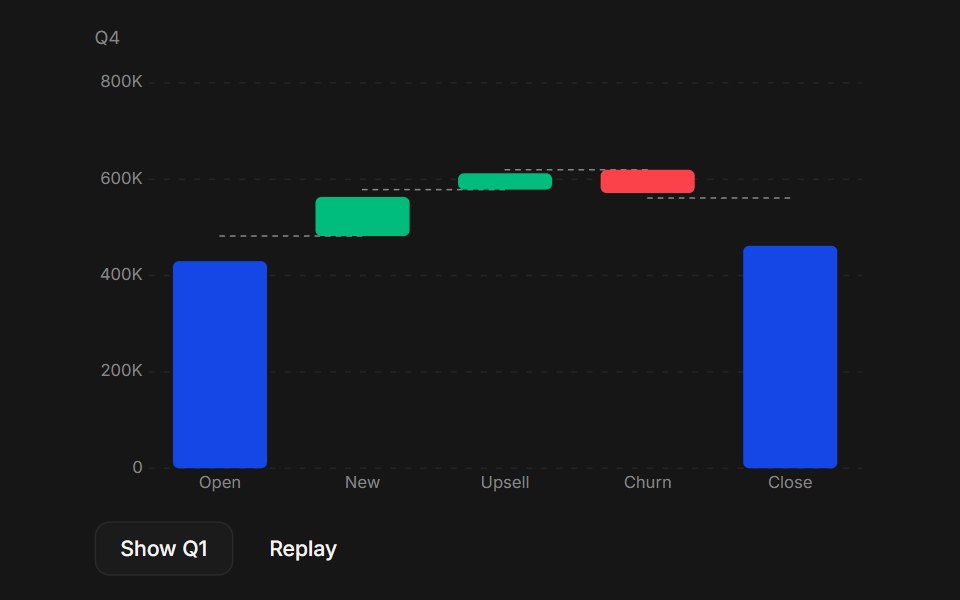 Web Waterfall ChartPanel UI · React NativeA waterfall chart for revenue bridges and budget variance.
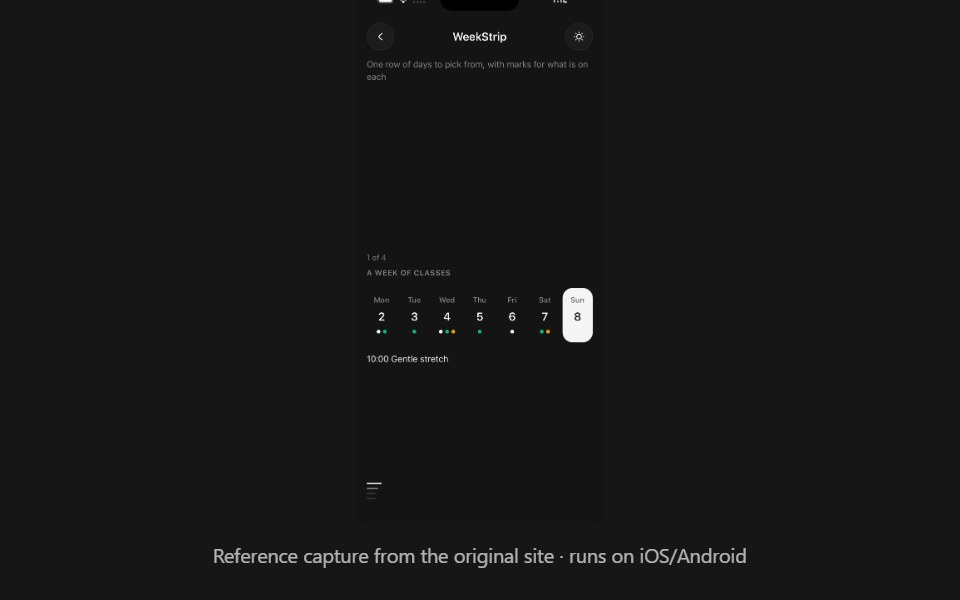 Week StripPanel UI · React NativeOne row of days to pick from, with marks for what is on each.
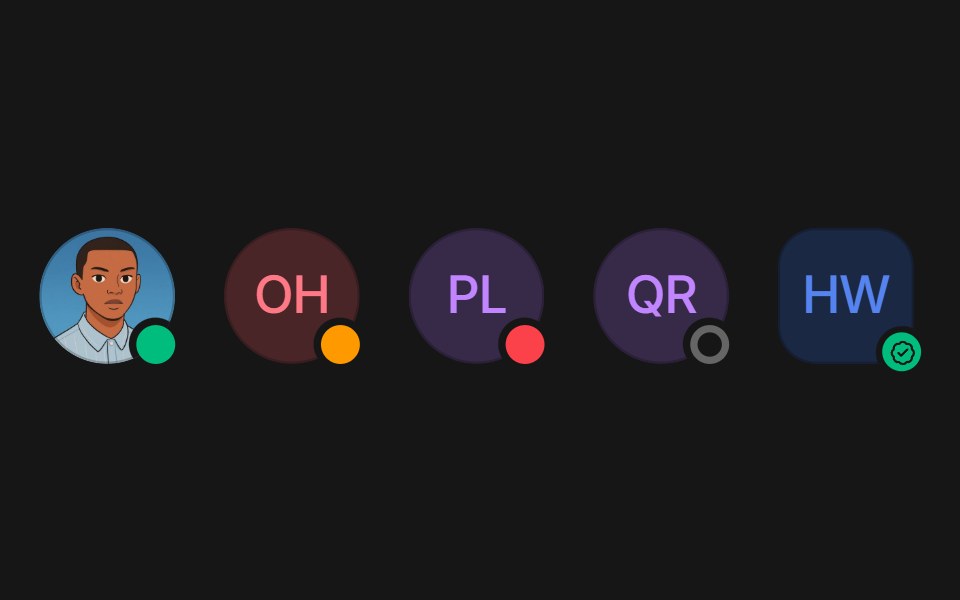 Web AvatarPanel UI · React Native
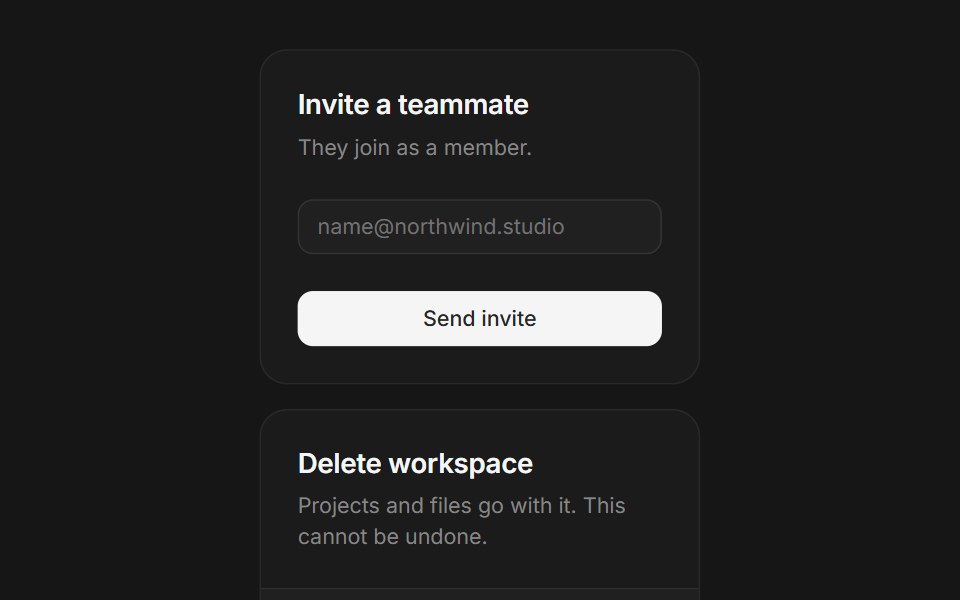 Web CardPanel UI · React Native
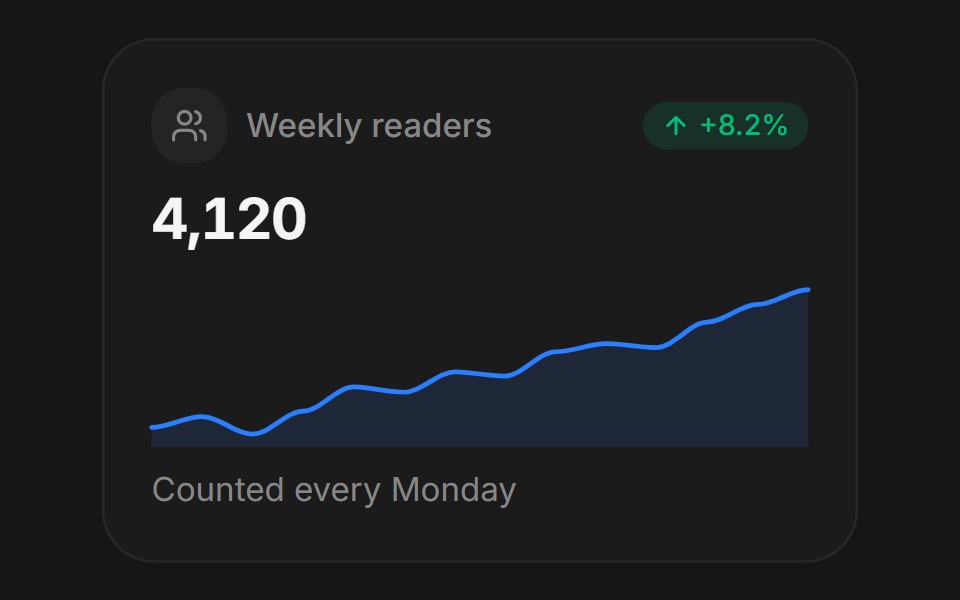 Web KpiPanel UI · React Native
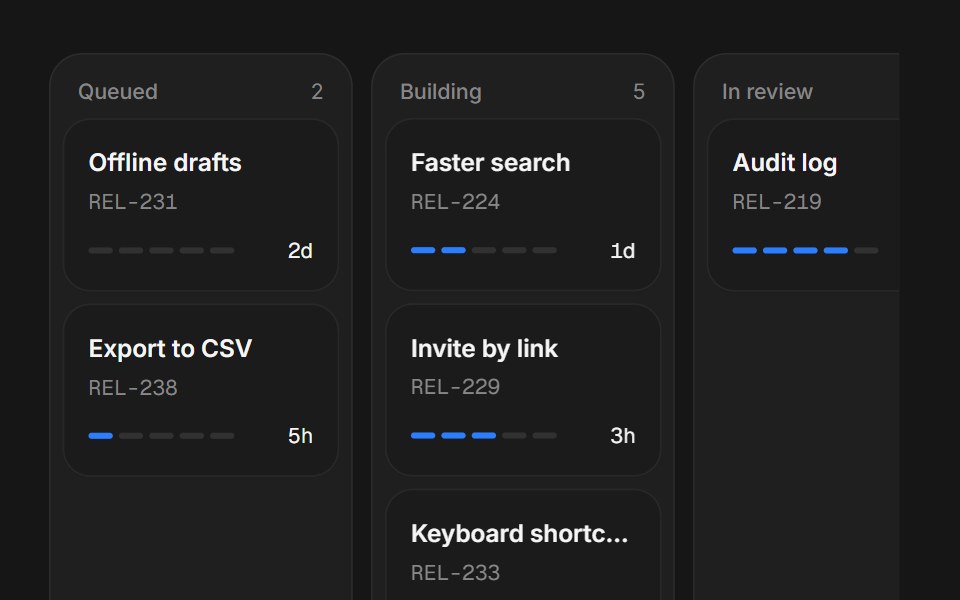 Web Lane BoardPanel UI · React Native
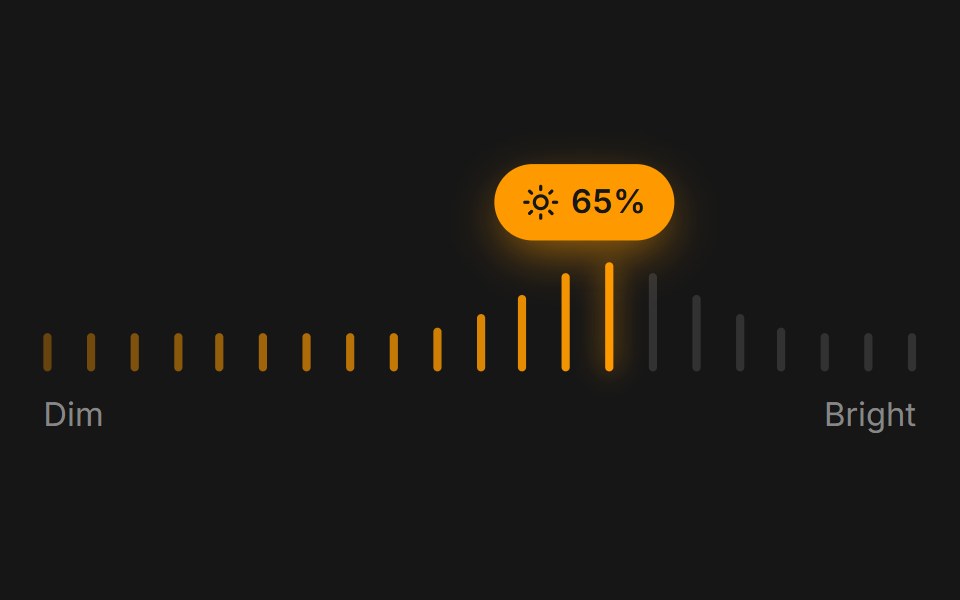 Web Range MeterPanel UI · React Native
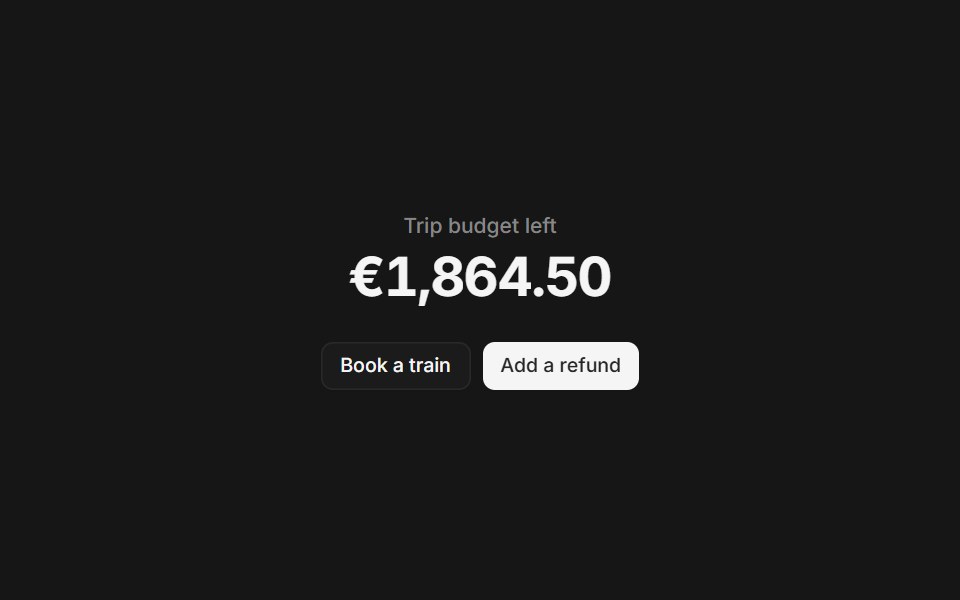 Web Rolling NumberPanel UI · React Native
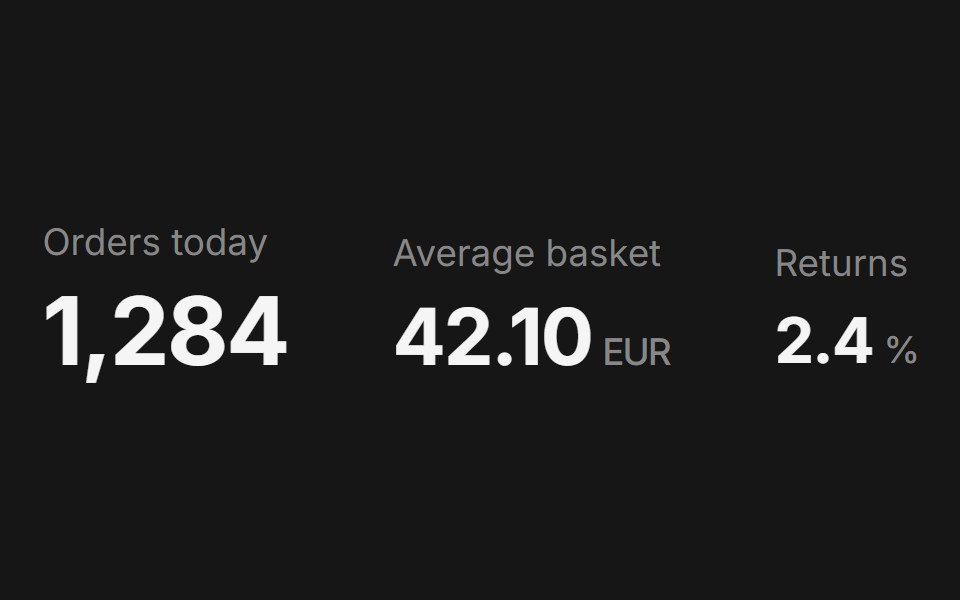 Web StatPanel UI · React Native
 Web Tilt CardPanel UI · React Native